Cities with the Highest Percentage of Households with Income Above $200,000 in Oklahoma
RELATED REPORTS & OPTIONS
Household Income | $200k+
Oklahoma
Compare Cities
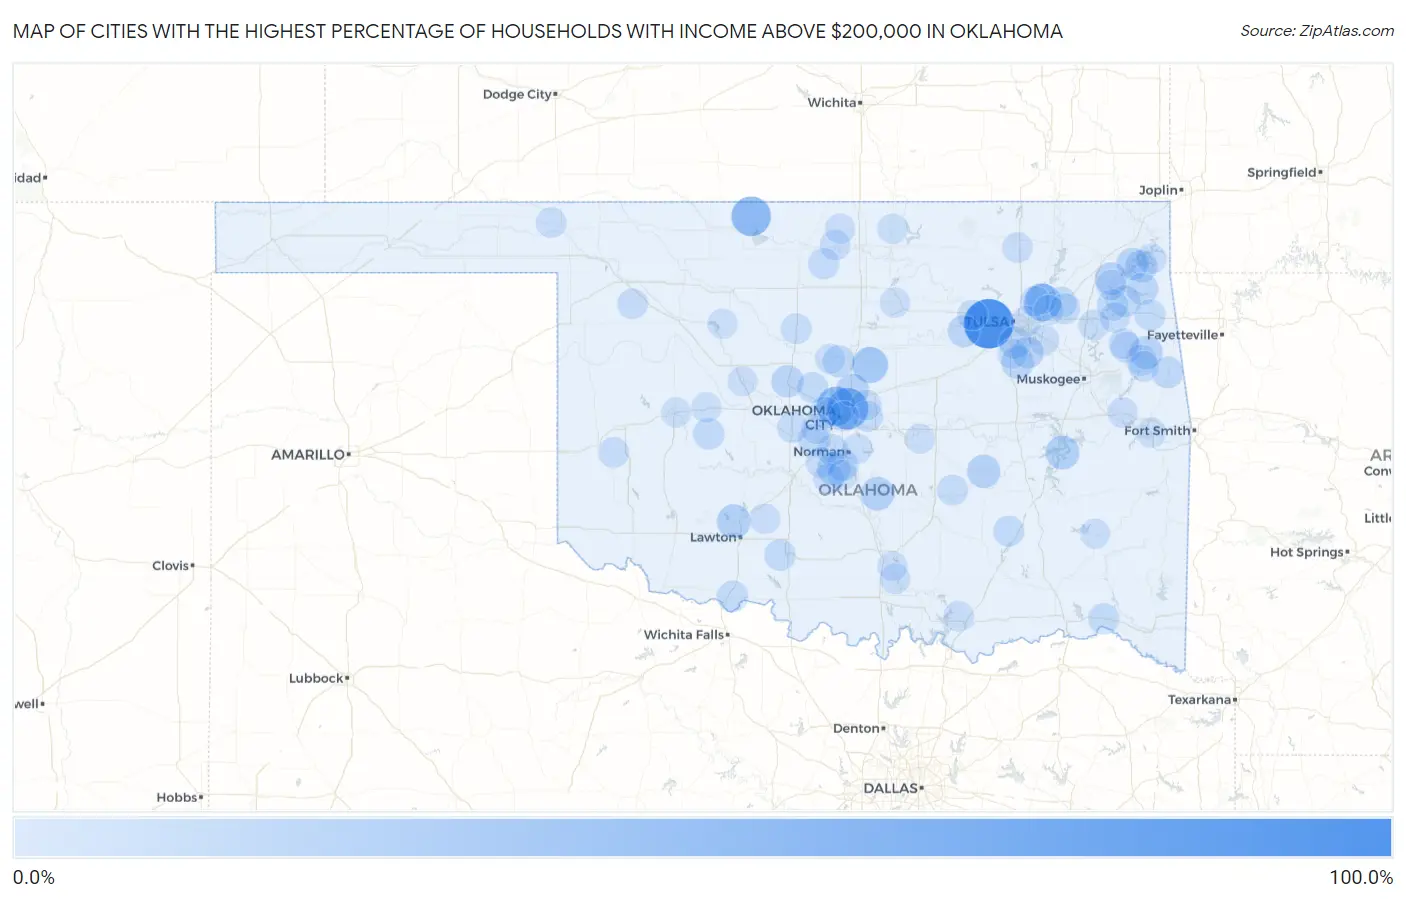
Map of Cities with the Highest Percentage of Households with Income Above $200,000 in Oklahoma
0.0%
100.0%
Cities with the Highest Percentage of Households with Income Above $200,000 in Oklahoma
| City | Households with Income > $200k | vs State | vs National | |
| 1. | Lotsee | 100.0% | 6.3%(+93.7)#1 | 11.4%(+88.6)#23 |
| 2. | Lake Aluma | 60.0% | 6.3%(+53.7)#2 | 11.4%(+48.6)#189 |
| 3. | Byron | 50.0% | 6.3%(+43.7)#3 | 11.4%(+38.6)#456 |
| 4. | Nichols Hills | 49.0% | 6.3%(+42.7)#4 | 11.4%(+37.6)#483 |
| 5. | Valley Park | 40.0% | 6.3%(+33.7)#5 | 11.4%(+28.6)#836 |
| 6. | Meridian | 33.3% | 6.3%(+27.0)#6 | 11.4%(+21.9)#1,317 |
| 7. | Sparrowhawk | 32.4% | 6.3%(+26.1)#7 | 11.4%(+21.0)#1,389 |
| 8. | Scipio | 30.8% | 6.3%(+24.5)#8 | 11.4%(+19.4)#1,538 |
| 9. | Hochatown | 30.4% | 6.3%(+24.1)#9 | 11.4%(+19.0)#1,577 |
| 10. | Bug Tussle | 25.5% | 6.3%(+19.2)#10 | 11.4%(+14.1)#2,120 |
| 11. | Little Rock | 24.5% | 6.3%(+18.2)#11 | 11.4%(+13.1)#2,238 |
| 12. | Carlton Landing | 23.5% | 6.3%(+17.2)#12 | 11.4%(+12.1)#2,401 |
| 13. | Medicine Park | 23.4% | 6.3%(+17.1)#13 | 11.4%(+12.0)#2,418 |
| 14. | Rosedale | 22.2% | 6.3%(+15.9)#14 | 11.4%(+10.8)#2,627 |
| 15. | Pumpkin Hollow | 20.8% | 6.3%(+14.5)#15 | 11.4%(+9.40)#2,893 |
| 16. | Horntown | 20.6% | 6.3%(+14.3)#16 | 11.4%(+9.20)#2,929 |
| 17. | Cole | 19.4% | 6.3%(+13.1)#17 | 11.4%(+8.00)#3,181 |
| 18. | Edmond | 18.9% | 6.3%(+12.6)#18 | 11.4%(+7.50)#3,288 |
| 19. | Eldon | 18.7% | 6.3%(+12.4)#19 | 11.4%(+7.30)#3,357 |
| 20. | Pensacola | 18.2% | 6.3%(+11.9)#20 | 11.4%(+6.80)#3,463 |
| 21. | Liberty | 17.3% | 6.3%(+11.0)#21 | 11.4%(+5.90)#3,666 |
| 22. | Sand Point | 17.1% | 6.3%(+10.8)#22 | 11.4%(+5.70)#3,715 |
| 23. | Okarche | 16.2% | 6.3%(+9.90)#23 | 11.4%(+4.80)#3,928 |
| 24. | Jenks | 15.9% | 6.3%(+9.60)#24 | 11.4%(+4.50)#3,992 |
| 25. | Bixby | 15.7% | 6.3%(+9.40)#25 | 11.4%(+4.30)#4,058 |
| 26. | Dennis | 15.4% | 6.3%(+9.10)#26 | 11.4%(+4.00)#4,171 |
| 27. | Cleora | 15.1% | 6.3%(+8.80)#27 | 11.4%(+3.70)#4,272 |
| 28. | Lawrence Creek | 15.0% | 6.3%(+8.70)#28 | 11.4%(+3.60)#4,307 |
| 29. | Cedar Valley | 14.7% | 6.3%(+8.40)#29 | 11.4%(+3.30)#4,406 |
| 30. | Goldsby | 14.5% | 6.3%(+8.20)#30 | 11.4%(+3.10)#4,460 |
| 31. | Tuttle | 14.0% | 6.3%(+7.70)#31 | 11.4%(+2.60)#4,656 |
| 32. | New Eucha | 13.8% | 6.3%(+7.50)#32 | 11.4%(+2.40)#4,753 |
| 33. | Earl | 13.8% | 6.3%(+7.50)#33 | 11.4%(+2.40)#4,760 |
| 34. | Zion | 13.3% | 6.3%(+7.00)#34 | 11.4%(+1.90)#4,961 |
| 35. | Kenwood | 12.8% | 6.3%(+6.50)#35 | 11.4%(+1.40)#5,174 |
| 36. | Shady Grove Cdp Mcintosh County | 12.7% | 6.3%(+6.40)#36 | 11.4%(+1.30)#5,217 |
| 37. | Cave Spring | 12.5% | 6.3%(+6.20)#37 | 11.4%(+1.10)#5,310 |
| 38. | Woodlawn Park | 12.2% | 6.3%(+5.90)#38 | 11.4%(+0.800)#5,461 |
| 39. | Enterprise | 12.2% | 6.3%(+5.90)#39 | 11.4%(+0.800)#5,462 |
| 40. | Justice | 11.8% | 6.3%(+5.50)#40 | 11.4%(+0.400)#5,633 |
| 41. | Empire City | 11.8% | 6.3%(+5.50)#41 | 11.4%(+0.400)#5,637 |
| 42. | Colony | 11.8% | 6.3%(+5.50)#42 | 11.4%(+0.400)#5,646 |
| 43. | Newcastle | 11.4% | 6.3%(+5.10)#43 | 11.4%(=0.000)#5,797 |
| 44. | Randlett | 11.4% | 6.3%(+5.10)#44 | 11.4%(=0.000)#5,817 |
| 45. | Pump Back | 11.4% | 6.3%(+5.10)#45 | 11.4%(=0.000)#5,825 |
| 46. | Kansas | 11.2% | 6.3%(+4.90)#46 | 11.4%(-0.200)#5,891 |
| 47. | Sunray | 11.2% | 6.3%(+4.90)#47 | 11.4%(-0.200)#5,892 |
| 48. | Swink | 11.1% | 6.3%(+4.80)#48 | 11.4%(-0.300)#5,952 |
| 49. | Limestone | 11.0% | 6.3%(+4.70)#49 | 11.4%(-0.400)#5,988 |
| 50. | Choctaw | 10.7% | 6.3%(+4.40)#50 | 11.4%(-0.700)#6,118 |
| 51. | Piedmont | 10.7% | 6.3%(+4.40)#51 | 11.4%(-0.700)#6,121 |
| 52. | Wardville | 10.6% | 6.3%(+4.30)#52 | 11.4%(-0.800)#6,209 |
| 53. | Hunter | 10.3% | 6.3%(+4.00)#53 | 11.4%(-1.10)#6,373 |
| 54. | Hennessey | 9.7% | 6.3%(+3.40)#54 | 11.4%(-1.70)#6,727 |
| 55. | Grandview | 9.7% | 6.3%(+3.40)#55 | 11.4%(-1.70)#6,737 |
| 56. | Sasakwa | 9.7% | 6.3%(+3.40)#56 | 11.4%(-1.70)#6,752 |
| 57. | Union City | 9.6% | 6.3%(+3.30)#57 | 11.4%(-1.80)#6,787 |
| 58. | Welling | 9.6% | 6.3%(+3.30)#58 | 11.4%(-1.80)#6,797 |
| 59. | Blanchard | 9.2% | 6.3%(+2.90)#59 | 11.4%(-2.20)#7,041 |
| 60. | Tiawah | 9.2% | 6.3%(+2.90)#60 | 11.4%(-2.20)#7,087 |
| 61. | Broken Arrow | 9.0% | 6.3%(+2.70)#61 | 11.4%(-2.40)#7,166 |
| 62. | Dibble | 9.0% | 6.3%(+2.70)#62 | 11.4%(-2.40)#7,202 |
| 63. | Sharon | 8.9% | 6.3%(+2.60)#63 | 11.4%(-2.50)#7,280 |
| 64. | Carter | 8.8% | 6.3%(+2.50)#64 | 11.4%(-2.60)#7,346 |
| 65. | Pin Oak Acres | 8.5% | 6.3%(+2.20)#65 | 11.4%(-2.90)#7,555 |
| 66. | Caney | 8.5% | 6.3%(+2.20)#66 | 11.4%(-2.90)#7,563 |
| 67. | Bartlesville | 8.3% | 6.3%(+2.00)#67 | 11.4%(-3.10)#7,658 |
| 68. | Gate | 8.3% | 6.3%(+2.00)#68 | 11.4%(-3.10)#7,726 |
| 69. | Strang | 8.3% | 6.3%(+2.00)#69 | 11.4%(-3.10)#7,730 |
| 70. | Gene Autry | 8.2% | 6.3%(+1.90)#70 | 11.4%(-3.20)#7,805 |
| 71. | Westport | 8.1% | 6.3%(+1.80)#71 | 11.4%(-3.30)#7,886 |
| 72. | Lamont | 8.1% | 6.3%(+1.80)#72 | 11.4%(-3.30)#7,891 |
| 73. | Jones | 8.0% | 6.3%(+1.70)#73 | 11.4%(-3.40)#7,934 |
| 74. | Silo | 8.0% | 6.3%(+1.70)#74 | 11.4%(-3.40)#7,962 |
| 75. | Grove | 7.8% | 6.3%(+1.50)#75 | 11.4%(-3.60)#8,076 |
| 76. | Snake Creek | 7.8% | 6.3%(+1.50)#76 | 11.4%(-3.60)#8,139 |
| 77. | Oklahoma City | 7.6% | 6.3%(+1.30)#77 | 11.4%(-3.80)#8,227 |
| 78. | Tulsa | 7.6% | 6.3%(+1.30)#78 | 11.4%(-3.80)#8,228 |
| 79. | Owasso | 7.6% | 6.3%(+1.30)#79 | 11.4%(-3.80)#8,236 |
| 80. | Carlisle | 7.6% | 6.3%(+1.30)#80 | 11.4%(-3.80)#8,298 |
| 81. | Mustang | 7.5% | 6.3%(+1.20)#81 | 11.4%(-3.90)#8,323 |
| 82. | Gideon | 7.4% | 6.3%(+1.10)#82 | 11.4%(-4.00)#8,490 |
| 83. | Sterling | 7.2% | 6.3%(+0.900)#83 | 11.4%(-4.20)#8,646 |
| 84. | Deer Creek | 6.9% | 6.3%(+0.600)#84 | 11.4%(-4.50)#8,964 |
| 85. | Kildare | 6.9% | 6.3%(+0.600)#85 | 11.4%(-4.50)#8,966 |
| 86. | Norman | 6.8% | 6.3%(+0.500)#86 | 11.4%(-4.60)#8,970 |
| 87. | Glenpool | 6.8% | 6.3%(+0.500)#87 | 11.4%(-4.60)#8,992 |
| 88. | Verdigris | 6.7% | 6.3%(+0.400)#88 | 11.4%(-4.70)#9,123 |
| 89. | Washington | 6.7% | 6.3%(+0.400)#89 | 11.4%(-4.70)#9,174 |
| 90. | Reagan | 6.7% | 6.3%(+0.400)#90 | 11.4%(-4.70)#9,209 |
| 91. | Morrison | 6.5% | 6.3%(+0.200)#91 | 11.4%(-4.90)#9,395 |
| 92. | Cimarron City | 6.5% | 6.3%(+0.200)#92 | 11.4%(-4.90)#9,418 |
| 93. | Clinton | 6.4% | 6.3%(+0.100)#93 | 11.4%(-5.00)#9,455 |
| 94. | Brent | 6.4% | 6.3%(+0.100)#94 | 11.4%(-5.00)#9,504 |
| 95. | Greenfield | 6.4% | 6.3%(+0.100)#95 | 11.4%(-5.00)#9,523 |
| 96. | Longdale | 6.3% | 6.3%(=0.000)#96 | 11.4%(-5.10)#9,657 |
| 97. | Tuskahoma | 6.3% | 6.3%(=0.000)#97 | 11.4%(-5.10)#9,669 |
| 98. | Dougherty | 6.2% | 6.3%(-0.100)#98 | 11.4%(-5.20)#9,765 |
| 99. | Weatherford | 6.1% | 6.3%(-0.200)#99 | 11.4%(-5.30)#9,802 |
| 100. | Earlsboro | 6.1% | 6.3%(-0.200)#100 | 11.4%(-5.30)#9,881 |
Common Questions
What are the Top 10 Cities with the Highest Percentage of Households with Income Above $200,000 in Oklahoma?
Top 10 Cities with the Highest Percentage of Households with Income Above $200,000 in Oklahoma are:
#1
100.0%
#2
60.0%
#3
50.0%
#4
49.0%
#5
40.0%
#6
33.3%
#7
23.5%
#8
23.4%
#9
22.2%
#10
20.6%
What city has the Highest Percentage of Households with Income Above $200,000 in Oklahoma?
Lotsee has the Highest Percentage of Households with Income Above $200,000 in Oklahoma with 100.0%.
What is the Percentage of Households with Income Above $200,000 in the State of Oklahoma?
Percentage of Households with Income Above $200,000 in Oklahoma is 6.3%.
What is the Percentage of Households with Income Above $200,000 in the United States?
Percentage of Households with Income Above $200,000 in the United States is 11.4%.