Cities with the Highest Percentage of Households with Income Above $200,000 in Washington
RELATED REPORTS & OPTIONS
Household Income | $200k+
Washington
Compare Cities
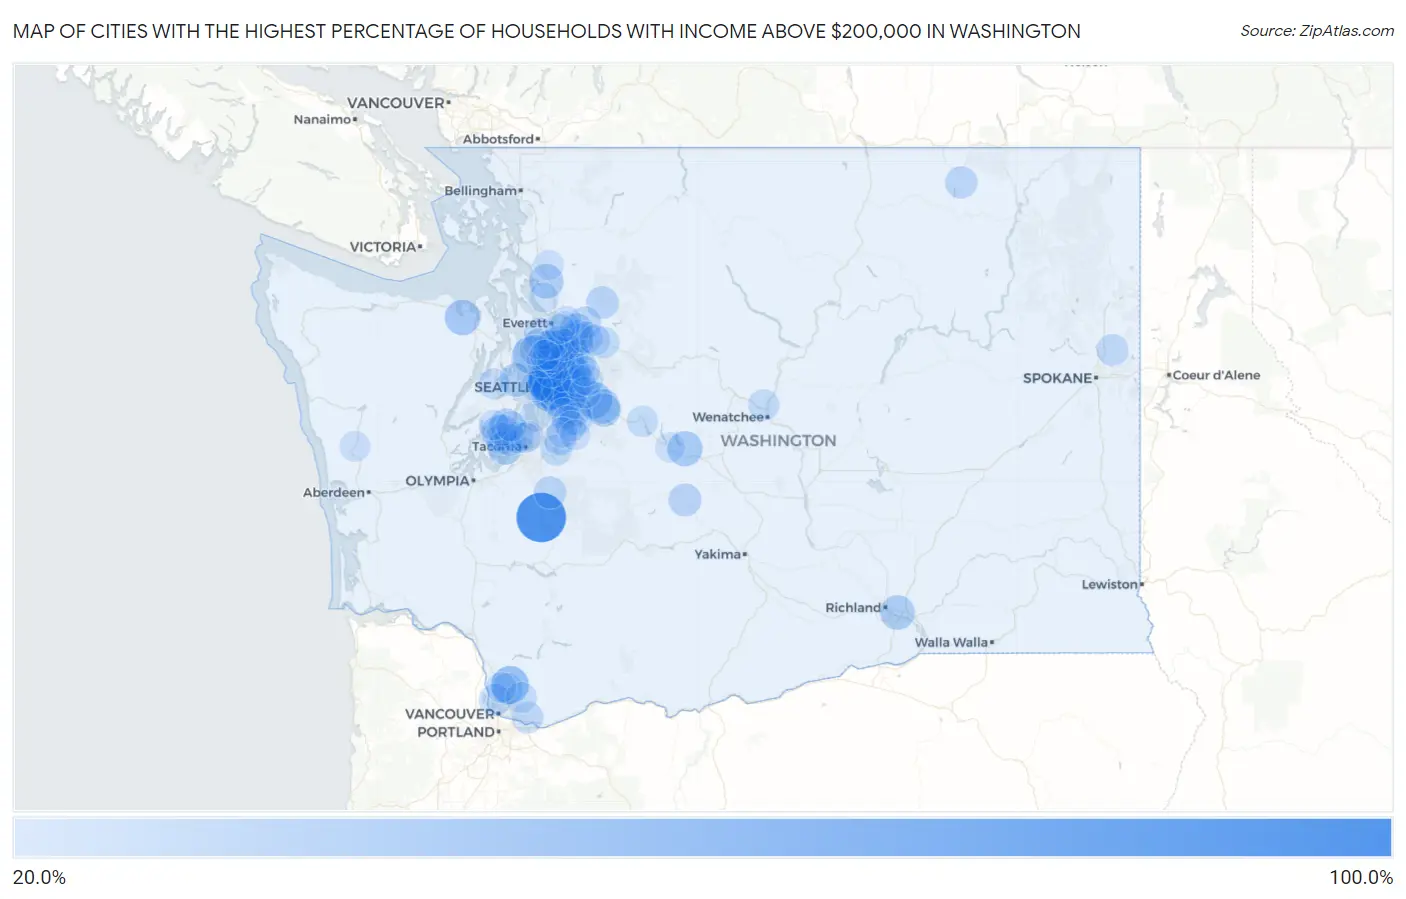
Map of Cities with the Highest Percentage of Households with Income Above $200,000 in Washington
0.0%
100.0%
Cities with the Highest Percentage of Households with Income Above $200,000 in Washington
| City | Households with Income > $200k | vs State | vs National | |
| 1. | La Grande | 100.0% | 15.4%(+84.6)#1 | 11.4%(+88.6)#1 |
| 2. | Clyde Hill | 69.1% | 15.4%(+53.7)#2 | 11.4%(+57.7)#85 |
| 3. | Hunts Point | 64.7% | 15.4%(+49.3)#3 | 11.4%(+53.3)#118 |
| 4. | Yarrow Point | 62.1% | 15.4%(+46.7)#4 | 11.4%(+50.7)#147 |
| 5. | Beaux Arts Village | 58.3% | 15.4%(+42.9)#5 | 11.4%(+46.9)#225 |
| 6. | Medina | 57.9% | 15.4%(+42.5)#6 | 11.4%(+46.5)#229 |
| 7. | Sammamish | 54.0% | 15.4%(+38.6)#7 | 11.4%(+42.6)#331 |
| 8. | Cherry Grove | 52.3% | 15.4%(+36.9)#8 | 11.4%(+40.9)#381 |
| 9. | Woodway | 51.9% | 15.4%(+36.5)#9 | 11.4%(+40.5)#393 |
| 10. | Mercer Island | 48.3% | 15.4%(+32.9)#10 | 11.4%(+36.9)#498 |
| 11. | Snoqualmie | 47.3% | 15.4%(+31.9)#11 | 11.4%(+35.9)#523 |
| 12. | Cottage Lake | 46.4% | 15.4%(+31.0)#12 | 11.4%(+35.0)#564 |
| 13. | Union Hill Novelty Hill | 46.1% | 15.4%(+30.7)#13 | 11.4%(+34.7)#573 |
| 14. | Blyn | 43.3% | 15.4%(+27.9)#14 | 11.4%(+31.9)#681 |
| 15. | Ronald | 41.5% | 15.4%(+26.1)#15 | 11.4%(+30.1)#762 |
| 16. | Raft Island | 40.5% | 15.4%(+25.1)#16 | 11.4%(+29.1)#800 |
| 17. | North Bend | 40.2% | 15.4%(+24.8)#17 | 11.4%(+28.8)#815 |
| 18. | Bothell East | 39.7% | 15.4%(+24.3)#18 | 11.4%(+28.3)#851 |
| 19. | West Pasco | 39.7% | 15.4%(+24.3)#19 | 11.4%(+28.3)#854 |
| 20. | Newcastle | 39.6% | 15.4%(+24.2)#20 | 11.4%(+28.2)#857 |
| 21. | Sunday Lake | 39.2% | 15.4%(+23.8)#21 | 11.4%(+27.8)#892 |
| 22. | Fox Island | 39.0% | 15.4%(+23.6)#22 | 11.4%(+27.6)#901 |
| 23. | Clearview | 38.8% | 15.4%(+23.4)#23 | 11.4%(+27.4)#909 |
| 24. | High Bridge | 38.4% | 15.4%(+23.0)#24 | 11.4%(+27.0)#936 |
| 25. | Mill Creek East | 38.0% | 15.4%(+22.6)#25 | 11.4%(+26.6)#956 |
| 26. | Monroe North | 37.9% | 15.4%(+22.5)#26 | 11.4%(+26.5)#967 |
| 27. | Maltby | 37.2% | 15.4%(+21.8)#27 | 11.4%(+25.8)#1,000 |
| 28. | Duvall | 36.3% | 15.4%(+20.9)#28 | 11.4%(+24.9)#1,059 |
| 29. | Bellevue | 36.2% | 15.4%(+20.8)#29 | 11.4%(+24.8)#1,061 |
| 30. | Redmond | 36.2% | 15.4%(+20.8)#30 | 11.4%(+24.8)#1,062 |
| 31. | Bainbridge Island | 36.2% | 15.4%(+20.8)#31 | 11.4%(+24.8)#1,064 |
| 32. | Riverbend | 35.4% | 15.4%(+20.0)#32 | 11.4%(+24.0)#1,138 |
| 33. | Three Lakes | 35.3% | 15.4%(+19.9)#33 | 11.4%(+23.9)#1,155 |
| 34. | Chain Lake | 34.6% | 15.4%(+19.2)#34 | 11.4%(+23.2)#1,201 |
| 35. | Pataha | 34.4% | 15.4%(+19.0)#35 | 11.4%(+23.0)#1,222 |
| 36. | Canterwood | 34.1% | 15.4%(+18.7)#36 | 11.4%(+22.7)#1,234 |
| 37. | Mirrormont | 33.5% | 15.4%(+18.1)#37 | 11.4%(+22.1)#1,287 |
| 38. | East Renton Highlands | 33.4% | 15.4%(+18.0)#38 | 11.4%(+22.0)#1,295 |
| 39. | Woodinville | 33.3% | 15.4%(+17.9)#39 | 11.4%(+21.9)#1,305 |
| 40. | Cliffdell | 33.3% | 15.4%(+17.9)#40 | 11.4%(+21.9)#1,314 |
| 41. | Kenmore | 33.2% | 15.4%(+17.8)#41 | 11.4%(+21.8)#1,321 |
| 42. | Issaquah | 33.1% | 15.4%(+17.7)#42 | 11.4%(+21.7)#1,326 |
| 43. | Ames Lake | 32.8% | 15.4%(+17.4)#43 | 11.4%(+21.4)#1,358 |
| 44. | Riverpoint | 32.1% | 15.4%(+16.7)#44 | 11.4%(+20.7)#1,420 |
| 45. | Kirkland | 31.9% | 15.4%(+16.5)#45 | 11.4%(+20.5)#1,434 |
| 46. | Lake Holm | 31.9% | 15.4%(+16.5)#46 | 11.4%(+20.5)#1,439 |
| 47. | Verlot | 31.6% | 15.4%(+16.2)#47 | 11.4%(+20.2)#1,472 |
| 48. | Lake Forest Park | 31.4% | 15.4%(+16.0)#48 | 11.4%(+20.0)#1,481 |
| 49. | Hobart | 31.4% | 15.4%(+16.0)#49 | 11.4%(+20.0)#1,482 |
| 50. | Silver Firs | 31.2% | 15.4%(+15.8)#50 | 11.4%(+19.8)#1,500 |
| 51. | Bothell West | 31.0% | 15.4%(+15.6)#51 | 11.4%(+19.6)#1,519 |
| 52. | Kapowsin | 30.9% | 15.4%(+15.5)#52 | 11.4%(+19.5)#1,527 |
| 53. | Malo | 30.8% | 15.4%(+15.4)#53 | 11.4%(+19.4)#1,539 |
| 54. | Felida | 30.7% | 15.4%(+15.3)#54 | 11.4%(+19.3)#1,546 |
| 55. | Lake Roesiger | 30.6% | 15.4%(+15.2)#55 | 11.4%(+19.2)#1,560 |
| 56. | Cathcart | 30.3% | 15.4%(+14.9)#56 | 11.4%(+18.9)#1,584 |
| 57. | Mukilteo | 30.1% | 15.4%(+14.7)#57 | 11.4%(+18.7)#1,604 |
| 58. | Woods Creek | 29.9% | 15.4%(+14.5)#58 | 11.4%(+18.5)#1,630 |
| 59. | Artondale | 29.4% | 15.4%(+14.0)#59 | 11.4%(+18.0)#1,671 |
| 60. | Camas | 29.1% | 15.4%(+13.7)#60 | 11.4%(+17.7)#1,695 |
| 61. | Green Bluff | 29.1% | 15.4%(+13.7)#61 | 11.4%(+17.7)#1,702 |
| 62. | Wollochet | 29.0% | 15.4%(+13.6)#62 | 11.4%(+17.6)#1,708 |
| 63. | Dollars Corner | 29.0% | 15.4%(+13.6)#63 | 11.4%(+17.6)#1,711 |
| 64. | Fall City | 28.7% | 15.4%(+13.3)#64 | 11.4%(+17.3)#1,751 |
| 65. | Maple Heights Lake Desire | 28.2% | 15.4%(+12.8)#65 | 11.4%(+16.8)#1,799 |
| 66. | Ruston | 27.8% | 15.4%(+12.4)#66 | 11.4%(+16.4)#1,846 |
| 67. | Lake Tapps | 27.6% | 15.4%(+12.2)#67 | 11.4%(+16.2)#1,860 |
| 68. | Rosedale | 27.3% | 15.4%(+11.9)#68 | 11.4%(+15.9)#1,892 |
| 69. | Carnation | 27.3% | 15.4%(+11.9)#69 | 11.4%(+15.9)#1,894 |
| 70. | Startup | 27.3% | 15.4%(+11.9)#70 | 11.4%(+15.9)#1,902 |
| 71. | Sunnyslope | 27.1% | 15.4%(+11.7)#71 | 11.4%(+15.7)#1,925 |
| 72. | Seattle | 27.0% | 15.4%(+11.6)#72 | 11.4%(+15.6)#1,932 |
| 73. | Snoqualmie Pass | 26.5% | 15.4%(+11.1)#73 | 11.4%(+15.1)#2,001 |
| 74. | Hockinson | 26.4% | 15.4%(+11.0)#74 | 11.4%(+15.0)#2,006 |
| 75. | Bothell | 26.2% | 15.4%(+10.8)#75 | 11.4%(+14.8)#2,027 |
| 76. | Shadow Lake | 26.1% | 15.4%(+10.7)#76 | 11.4%(+14.7)#2,048 |
| 77. | Chico | 25.8% | 15.4%(+10.4)#77 | 11.4%(+14.4)#2,081 |
| 78. | North Sultan | 25.8% | 15.4%(+10.4)#78 | 11.4%(+14.4)#2,087 |
| 79. | Meadowdale | 25.5% | 15.4%(+10.1)#79 | 11.4%(+14.1)#2,118 |
| 80. | Mill Creek | 25.3% | 15.4%(+9.90)#80 | 11.4%(+13.9)#2,129 |
| 81. | Normandy Park | 25.0% | 15.4%(+9.60)#81 | 11.4%(+13.6)#2,162 |
| 82. | Maple Valley | 24.8% | 15.4%(+9.40)#82 | 11.4%(+13.4)#2,185 |
| 83. | Duluth | 24.3% | 15.4%(+8.90)#83 | 11.4%(+12.9)#2,269 |
| 84. | Cavalero | 24.3% | 15.4%(+8.90)#84 | 11.4%(+12.9)#2,271 |
| 85. | Humptulips | 24.2% | 15.4%(+8.80)#85 | 11.4%(+12.8)#2,287 |
| 86. | Dash Point | 24.1% | 15.4%(+8.70)#86 | 11.4%(+12.7)#2,296 |
| 87. | Lake Morton Berrydale | 24.0% | 15.4%(+8.60)#87 | 11.4%(+12.6)#2,303 |
| 88. | Martha Lake | 23.8% | 15.4%(+8.40)#88 | 11.4%(+12.4)#2,344 |
| 89. | Black Diamond | 23.8% | 15.4%(+8.40)#89 | 11.4%(+12.4)#2,348 |
| 90. | Browns Point | 23.8% | 15.4%(+8.40)#90 | 11.4%(+12.4)#2,357 |
| 91. | Stansberry Lake | 23.6% | 15.4%(+8.20)#91 | 11.4%(+12.2)#2,383 |
| 92. | Bunk Foss | 23.5% | 15.4%(+8.10)#92 | 11.4%(+12.1)#2,393 |
| 93. | Maplewood | 23.4% | 15.4%(+8.00)#93 | 11.4%(+12.0)#2,413 |
| 94. | Edmonds | 23.3% | 15.4%(+7.90)#94 | 11.4%(+11.9)#2,421 |
| 95. | Brier | 23.2% | 15.4%(+7.80)#95 | 11.4%(+11.8)#2,445 |
| 96. | Lake Marcel Stillwater | 22.5% | 15.4%(+7.10)#96 | 11.4%(+11.1)#2,569 |
| 97. | Lake Goodwin | 22.4% | 15.4%(+7.00)#97 | 11.4%(+11.0)#2,582 |
| 98. | Fobes Hill | 22.4% | 15.4%(+7.00)#98 | 11.4%(+11.0)#2,587 |
| 99. | Lake Mcmurray | 22.4% | 15.4%(+7.00)#99 | 11.4%(+11.0)#2,590 |
| 100. | Easton | 22.4% | 15.4%(+7.00)#100 | 11.4%(+11.0)#2,591 |
Common Questions
What are the Top 10 Cities with the Highest Percentage of Households with Income Above $200,000 in Washington?
Top 10 Cities with the Highest Percentage of Households with Income Above $200,000 in Washington are:
#1
100.0%
#2
69.1%
#3
64.7%
#4
62.1%
#5
58.3%
#6
57.9%
#7
54.0%
#8
52.3%
#9
51.9%
#10
48.3%
What city has the Highest Percentage of Households with Income Above $200,000 in Washington?
La Grande has the Highest Percentage of Households with Income Above $200,000 in Washington with 100.0%.
What is the Percentage of Households with Income Above $200,000 in the State of Washington?
Percentage of Households with Income Above $200,000 in Washington is 15.4%.
What is the Percentage of Households with Income Above $200,000 in the United States?
Percentage of Households with Income Above $200,000 in the United States is 11.4%.