Zip Codes with the Highest Percentage of Households with Income Above $200,000 in San Diego, CA
RELATED REPORTS & OPTIONS
Household Income | $200k+
San Diego
Compare Zip Codes
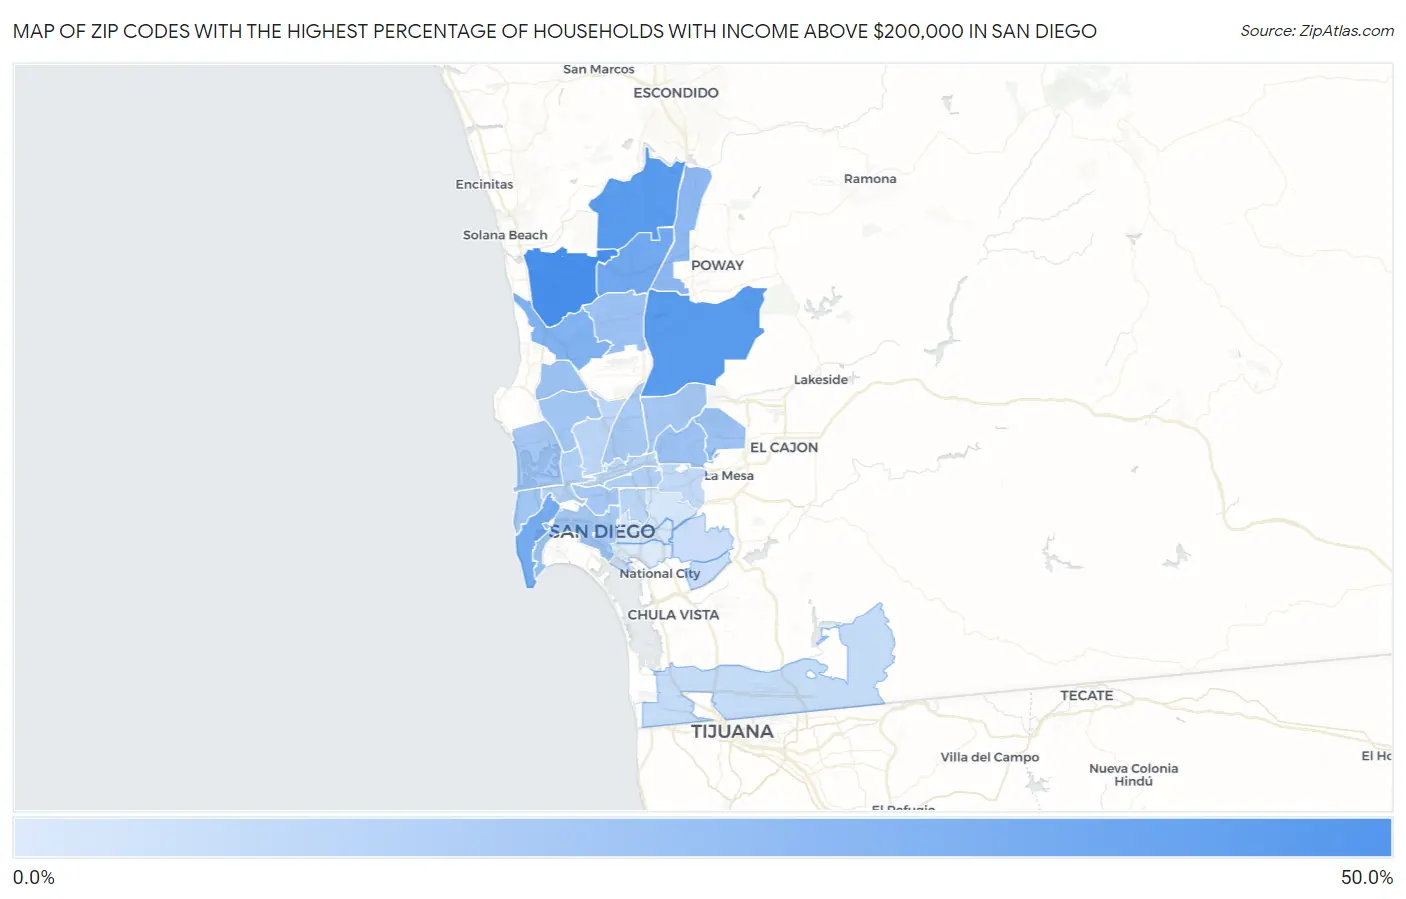
Map of Zip Codes with the Highest Percentage of Households with Income Above $200,000 in San Diego
3.2%
47.4%
Zip Codes with the Highest Percentage of Households with Income Above $200,000 in San Diego, CA
| Zip Code | Households with Income > $200k | vs State | vs National | |
| 1. | 92130 | 47.4% | 17.9%(+29.5)#69 | 11.4%(+36.0)#342 |
| 2. | 92131 | 42.0% | 17.9%(+24.1)#115 | 11.4%(+30.6)#550 |
| 3. | 92127 | 41.7% | 17.9%(+23.8)#116 | 11.4%(+30.3)#561 |
| 4. | 92129 | 33.3% | 17.9%(+15.4)#194 | 11.4%(+21.9)#1,124 |
| 5. | 92106 | 32.2% | 17.9%(+14.3)#212 | 11.4%(+20.8)#1,233 |
| 6. | 92121 | 28.3% | 17.9%(+10.4)#293 | 11.4%(+16.9)#1,684 |
| 7. | 92128 | 25.1% | 17.9%(+7.20)#365 | 11.4%(+13.7)#2,166 |
| 8. | 92119 | 21.3% | 17.9%(+3.40)#470 | 11.4%(+9.90)#2,936 |
| 9. | 92120 | 21.2% | 17.9%(+3.30)#476 | 11.4%(+9.80)#2,960 |
| 10. | 92126 | 20.8% | 17.9%(+2.90)#492 | 11.4%(+9.40)#3,074 |
| 11. | 92122 | 20.5% | 17.9%(+2.60)#505 | 11.4%(+9.10)#3,150 |
| 12. | 92117 | 18.6% | 17.9%(+0.700)#570 | 11.4%(+7.20)#3,667 |
| 13. | 92107 | 18.3% | 17.9%(+0.400)#581 | 11.4%(+6.90)#3,747 |
| 14. | 92109 | 18.0% | 17.9%(+0.100)#593 | 11.4%(+6.60)#3,840 |
| 15. | 92124 | 17.9% | 17.9%(=0.000)#601 | 11.4%(+6.50)#3,875 |
| 16. | 92103 | 17.5% | 17.9%(-0.400)#614 | 11.4%(+6.10)#4,005 |
| 17. | 92123 | 17.3% | 17.9%(-0.600)#621 | 11.4%(+5.90)#4,066 |
| 18. | 92101 | 17.2% | 17.9%(-0.700)#623 | 11.4%(+5.80)#4,094 |
| 19. | 92116 | 14.5% | 17.9%(-3.40)#737 | 11.4%(+3.10)#5,214 |
| 20. | 92110 | 13.9% | 17.9%(-4.00)#759 | 11.4%(+2.50)#5,517 |
| 21. | 92108 | 11.7% | 17.9%(-6.20)#859 | 11.4%(+0.300)#6,864 |
| 22. | 92111 | 11.5% | 17.9%(-6.40)#869 | 11.4%(+0.100)#7,008 |
| 23. | 92104 | 11.3% | 17.9%(-6.60)#880 | 11.4%(-0.100)#7,142 |
| 24. | 92115 | 10.2% | 17.9%(-7.70)#942 | 11.4%(-1.20)#8,037 |
| 25. | 92154 | 9.0% | 17.9%(-8.90)#1,018 | 11.4%(-2.40)#9,207 |
| 26. | 92139 | 8.6% | 17.9%(-9.30)#1,041 | 11.4%(-2.80)#9,636 |
| 27. | 92114 | 7.7% | 17.9%(-10.2)#1,110 | 11.4%(-3.70)#10,736 |
| 28. | 92102 | 5.2% | 17.9%(-12.7)#1,300 | 11.4%(-6.20)#15,076 |
| 29. | 92105 | 5.0% | 17.9%(-12.9)#1,316 | 11.4%(-6.40)#15,557 |
| 30. | 92113 | 3.2% | 17.9%(-14.7)#1,433 | 11.4%(-8.20)#20,274 |
1
Common Questions
What are the Top 10 Zip Codes with the Highest Percentage of Households with Income Above $200,000 in San Diego, CA?
Top 10 Zip Codes with the Highest Percentage of Households with Income Above $200,000 in San Diego, CA are:
What zip code has the Highest Percentage of Households with Income Above $200,000 in San Diego, CA?
92130 has the Highest Percentage of Households with Income Above $200,000 in San Diego, CA with 47.4%.
What is the Percentage of Households with Income Above $200,000 in San Diego, CA?
Percentage of Households with Income Above $200,000 in San Diego is 18.6%.
What is the Percentage of Households with Income Above $200,000 in California?
Percentage of Households with Income Above $200,000 in California is 17.9%.
What is the Percentage of Households with Income Above $200,000 in the United States?
Percentage of Households with Income Above $200,000 in the United States is 11.4%.