Cities with the Highest Percentage of Households with Income Above $200,000 in Ohio
RELATED REPORTS & OPTIONS
Household Income | $200k+
Ohio
Compare Cities
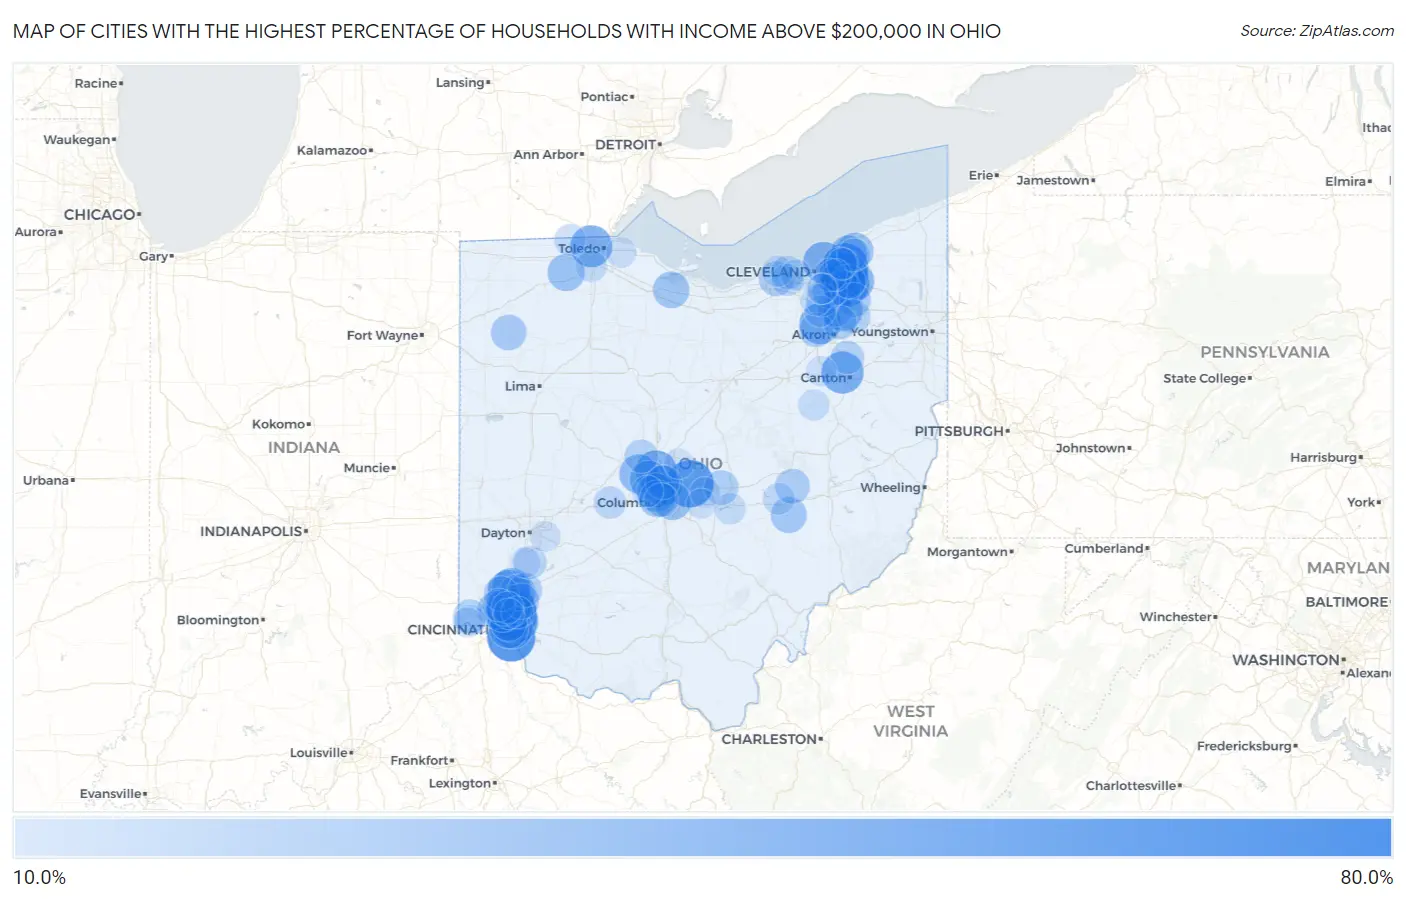
Map of Cities with the Highest Percentage of Households with Income Above $200,000 in Ohio
0.0%
80.0%
Cities with the Highest Percentage of Households with Income Above $200,000 in Ohio
| City | Households with Income > $200k | vs State | vs National | |
| 1. | Concorde Hills | 61.2% | 7.6%(+53.6)#1 | 11.4%(+49.8)#160 |
| 2. | Coldstream | 57.8% | 7.6%(+50.2)#2 | 11.4%(+46.4)#231 |
| 3. | New Albany | 56.4% | 7.6%(+48.8)#3 | 11.4%(+45.0)#260 |
| 4. | The Village Of Indian Hill | 54.5% | 7.6%(+46.9)#4 | 11.4%(+43.1)#312 |
| 5. | Gates Mills | 53.3% | 7.6%(+45.7)#5 | 11.4%(+41.9)#351 |
| 6. | Bentleyville | 53.1% | 7.6%(+45.5)#6 | 11.4%(+41.7)#360 |
| 7. | Pepper Pike | 49.8% | 7.6%(+42.2)#7 | 11.4%(+38.4)#459 |
| 8. | Moreland Hills | 49.5% | 7.6%(+41.9)#8 | 11.4%(+38.1)#469 |
| 9. | Hunting Valley | 48.5% | 7.6%(+40.9)#9 | 11.4%(+37.1)#494 |
| 10. | Terrace Park | 47.7% | 7.6%(+40.1)#10 | 11.4%(+36.3)#514 |
| 11. | Remington | 45.1% | 7.6%(+37.5)#11 | 11.4%(+33.7)#607 |
| 12. | Hills And Dales | 44.3% | 7.6%(+36.7)#12 | 11.4%(+32.9)#642 |
| 13. | Wetherington | 44.2% | 7.6%(+36.6)#13 | 11.4%(+32.8)#644 |
| 14. | Ottawa Hills | 43.6% | 7.6%(+36.0)#14 | 11.4%(+32.2)#676 |
| 15. | Powell | 43.1% | 7.6%(+35.5)#15 | 11.4%(+31.7)#687 |
| 16. | Bratenahl | 42.4% | 7.6%(+34.8)#16 | 11.4%(+31.0)#718 |
| 17. | Montrose Ghent | 41.6% | 7.6%(+34.0)#17 | 11.4%(+30.2)#754 |
| 18. | Madeira | 39.6% | 7.6%(+32.0)#18 | 11.4%(+28.2)#859 |
| 19. | Riverlea | 39.6% | 7.6%(+32.0)#19 | 11.4%(+28.2)#862 |
| 20. | Jacksontown | 38.8% | 7.6%(+31.2)#20 | 11.4%(+27.4)#912 |
| 21. | Hudson | 38.7% | 7.6%(+31.1)#21 | 11.4%(+27.3)#913 |
| 22. | Dry Run | 38.6% | 7.6%(+31.0)#22 | 11.4%(+27.2)#921 |
| 23. | Plainville | 37.9% | 7.6%(+30.3)#23 | 11.4%(+26.5)#971 |
| 24. | Turpin Hills | 37.2% | 7.6%(+29.6)#24 | 11.4%(+25.8)#1,002 |
| 25. | Four Bridges | 37.0% | 7.6%(+29.4)#25 | 11.4%(+25.6)#1,018 |
| 26. | New California | 36.9% | 7.6%(+29.3)#26 | 11.4%(+25.5)#1,030 |
| 27. | Dublin | 36.2% | 7.6%(+28.6)#27 | 11.4%(+24.8)#1,063 |
| 28. | South Russell | 36.1% | 7.6%(+28.5)#28 | 11.4%(+24.7)#1,074 |
| 29. | Upper Arlington | 35.8% | 7.6%(+28.2)#29 | 11.4%(+24.4)#1,092 |
| 30. | Sixteen Mile Stand | 35.3% | 7.6%(+27.7)#30 | 11.4%(+23.9)#1,154 |
| 31. | Montgomery | 33.9% | 7.6%(+26.3)#31 | 11.4%(+22.5)#1,254 |
| 32. | Bexley | 33.6% | 7.6%(+26.0)#32 | 11.4%(+22.2)#1,275 |
| 33. | Wyoming | 33.1% | 7.6%(+25.5)#33 | 11.4%(+21.7)#1,328 |
| 34. | Orange | 33.1% | 7.6%(+25.5)#34 | 11.4%(+21.7)#1,330 |
| 35. | Neapolis | 33.1% | 7.6%(+25.5)#35 | 11.4%(+21.7)#1,334 |
| 36. | Kirtland Hills | 32.6% | 7.6%(+25.0)#36 | 11.4%(+21.2)#1,373 |
| 37. | Waite Hill | 32.5% | 7.6%(+24.9)#37 | 11.4%(+21.1)#1,379 |
| 38. | Marble Cliff | 32.0% | 7.6%(+24.4)#38 | 11.4%(+20.6)#1,431 |
| 39. | Mariemont | 31.4% | 7.6%(+23.8)#39 | 11.4%(+20.0)#1,484 |
| 40. | Amberley | 31.2% | 7.6%(+23.6)#40 | 11.4%(+19.8)#1,502 |
| 41. | Vickery | 31.0% | 7.6%(+23.4)#41 | 11.4%(+19.6)#1,520 |
| 42. | Evendale | 30.8% | 7.6%(+23.2)#42 | 11.4%(+19.4)#1,535 |
| 43. | Solon | 30.7% | 7.6%(+23.1)#43 | 11.4%(+19.3)#1,541 |
| 44. | Mason | 30.2% | 7.6%(+22.6)#44 | 11.4%(+18.8)#1,591 |
| 45. | Duncan Falls | 30.1% | 7.6%(+22.5)#45 | 11.4%(+18.7)#1,610 |
| 46. | Boston Heights | 29.2% | 7.6%(+21.6)#46 | 11.4%(+17.8)#1,688 |
| 47. | Oakwood | 29.1% | 7.6%(+21.5)#47 | 11.4%(+17.7)#1,697 |
| 48. | Loveland Park | 28.8% | 7.6%(+21.2)#48 | 11.4%(+17.4)#1,737 |
| 49. | Adamsville | 27.6% | 7.6%(+20.0)#49 | 11.4%(+16.2)#1,865 |
| 50. | Avon | 27.4% | 7.6%(+19.8)#50 | 11.4%(+16.0)#1,876 |
| 51. | Beckett Ridge | 27.4% | 7.6%(+19.8)#51 | 11.4%(+16.0)#1,879 |
| 52. | Granville | 26.7% | 7.6%(+19.1)#52 | 11.4%(+15.3)#1,967 |
| 53. | Aurora | 26.6% | 7.6%(+19.0)#53 | 11.4%(+15.2)#1,978 |
| 54. | Pigeon Creek | 26.2% | 7.6%(+18.6)#54 | 11.4%(+14.8)#2,038 |
| 55. | Walton Hills | 26.1% | 7.6%(+18.5)#55 | 11.4%(+14.7)#2,047 |
| 56. | South Lebanon | 26.0% | 7.6%(+18.4)#56 | 11.4%(+14.6)#2,054 |
| 57. | Worthington | 25.2% | 7.6%(+17.6)#57 | 11.4%(+13.8)#2,145 |
| 58. | Chagrin Falls | 25.2% | 7.6%(+17.6)#58 | 11.4%(+13.8)#2,147 |
| 59. | Grandview Heights | 25.1% | 7.6%(+17.5)#59 | 11.4%(+13.7)#2,150 |
| 60. | Grandview | 25.1% | 7.6%(+17.5)#60 | 11.4%(+13.7)#2,152 |
| 61. | Sugar Bush Knolls | 24.8% | 7.6%(+17.2)#61 | 11.4%(+13.4)#2,193 |
| 62. | Silver Lake | 24.7% | 7.6%(+17.1)#62 | 11.4%(+13.3)#2,203 |
| 63. | Highland Heights | 24.4% | 7.6%(+16.8)#63 | 11.4%(+13.0)#2,241 |
| 64. | Ostrander | 24.2% | 7.6%(+16.6)#64 | 11.4%(+12.8)#2,284 |
| 65. | Greentown | 24.1% | 7.6%(+16.5)#65 | 11.4%(+12.7)#2,292 |
| 66. | Bay Village | 24.0% | 7.6%(+16.4)#66 | 11.4%(+12.6)#2,301 |
| 67. | Five Points | 23.9% | 7.6%(+16.3)#67 | 11.4%(+12.5)#2,334 |
| 68. | Brecksville | 23.6% | 7.6%(+16.0)#68 | 11.4%(+12.2)#2,371 |
| 69. | Kirtland | 23.0% | 7.6%(+15.4)#69 | 11.4%(+11.6)#2,481 |
| 70. | Shaker Heights | 22.9% | 7.6%(+15.3)#70 | 11.4%(+11.5)#2,488 |
| 71. | Glendale | 22.6% | 7.6%(+15.0)#71 | 11.4%(+11.2)#2,547 |
| 72. | Choctaw Lake | 22.0% | 7.6%(+14.4)#72 | 11.4%(+10.6)#2,663 |
| 73. | Beachwood | 21.4% | 7.6%(+13.8)#73 | 11.4%(+10.00)#2,766 |
| 74. | Miamiville | 21.4% | 7.6%(+13.8)#74 | 11.4%(+10.00)#2,777 |
| 75. | Westlake | 21.3% | 7.6%(+13.7)#75 | 11.4%(+9.90)#2,784 |
| 76. | New Haven Cdp Hamilton County | 21.3% | 7.6%(+13.7)#76 | 11.4%(+9.90)#2,812 |
| 77. | North Zanesville | 20.7% | 7.6%(+13.1)#77 | 11.4%(+9.30)#2,903 |
| 78. | Berkey | 20.4% | 7.6%(+12.8)#78 | 11.4%(+9.00)#2,963 |
| 79. | Blue Ash | 20.3% | 7.6%(+12.7)#79 | 11.4%(+8.90)#2,973 |
| 80. | Hilliard | 19.9% | 7.6%(+12.3)#80 | 11.4%(+8.50)#3,070 |
| 81. | Perrysburg | 19.8% | 7.6%(+12.2)#81 | 11.4%(+8.40)#3,095 |
| 82. | Broadview Heights | 19.8% | 7.6%(+12.2)#82 | 11.4%(+8.40)#3,096 |
| 83. | Richfield | 19.7% | 7.6%(+12.1)#83 | 11.4%(+8.30)#3,119 |
| 84. | Thornport | 19.7% | 7.6%(+12.1)#84 | 11.4%(+8.30)#3,124 |
| 85. | Mayfield | 19.5% | 7.6%(+11.9)#85 | 11.4%(+8.10)#3,160 |
| 86. | Avon Lake | 19.4% | 7.6%(+11.8)#86 | 11.4%(+8.00)#3,172 |
| 87. | Rocky River | 19.4% | 7.6%(+11.8)#87 | 11.4%(+8.00)#3,173 |
| 88. | Winesburg | 19.3% | 7.6%(+11.7)#88 | 11.4%(+7.90)#3,203 |
| 89. | Beechwood Trails | 18.2% | 7.6%(+10.6)#89 | 11.4%(+6.80)#3,454 |
| 90. | Miami Heights | 18.1% | 7.6%(+10.5)#90 | 11.4%(+6.70)#3,476 |
| 91. | Springboro | 17.9% | 7.6%(+10.3)#91 | 11.4%(+6.50)#3,509 |
| 92. | Independence | 17.9% | 7.6%(+10.3)#92 | 11.4%(+6.50)#3,518 |
| 93. | Beavercreek | 17.8% | 7.6%(+10.2)#93 | 11.4%(+6.40)#3,542 |
| 94. | Kenwood | 17.8% | 7.6%(+10.2)#94 | 11.4%(+6.40)#3,546 |
| 95. | North Lawrence | 17.6% | 7.6%(+10.0)#95 | 11.4%(+6.20)#3,605 |
| 96. | Curtice | 17.5% | 7.6%(+9.90)#96 | 11.4%(+6.10)#3,621 |
| 97. | Valley View | 17.4% | 7.6%(+9.80)#97 | 11.4%(+6.00)#3,638 |
| 98. | Galena | 17.1% | 7.6%(+9.50)#98 | 11.4%(+5.70)#3,708 |
| 99. | Etna | 17.1% | 7.6%(+9.50)#99 | 11.4%(+5.70)#3,710 |
| 100. | North Bend | 17.0% | 7.6%(+9.40)#100 | 11.4%(+5.60)#3,734 |
Common Questions
What are the Top 10 Cities with the Highest Percentage of Households with Income Above $200,000 in Ohio?
Top 10 Cities with the Highest Percentage of Households with Income Above $200,000 in Ohio are:
#1
61.2%
#2
57.8%
#3
56.4%
#4
54.5%
#5
53.3%
#6
53.1%
#7
49.8%
#8
49.5%
#9
48.5%
#10
47.7%
What city has the Highest Percentage of Households with Income Above $200,000 in Ohio?
Concorde Hills has the Highest Percentage of Households with Income Above $200,000 in Ohio with 61.2%.
What is the Percentage of Households with Income Above $200,000 in the State of Ohio?
Percentage of Households with Income Above $200,000 in Ohio is 7.6%.
What is the Percentage of Households with Income Above $200,000 in the United States?
Percentage of Households with Income Above $200,000 in the United States is 11.4%.