Cities with the Highest Percentage of Households with Income Above $200,000 in Indiana
RELATED REPORTS & OPTIONS
Household Income | $200k+
Indiana
Compare Cities
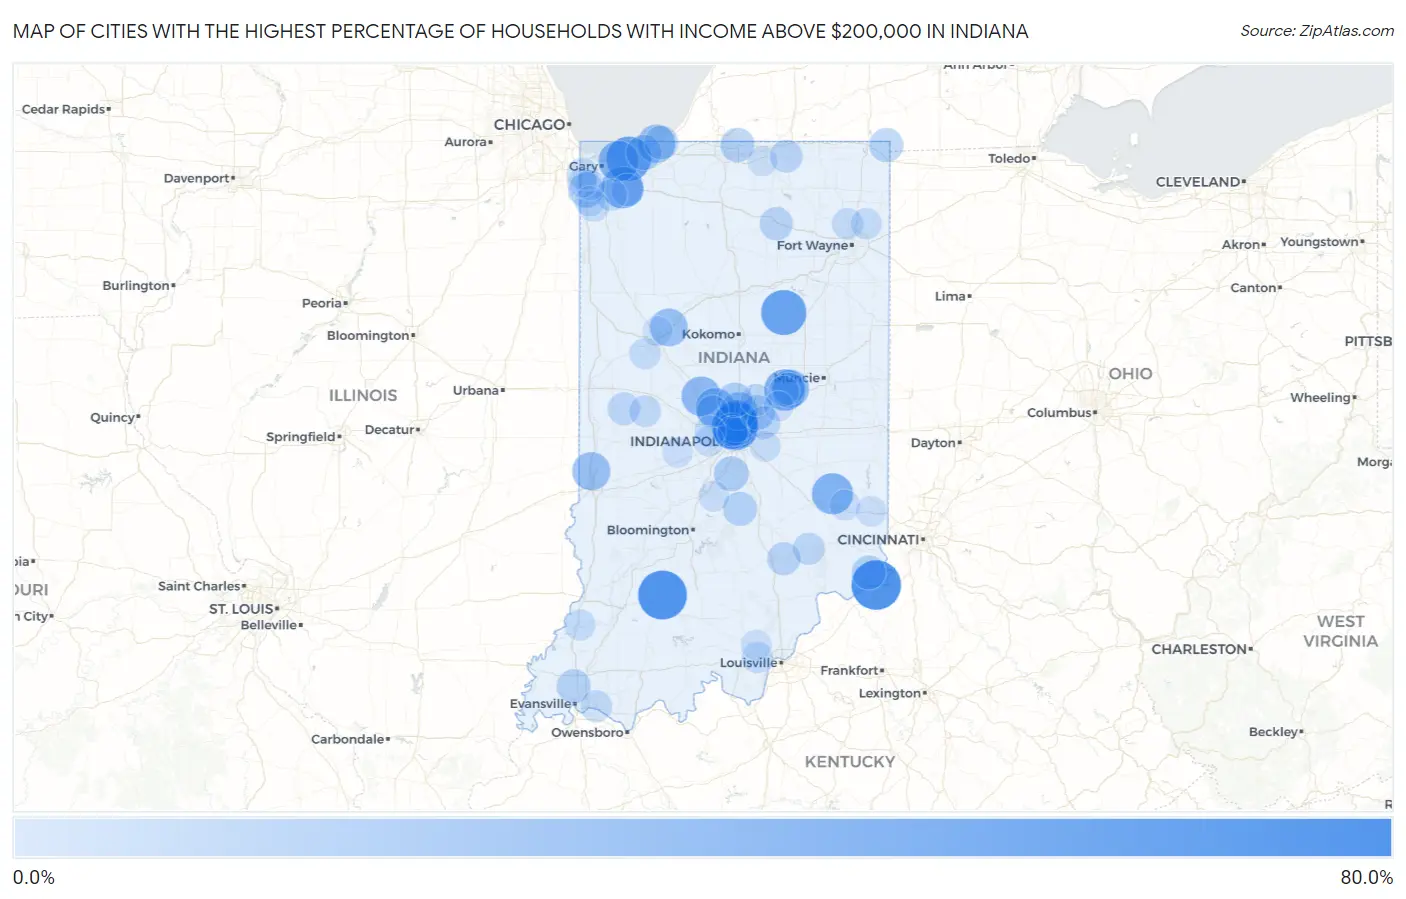
Map of Cities with the Highest Percentage of Households with Income Above $200,000 in Indiana
0.0%
80.0%
Cities with the Highest Percentage of Households with Income Above $200,000 in Indiana
| City | Households with Income > $200k | vs State | vs National | |
| 1. | Florence | 66.7% | 6.7%(+60.0)#1 | 11.4%(+55.3)#100 |
| 2. | Dover Hill | 64.7% | 6.7%(+58.0)#2 | 11.4%(+53.3)#119 |
| 3. | Crows Nest | 56.0% | 6.7%(+49.3)#3 | 11.4%(+44.6)#274 |
| 4. | North Crows Nest | 55.2% | 6.7%(+48.5)#4 | 11.4%(+43.8)#286 |
| 5. | Jalapa | 53.8% | 6.7%(+47.1)#5 | 11.4%(+42.4)#338 |
| 6. | Dune Acres | 51.7% | 6.7%(+45.0)#6 | 11.4%(+40.3)#399 |
| 7. | Schaefer Lake | 50.0% | 6.7%(+43.3)#7 | 11.4%(+38.6)#448 |
| 8. | Meridian Hills | 49.4% | 6.7%(+42.7)#8 | 11.4%(+38.0)#471 |
| 9. | Rockford | 46.1% | 6.7%(+39.4)#9 | 11.4%(+34.7)#576 |
| 10. | Grandview Lake | 45.5% | 6.7%(+38.8)#10 | 11.4%(+34.1)#594 |
| 11. | Williams Creek | 44.2% | 6.7%(+37.5)#11 | 11.4%(+32.8)#648 |
| 12. | Solsberry | 43.8% | 6.7%(+37.1)#12 | 11.4%(+32.4)#666 |
| 13. | Shorewood Forest | 43.2% | 6.7%(+36.5)#13 | 11.4%(+31.8)#685 |
| 14. | River Forest | 42.9% | 6.7%(+36.2)#14 | 11.4%(+31.5)#702 |
| 15. | Lake Santee | 41.8% | 6.7%(+35.1)#15 | 11.4%(+30.4)#745 |
| 16. | Ogden Dunes | 40.0% | 6.7%(+33.3)#16 | 11.4%(+28.6)#831 |
| 17. | Harrison Lake | 39.8% | 6.7%(+33.1)#17 | 11.4%(+28.4)#850 |
| 18. | Pleasant Mills | 38.3% | 6.7%(+31.6)#18 | 11.4%(+26.9)#943 |
| 19. | Ulen | 37.0% | 6.7%(+30.3)#19 | 11.4%(+25.6)#1,023 |
| 20. | Zionsville | 35.8% | 6.7%(+29.1)#20 | 11.4%(+24.4)#1,093 |
| 21. | Country Club Heights | 33.3% | 6.7%(+26.6)#21 | 11.4%(+21.9)#1,312 |
| 22. | Tecumseh | 33.0% | 6.7%(+26.3)#22 | 11.4%(+21.6)#1,342 |
| 23. | Long Beach | 32.8% | 6.7%(+26.1)#23 | 11.4%(+21.4)#1,357 |
| 24. | Americus | 32.1% | 6.7%(+25.4)#24 | 11.4%(+20.7)#1,421 |
| 25. | Carmel | 31.4% | 6.7%(+24.7)#25 | 11.4%(+20.0)#1,479 |
| 26. | Snow Lake | 29.3% | 6.7%(+22.6)#26 | 11.4%(+17.9)#1,682 |
| 27. | Cory | 27.8% | 6.7%(+21.1)#27 | 11.4%(+16.4)#1,848 |
| 28. | New Lisbon | 27.6% | 6.7%(+20.9)#28 | 11.4%(+16.2)#1,867 |
| 29. | Bowling Green | 27.2% | 6.7%(+20.5)#29 | 11.4%(+15.8)#1,919 |
| 30. | Wynnedale | 26.4% | 6.7%(+19.7)#30 | 11.4%(+15.0)#2,010 |
| 31. | St John | 25.1% | 6.7%(+18.4)#31 | 11.4%(+13.7)#2,148 |
| 32. | Cass | 25.0% | 6.7%(+18.3)#32 | 11.4%(+13.6)#2,173 |
| 33. | Beverly Shores | 24.5% | 6.7%(+17.8)#33 | 11.4%(+13.1)#2,234 |
| 34. | Duneland Beach | 24.0% | 6.7%(+17.3)#34 | 11.4%(+12.6)#2,321 |
| 35. | Bargersville | 23.6% | 6.7%(+16.9)#35 | 11.4%(+12.2)#2,374 |
| 36. | Fishers | 23.4% | 6.7%(+16.7)#36 | 11.4%(+12.0)#2,403 |
| 37. | Westfield | 23.2% | 6.7%(+16.5)#37 | 11.4%(+11.8)#2,436 |
| 38. | Jimmerson Lake | 21.9% | 6.7%(+15.2)#38 | 11.4%(+10.5)#2,686 |
| 39. | Granger | 21.2% | 6.7%(+14.5)#39 | 11.4%(+9.80)#2,814 |
| 40. | East Enterprise | 21.1% | 6.7%(+14.4)#40 | 11.4%(+9.70)#2,841 |
| 41. | Cordry Sweetwater Lakes | 20.9% | 6.7%(+14.2)#41 | 11.4%(+9.50)#2,872 |
| 42. | Darmstadt | 20.7% | 6.7%(+14.0)#42 | 11.4%(+9.30)#2,906 |
| 43. | Clear Lake | 20.7% | 6.7%(+14.0)#43 | 11.4%(+9.30)#2,908 |
| 44. | Saugany Lake | 20.7% | 6.7%(+14.0)#44 | 11.4%(+9.30)#2,911 |
| 45. | Floyds Knobs | 20.5% | 6.7%(+13.8)#45 | 11.4%(+9.10)#2,938 |
| 46. | Coesse | 20.4% | 6.7%(+13.7)#46 | 11.4%(+9.00)#2,965 |
| 47. | Michiana Shores | 20.2% | 6.7%(+13.5)#47 | 11.4%(+8.80)#3,008 |
| 48. | Hessen Cassel | 20.0% | 6.7%(+13.3)#48 | 11.4%(+8.60)#3,052 |
| 49. | Marshfield | 20.0% | 6.7%(+13.3)#49 | 11.4%(+8.60)#3,061 |
| 50. | Browns Crossing | 19.9% | 6.7%(+13.2)#50 | 11.4%(+8.50)#3,083 |
| 51. | Winona Lake | 18.6% | 6.7%(+11.9)#51 | 11.4%(+7.20)#3,367 |
| 52. | Hayden | 18.5% | 6.7%(+11.8)#52 | 11.4%(+7.10)#3,397 |
| 53. | Mccordsville | 17.7% | 6.7%(+11.0)#53 | 11.4%(+6.30)#3,571 |
| 54. | Aberdeen | 17.3% | 6.7%(+10.6)#54 | 11.4%(+5.90)#3,662 |
| 55. | Middlebury | 17.2% | 6.7%(+10.5)#55 | 11.4%(+5.80)#3,682 |
| 56. | Carrollton | 16.8% | 6.7%(+10.1)#56 | 11.4%(+5.40)#3,772 |
| 57. | Wallace | 16.7% | 6.7%(+10.00)#57 | 11.4%(+5.30)#3,798 |
| 58. | St. Wendel | 15.9% | 6.7%(+9.20)#58 | 11.4%(+4.50)#4,010 |
| 59. | Woodlawn Heights | 15.8% | 6.7%(+9.10)#59 | 11.4%(+4.40)#4,050 |
| 60. | Butlerville | 15.7% | 6.7%(+9.00)#60 | 11.4%(+4.30)#4,080 |
| 61. | Foxcliff Estates | 15.4% | 6.7%(+8.70)#61 | 11.4%(+4.00)#4,159 |
| 62. | Whitestown | 15.3% | 6.7%(+8.60)#62 | 11.4%(+3.90)#4,195 |
| 63. | Nineveh | 15.2% | 6.7%(+8.50)#63 | 11.4%(+3.80)#4,244 |
| 64. | Newburgh | 15.1% | 6.7%(+8.40)#64 | 11.4%(+3.70)#4,263 |
| 65. | Blue Ridge | 15.0% | 6.7%(+8.30)#65 | 11.4%(+3.60)#4,306 |
| 66. | Noblesville | 14.8% | 6.7%(+8.10)#66 | 11.4%(+3.40)#4,348 |
| 67. | Winfield | 14.4% | 6.7%(+7.70)#67 | 11.4%(+3.00)#4,493 |
| 68. | Lake Holiday | 14.4% | 6.7%(+7.70)#68 | 11.4%(+3.00)#4,512 |
| 69. | Munster | 14.3% | 6.7%(+7.60)#69 | 11.4%(+2.90)#4,526 |
| 70. | Celestine | 14.3% | 6.7%(+7.60)#70 | 11.4%(+2.90)#4,554 |
| 71. | Spencerville | 14.1% | 6.7%(+7.40)#71 | 11.4%(+2.70)#4,625 |
| 72. | Huntertown | 13.8% | 6.7%(+7.10)#72 | 11.4%(+2.40)#4,728 |
| 73. | Philadelphia | 13.8% | 6.7%(+7.10)#73 | 11.4%(+2.40)#4,745 |
| 74. | Brownsburg | 13.7% | 6.7%(+7.00)#74 | 11.4%(+2.30)#4,767 |
| 75. | Georgetown | 13.3% | 6.7%(+6.60)#75 | 11.4%(+1.90)#4,936 |
| 76. | South Center | 12.9% | 6.7%(+6.20)#76 | 11.4%(+1.50)#5,131 |
| 77. | Leo Cedarville | 12.8% | 6.7%(+6.10)#77 | 11.4%(+1.40)#5,163 |
| 78. | Shadeland | 12.8% | 6.7%(+6.10)#78 | 11.4%(+1.40)#5,167 |
| 79. | Decker | 12.8% | 6.7%(+6.10)#79 | 11.4%(+1.40)#5,183 |
| 80. | Lake Dalecarlia | 12.6% | 6.7%(+5.90)#80 | 11.4%(+1.20)#5,256 |
| 81. | Oldenburg | 12.2% | 6.7%(+5.50)#81 | 11.4%(+0.800)#5,448 |
| 82. | Edgewood | 11.9% | 6.7%(+5.20)#82 | 11.4%(+0.500)#5,585 |
| 83. | New Palestine | 11.8% | 6.7%(+5.10)#83 | 11.4%(+0.400)#5,627 |
| 84. | Newbern | 11.8% | 6.7%(+5.10)#84 | 11.4%(+0.400)#5,644 |
| 85. | Painted Hills | 11.7% | 6.7%(+5.00)#85 | 11.4%(+0.300)#5,685 |
| 86. | Tocsin | 11.6% | 6.7%(+4.90)#86 | 11.4%(+0.200)#5,733 |
| 87. | St Leon | 11.3% | 6.7%(+4.60)#87 | 11.4%(-0.100)#5,853 |
| 88. | Barbee | 11.2% | 6.7%(+4.50)#88 | 11.4%(-0.200)#5,888 |
| 89. | Ramsey | 11.0% | 6.7%(+4.30)#89 | 11.4%(-0.400)#5,994 |
| 90. | Greenville | 10.9% | 6.7%(+4.20)#90 | 11.4%(-0.500)#6,038 |
| 91. | Coatesville | 10.9% | 6.7%(+4.20)#91 | 11.4%(-0.500)#6,046 |
| 92. | Schererville | 10.8% | 6.7%(+4.10)#92 | 11.4%(-0.600)#6,063 |
| 93. | Avon | 10.8% | 6.7%(+4.10)#93 | 11.4%(-0.600)#6,065 |
| 94. | Cedar Lake | 10.8% | 6.7%(+4.10)#94 | 11.4%(-0.600)#6,068 |
| 95. | Dyer | 10.6% | 6.7%(+3.90)#95 | 11.4%(-0.800)#6,168 |
| 96. | Romney | 10.5% | 6.7%(+3.80)#96 | 11.4%(-0.900)#6,256 |
| 97. | Battle Ground | 10.4% | 6.7%(+3.70)#97 | 11.4%(-1.000)#6,288 |
| 98. | Spring Hill | 10.4% | 6.7%(+3.70)#98 | 11.4%(-1.000)#6,308 |
| 99. | Pendleton | 10.2% | 6.7%(+3.50)#99 | 11.4%(-1.20)#6,398 |
| 100. | Dunlap | 10.1% | 6.7%(+3.40)#100 | 11.4%(-1.30)#6,451 |
Common Questions
What are the Top 10 Cities with the Highest Percentage of Households with Income Above $200,000 in Indiana?
Top 10 Cities with the Highest Percentage of Households with Income Above $200,000 in Indiana are:
#1
66.7%
#2
64.7%
#3
56.0%
#4
55.2%
#5
53.8%
#6
51.7%
#7
49.4%
#8
44.2%
#9
43.2%
#10
42.9%
What city has the Highest Percentage of Households with Income Above $200,000 in Indiana?
Florence has the Highest Percentage of Households with Income Above $200,000 in Indiana with 66.7%.
What is the Percentage of Households with Income Above $200,000 in the State of Indiana?
Percentage of Households with Income Above $200,000 in Indiana is 6.7%.
What is the Percentage of Households with Income Above $200,000 in the United States?
Percentage of Households with Income Above $200,000 in the United States is 11.4%.