Cities with the Highest Percentage of Households with Income Above $200,000 in West Virginia
RELATED REPORTS & OPTIONS
Household Income | $200k+
West Virginia
Compare Cities
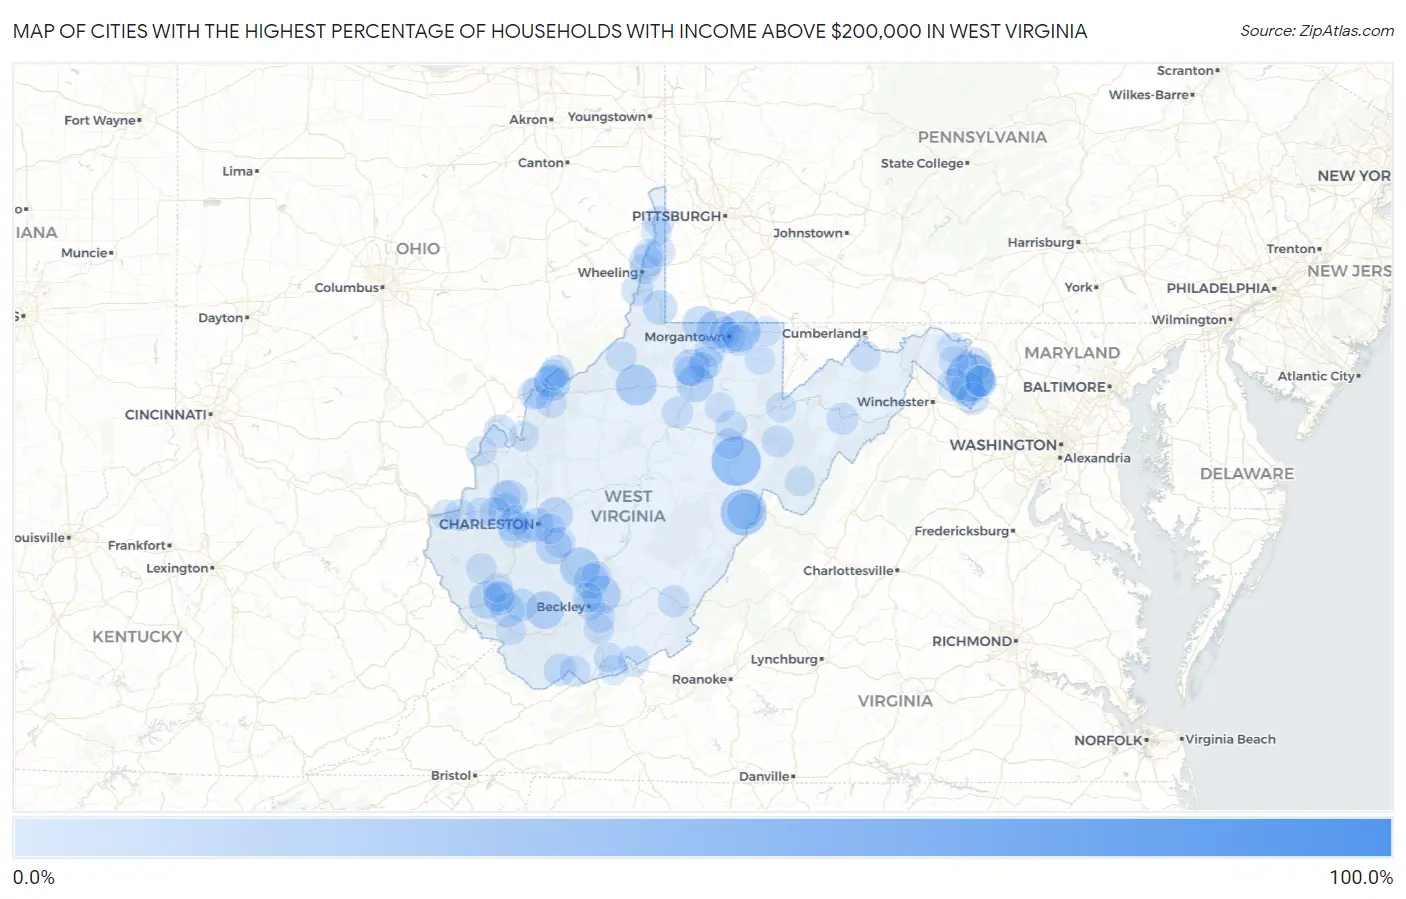
Map of Cities with the Highest Percentage of Households with Income Above $200,000 in West Virginia
0.0%
100.0%
Cities with the Highest Percentage of Households with Income Above $200,000 in West Virginia
| City | Households with Income > $200k | vs State | vs National | |
| 1. | Peach Creek | 100.0% | 4.8%(+95.2)#1 | 11.4%(+88.6)#9 |
| 2. | East Dailey | 38.2% | 4.8%(+33.4)#2 | 11.4%(+26.8)#951 |
| 3. | Booth | 37.0% | 4.8%(+32.2)#3 | 11.4%(+25.6)#1,022 |
| 4. | Shenandoah Junction | 36.0% | 4.8%(+31.2)#4 | 11.4%(+24.6)#1,082 |
| 5. | Green Bank | 32.3% | 4.8%(+27.5)#5 | 11.4%(+20.9)#1,407 |
| 6. | Cheat Lake | 23.0% | 4.8%(+18.2)#6 | 11.4%(+11.6)#2,480 |
| 7. | West Union | 22.6% | 4.8%(+17.8)#7 | 11.4%(+11.2)#2,551 |
| 8. | Page | 21.1% | 4.8%(+16.3)#8 | 11.4%(+9.70)#2,840 |
| 9. | Cassville | 19.2% | 4.8%(+14.4)#9 | 11.4%(+7.80)#3,225 |
| 10. | Prince | 18.6% | 4.8%(+13.8)#10 | 11.4%(+7.20)#3,383 |
| 11. | Kopperston | 17.8% | 4.8%(+13.0)#11 | 11.4%(+6.40)#3,563 |
| 12. | Holden | 17.1% | 4.8%(+12.3)#12 | 11.4%(+5.70)#3,713 |
| 13. | Bridgeport | 16.1% | 4.8%(+11.3)#13 | 11.4%(+4.70)#3,945 |
| 14. | Enterprise | 15.6% | 4.8%(+10.8)#14 | 11.4%(+4.20)#4,108 |
| 15. | Arbovale | 14.9% | 4.8%(+10.1)#15 | 11.4%(+3.50)#4,345 |
| 16. | North Hills | 14.2% | 4.8%(+9.40)#16 | 11.4%(+2.80)#4,594 |
| 17. | Chelyan | 14.1% | 4.8%(+9.30)#17 | 11.4%(+2.70)#4,621 |
| 18. | Scarbro | 14.1% | 4.8%(+9.30)#18 | 11.4%(+2.70)#4,628 |
| 19. | Pinch | 13.4% | 4.8%(+8.60)#19 | 11.4%(+2.00)#4,902 |
| 20. | Blacksville | 13.3% | 4.8%(+8.50)#20 | 11.4%(+1.90)#4,960 |
| 21. | Shepherdstown | 12.9% | 4.8%(+8.10)#21 | 11.4%(+1.50)#5,116 |
| 22. | Winfield | 12.3% | 4.8%(+7.50)#22 | 11.4%(+0.900)#5,390 |
| 23. | Charles Town | 12.1% | 4.8%(+7.30)#23 | 11.4%(+0.700)#5,480 |
| 24. | Norton | 12.0% | 4.8%(+7.20)#24 | 11.4%(+0.600)#5,553 |
| 25. | Cameron | 11.2% | 4.8%(+6.40)#25 | 11.4%(-0.200)#5,893 |
| 26. | Man | 11.1% | 4.8%(+6.30)#26 | 11.4%(-0.300)#5,931 |
| 27. | Charleston | 10.8% | 4.8%(+6.00)#27 | 11.4%(-0.600)#6,060 |
| 28. | Teays Valley | 10.7% | 4.8%(+5.90)#28 | 11.4%(-0.700)#6,115 |
| 29. | Arthurdale | 10.6% | 4.8%(+5.80)#29 | 11.4%(-0.800)#6,200 |
| 30. | Clearview | 10.5% | 4.8%(+5.70)#30 | 11.4%(-0.900)#6,251 |
| 31. | Middleway | 9.6% | 4.8%(+4.80)#31 | 11.4%(-1.80)#6,805 |
| 32. | Mcconnell | 9.1% | 4.8%(+4.30)#32 | 11.4%(-2.30)#7,143 |
| 33. | Robinette | 8.7% | 4.8%(+3.90)#33 | 11.4%(-2.70)#7,410 |
| 34. | New Haven | 8.5% | 4.8%(+3.70)#34 | 11.4%(-2.90)#7,540 |
| 35. | Pleasant Valley | 8.4% | 4.8%(+3.60)#35 | 11.4%(-3.00)#7,600 |
| 36. | Williamstown | 8.3% | 4.8%(+3.50)#36 | 11.4%(-3.10)#7,679 |
| 37. | Blennerhassett | 8.1% | 4.8%(+3.30)#37 | 11.4%(-3.30)#7,848 |
| 38. | Shannondale | 7.8% | 4.8%(+3.00)#38 | 11.4%(-3.60)#8,087 |
| 39. | Anawalt | 7.8% | 4.8%(+3.00)#39 | 11.4%(-3.60)#8,145 |
| 40. | Glen Dale | 7.7% | 4.8%(+2.90)#40 | 11.4%(-3.70)#8,191 |
| 41. | Pea Ridge | 7.5% | 4.8%(+2.70)#41 | 11.4%(-3.90)#8,339 |
| 42. | Harman | 7.1% | 4.8%(+2.30)#42 | 11.4%(-4.30)#8,759 |
| 43. | Tornado | 7.0% | 4.8%(+2.20)#43 | 11.4%(-4.40)#8,829 |
| 44. | Lewisburg | 6.9% | 4.8%(+2.10)#44 | 11.4%(-4.50)#8,896 |
| 45. | Moorefield | 6.8% | 4.8%(+2.00)#45 | 11.4%(-4.60)#9,031 |
| 46. | Star City | 6.8% | 4.8%(+2.00)#46 | 11.4%(-4.60)#9,038 |
| 47. | Belington | 6.8% | 4.8%(+2.00)#47 | 11.4%(-4.60)#9,041 |
| 48. | Vienna | 6.5% | 4.8%(+1.70)#48 | 11.4%(-4.90)#9,338 |
| 49. | Washington | 6.5% | 4.8%(+1.70)#49 | 11.4%(-4.90)#9,377 |
| 50. | Jane Lew | 6.4% | 4.8%(+1.60)#50 | 11.4%(-5.00)#9,508 |
| 51. | Morgantown | 6.3% | 4.8%(+1.50)#51 | 11.4%(-5.10)#9,534 |
| 52. | Eleanor | 6.0% | 4.8%(+1.20)#52 | 11.4%(-5.40)#9,971 |
| 53. | Bolivar | 6.0% | 4.8%(+1.20)#53 | 11.4%(-5.40)#9,979 |
| 54. | Logan | 5.9% | 4.8%(+1.10)#54 | 11.4%(-5.50)#10,091 |
| 55. | Peterstown | 5.9% | 4.8%(+1.10)#55 | 11.4%(-5.50)#10,129 |
| 56. | Cedar Grove | 5.9% | 4.8%(+1.10)#56 | 11.4%(-5.50)#10,139 |
| 57. | Bramwell | 5.9% | 4.8%(+1.10)#57 | 11.4%(-5.50)#10,155 |
| 58. | Alum Creek | 5.8% | 4.8%(+1.000)#58 | 11.4%(-5.60)#10,238 |
| 59. | Clifton | 5.8% | 4.8%(+1.000)#59 | 11.4%(-5.60)#10,275 |
| 60. | Brookhaven | 5.7% | 4.8%(+0.900)#60 | 11.4%(-5.70)#10,340 |
| 61. | Wheeling | 5.6% | 4.8%(+0.800)#61 | 11.4%(-5.80)#10,444 |
| 62. | Harpers Ferry | 5.6% | 4.8%(+0.800)#62 | 11.4%(-5.80)#10,571 |
| 63. | Hurricane | 5.5% | 4.8%(+0.700)#63 | 11.4%(-5.90)#10,635 |
| 64. | Mineralwells | 5.5% | 4.8%(+0.700)#64 | 11.4%(-5.90)#10,673 |
| 65. | Womelsdorf Coalton | 5.4% | 4.8%(+0.600)#65 | 11.4%(-6.00)#10,864 |
| 66. | Boaz | 5.3% | 4.8%(+0.500)#66 | 11.4%(-6.10)#10,962 |
| 67. | South Charleston | 5.2% | 4.8%(+0.400)#67 | 11.4%(-6.20)#11,055 |
| 68. | Rivesville | 5.2% | 4.8%(+0.400)#68 | 11.4%(-6.20)#11,135 |
| 69. | Weirton | 5.1% | 4.8%(+0.300)#69 | 11.4%(-6.30)#11,191 |
| 70. | White Hall | 5.1% | 4.8%(+0.300)#70 | 11.4%(-6.30)#11,272 |
| 71. | Middlebourne | 5.1% | 4.8%(+0.300)#71 | 11.4%(-6.30)#11,283 |
| 72. | Harts | 5.1% | 4.8%(+0.300)#72 | 11.4%(-6.30)#11,304 |
| 73. | Coal Fork | 5.0% | 4.8%(+0.200)#73 | 11.4%(-6.40)#11,438 |
| 74. | Reynoldsville | 5.0% | 4.8%(+0.200)#74 | 11.4%(-6.40)#11,476 |
| 75. | Fort Ashby | 4.7% | 4.8%(-0.100)#75 | 11.4%(-6.70)#11,914 |
| 76. | Huntington | 4.5% | 4.8%(-0.300)#76 | 11.4%(-6.90)#12,137 |
| 77. | Beckley | 4.5% | 4.8%(-0.300)#77 | 11.4%(-6.90)#12,154 |
| 78. | Point Pleasant | 4.5% | 4.8%(-0.300)#78 | 11.4%(-6.90)#12,198 |
| 79. | Bethany | 4.5% | 4.8%(-0.300)#79 | 11.4%(-6.90)#12,254 |
| 80. | Shady Spring | 4.4% | 4.8%(-0.400)#80 | 11.4%(-7.00)#12,401 |
| 81. | Shinnston | 4.4% | 4.8%(-0.400)#81 | 11.4%(-7.00)#12,412 |
| 82. | Ghent | 4.4% | 4.8%(-0.400)#82 | 11.4%(-7.00)#12,483 |
| 83. | Thomas | 4.2% | 4.8%(-0.600)#83 | 11.4%(-7.20)#12,843 |
| 84. | St Albans | 4.1% | 4.8%(-0.700)#84 | 11.4%(-7.30)#12,908 |
| 85. | Oak Hill | 4.1% | 4.8%(-0.700)#85 | 11.4%(-7.30)#12,917 |
| 86. | Philippi | 4.1% | 4.8%(-0.700)#86 | 11.4%(-7.30)#12,950 |
| 87. | Follansbee | 4.1% | 4.8%(-0.700)#87 | 11.4%(-7.30)#12,953 |
| 88. | Gilbert | 4.1% | 4.8%(-0.700)#88 | 11.4%(-7.30)#13,043 |
| 89. | Milton | 4.0% | 4.8%(-0.800)#89 | 11.4%(-7.40)#13,146 |
| 90. | Prosperity | 4.0% | 4.8%(-0.800)#90 | 11.4%(-7.40)#13,171 |
| 91. | Oakvale | 4.0% | 4.8%(-0.800)#91 | 11.4%(-7.40)#13,242 |
| 92. | Ravenswood | 3.8% | 4.8%(-1.00)#92 | 11.4%(-7.60)#13,520 |
| 93. | Martinsburg | 3.7% | 4.8%(-1.10)#93 | 11.4%(-7.70)#13,681 |
| 94. | Franklin | 3.7% | 4.8%(-1.10)#94 | 11.4%(-7.70)#13,853 |
| 95. | Hedgesville | 3.7% | 4.8%(-1.10)#95 | 11.4%(-7.70)#13,857 |
| 96. | Brandonville | 3.7% | 4.8%(-1.10)#96 | 11.4%(-7.70)#13,859 |
| 97. | Athens | 3.6% | 4.8%(-1.20)#97 | 11.4%(-7.80)#13,990 |
| 98. | Windsor Heights | 3.6% | 4.8%(-1.20)#98 | 11.4%(-7.80)#14,024 |
| 99. | Mitchell Heights | 3.6% | 4.8%(-1.20)#99 | 11.4%(-7.80)#14,030 |
| 100. | Kingwood | 3.5% | 4.8%(-1.30)#100 | 11.4%(-7.90)#14,142 |
Common Questions
What are the Top 10 Cities with the Highest Percentage of Households with Income Above $200,000 in West Virginia?
Top 10 Cities with the Highest Percentage of Households with Income Above $200,000 in West Virginia are:
#1
38.2%
#2
36.0%
#3
32.3%
#4
23.0%
#5
22.6%
#6
21.1%
#7
19.2%
#8
18.6%
#9
17.8%
#10
17.1%
What city has the Highest Percentage of Households with Income Above $200,000 in West Virginia?
East Dailey has the Highest Percentage of Households with Income Above $200,000 in West Virginia with 38.2%.
What is the Percentage of Households with Income Above $200,000 in the State of West Virginia?
Percentage of Households with Income Above $200,000 in West Virginia is 4.8%.
What is the Percentage of Households with Income Above $200,000 in the United States?
Percentage of Households with Income Above $200,000 in the United States is 11.4%.