Cities with the Highest Percentage of Households with Income Above $200,000 in Colorado
RELATED REPORTS & OPTIONS
Household Income | $200k+
Colorado
Compare Cities
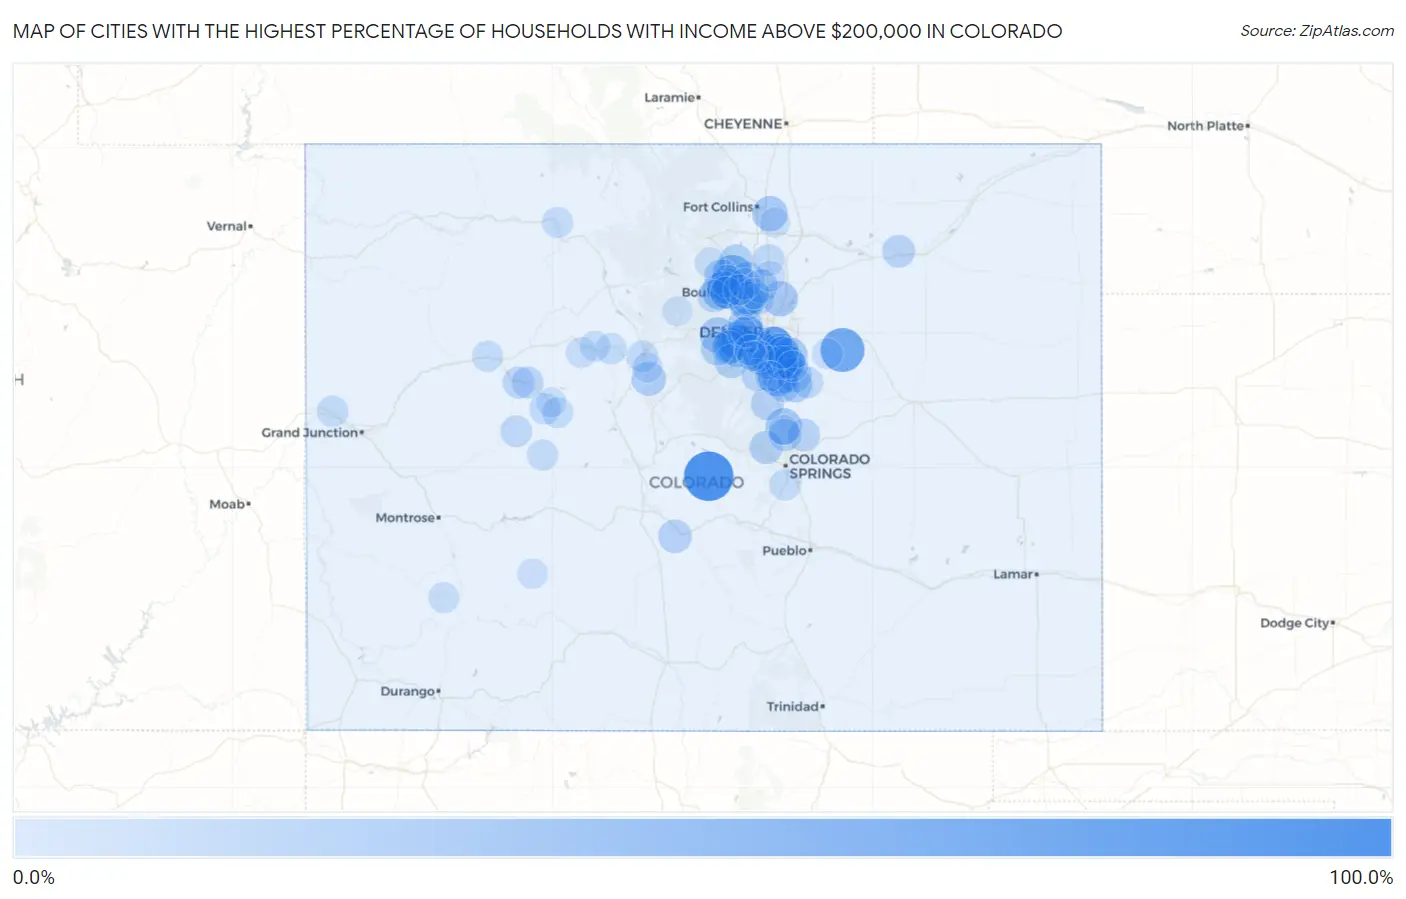
Map of Cities with the Highest Percentage of Households with Income Above $200,000 in Colorado
0.0%
100.0%
Cities with the Highest Percentage of Households with Income Above $200,000 in Colorado
| City | Households with Income > $200k | vs State | vs National | |
| 1. | Guffey | 100.0% | 13.9%(+86.1)#1 | 11.4%(+88.6)#14 |
| 2. | Comanche Creek | 75.0% | 13.9%(+61.1)#2 | 11.4%(+63.6)#49 |
| 3. | Cherry Hills Village | 66.9% | 13.9%(+53.0)#3 | 11.4%(+55.5)#98 |
| 4. | Columbine Valley | 62.5% | 13.9%(+48.6)#4 | 11.4%(+51.1)#144 |
| 5. | Seven Hills | 60.0% | 13.9%(+46.1)#5 | 11.4%(+48.6)#187 |
| 6. | Altona | 58.6% | 13.9%(+44.7)#6 | 11.4%(+47.2)#219 |
| 7. | Castle Pines Village | 57.0% | 13.9%(+43.1)#7 | 11.4%(+45.6)#248 |
| 8. | Upper Witter Gulch | 56.8% | 13.9%(+42.9)#8 | 11.4%(+45.4)#252 |
| 9. | Stepping Stone | 54.3% | 13.9%(+40.4)#9 | 11.4%(+42.9)#321 |
| 10. | Bow Mar | 51.3% | 13.9%(+37.4)#10 | 11.4%(+39.9)#411 |
| 11. | Sterling Ranch | 49.8% | 13.9%(+35.9)#11 | 11.4%(+38.4)#460 |
| 12. | Echo Hills | 48.8% | 13.9%(+34.9)#12 | 11.4%(+37.4)#486 |
| 13. | Meridian | 46.9% | 13.9%(+33.0)#13 | 11.4%(+35.5)#537 |
| 14. | Paragon Estates | 45.8% | 13.9%(+31.9)#14 | 11.4%(+34.4)#585 |
| 15. | Castle Pines | 44.9% | 13.9%(+31.0)#15 | 11.4%(+33.5)#613 |
| 16. | Indian Hills | 43.8% | 13.9%(+29.9)#16 | 11.4%(+32.4)#662 |
| 17. | Sugarloaf | 43.8% | 13.9%(+29.9)#17 | 11.4%(+32.4)#665 |
| 18. | Genesee | 42.4% | 13.9%(+28.5)#18 | 11.4%(+31.0)#715 |
| 19. | Woodmoor | 41.7% | 13.9%(+27.8)#19 | 11.4%(+30.3)#747 |
| 20. | Grand View Estates | 41.5% | 13.9%(+27.6)#20 | 11.4%(+30.1)#760 |
| 21. | East Pleasant View | 41.5% | 13.9%(+27.6)#21 | 11.4%(+30.1)#763 |
| 22. | Pine Brook Hill | 41.4% | 13.9%(+27.5)#22 | 11.4%(+30.0)#768 |
| 23. | Idledale | 39.6% | 13.9%(+25.7)#23 | 11.4%(+28.2)#863 |
| 24. | Floyd Hill | 39.5% | 13.9%(+25.6)#24 | 11.4%(+28.1)#870 |
| 25. | Greenwood Village | 39.2% | 13.9%(+25.3)#25 | 11.4%(+27.8)#886 |
| 26. | Todd Creek | 39.1% | 13.9%(+25.2)#26 | 11.4%(+27.7)#895 |
| 27. | Cherry Creek | 38.4% | 13.9%(+24.5)#27 | 11.4%(+27.0)#932 |
| 28. | Timnath | 38.3% | 13.9%(+24.4)#28 | 11.4%(+26.9)#939 |
| 29. | Foxfield | 37.5% | 13.9%(+23.6)#29 | 11.4%(+26.1)#984 |
| 30. | Kittredge | 37.1% | 13.9%(+23.2)#30 | 11.4%(+25.7)#1,012 |
| 31. | The Pinery | 36.5% | 13.9%(+22.6)#31 | 11.4%(+25.1)#1,044 |
| 32. | Fairmount | 35.6% | 13.9%(+21.7)#32 | 11.4%(+24.2)#1,117 |
| 33. | Franktown | 35.2% | 13.9%(+21.3)#33 | 11.4%(+23.8)#1,162 |
| 34. | Holly Hills | 34.1% | 13.9%(+20.2)#34 | 11.4%(+22.7)#1,235 |
| 35. | Blue River | 33.9% | 13.9%(+20.0)#35 | 11.4%(+22.5)#1,261 |
| 36. | Niwot | 33.5% | 13.9%(+19.6)#36 | 11.4%(+22.1)#1,288 |
| 37. | Superior | 32.8% | 13.9%(+18.9)#37 | 11.4%(+21.4)#1,351 |
| 38. | Lyons | 32.4% | 13.9%(+18.5)#38 | 11.4%(+21.0)#1,387 |
| 39. | Louisville | 32.3% | 13.9%(+18.4)#39 | 11.4%(+20.9)#1,394 |
| 40. | Evergreen | 32.3% | 13.9%(+18.4)#40 | 11.4%(+20.9)#1,399 |
| 41. | Aspen Park | 32.3% | 13.9%(+18.4)#41 | 11.4%(+20.9)#1,403 |
| 42. | Placerville | 32.3% | 13.9%(+18.4)#42 | 11.4%(+20.9)#1,405 |
| 43. | Jamestown | 31.5% | 13.9%(+17.6)#43 | 11.4%(+20.1)#1,478 |
| 44. | Coaldale | 31.1% | 13.9%(+17.2)#44 | 11.4%(+19.7)#1,515 |
| 45. | Highlands Ranch | 30.5% | 13.9%(+16.6)#45 | 11.4%(+19.1)#1,563 |
| 46. | Erie | 30.3% | 13.9%(+16.4)#46 | 11.4%(+18.9)#1,579 |
| 47. | Upper Bear Creek | 30.1% | 13.9%(+16.2)#47 | 11.4%(+18.7)#1,611 |
| 48. | Stonegate | 30.0% | 13.9%(+16.1)#48 | 11.4%(+18.6)#1,615 |
| 49. | Cascade Chipita Park | 29.9% | 13.9%(+16.0)#49 | 11.4%(+18.5)#1,633 |
| 50. | Perry Park | 28.9% | 13.9%(+15.0)#50 | 11.4%(+17.5)#1,724 |
| 51. | Lone Tree | 28.4% | 13.9%(+14.5)#51 | 11.4%(+17.0)#1,784 |
| 52. | Morgan Heights | 28.0% | 13.9%(+14.1)#52 | 11.4%(+16.6)#1,820 |
| 53. | Crisman | 27.9% | 13.9%(+14.0)#53 | 11.4%(+16.5)#1,833 |
| 54. | Black Forest | 27.7% | 13.9%(+13.8)#54 | 11.4%(+16.3)#1,852 |
| 55. | Gleneagle | 27.3% | 13.9%(+13.4)#55 | 11.4%(+15.9)#1,891 |
| 56. | Lazy Acres | 27.3% | 13.9%(+13.4)#56 | 11.4%(+15.9)#1,899 |
| 57. | Roxborough Park | 26.7% | 13.9%(+12.8)#57 | 11.4%(+15.3)#1,965 |
| 58. | St Ann Highlands | 26.7% | 13.9%(+12.8)#58 | 11.4%(+15.3)#1,971 |
| 59. | Applewood | 26.5% | 13.9%(+12.6)#59 | 11.4%(+15.1)#1,992 |
| 60. | Centennial | 25.0% | 13.9%(+11.1)#60 | 11.4%(+13.6)#2,154 |
| 61. | Castle Rock | 24.6% | 13.9%(+10.7)#61 | 11.4%(+13.2)#2,209 |
| 62. | Mulford | 24.6% | 13.9%(+10.7)#62 | 11.4%(+13.2)#2,223 |
| 63. | El Jebel | 24.4% | 13.9%(+10.5)#63 | 11.4%(+13.0)#2,247 |
| 64. | Tall Timber | 24.4% | 13.9%(+10.5)#64 | 11.4%(+13.0)#2,251 |
| 65. | Mead | 24.0% | 13.9%(+10.1)#65 | 11.4%(+12.6)#2,309 |
| 66. | Marble | 23.5% | 13.9%(+9.60)#66 | 11.4%(+12.1)#2,397 |
| 67. | Frisco | 22.6% | 13.9%(+8.70)#67 | 11.4%(+11.2)#2,546 |
| 68. | Broomfield | 22.5% | 13.9%(+8.60)#68 | 11.4%(+11.1)#2,560 |
| 69. | Ponderosa Park | 22.5% | 13.9%(+8.60)#69 | 11.4%(+11.1)#2,567 |
| 70. | Gunbarrel | 22.3% | 13.9%(+8.40)#70 | 11.4%(+10.9)#2,599 |
| 71. | Loma | 22.3% | 13.9%(+8.40)#71 | 11.4%(+10.9)#2,605 |
| 72. | Snowmass Village | 22.1% | 13.9%(+8.20)#72 | 11.4%(+10.7)#2,643 |
| 73. | Columbine | 21.6% | 13.9%(+7.70)#73 | 11.4%(+10.2)#2,719 |
| 74. | Mount Crested Butte | 21.3% | 13.9%(+7.40)#74 | 11.4%(+9.90)#2,800 |
| 75. | Rock Creek Park | 21.3% | 13.9%(+7.40)#75 | 11.4%(+9.90)#2,810 |
| 76. | Parker | 21.2% | 13.9%(+7.30)#76 | 11.4%(+9.80)#2,813 |
| 77. | Steamboat Springs | 21.0% | 13.9%(+7.10)#77 | 11.4%(+9.60)#2,847 |
| 78. | Vail | 21.0% | 13.9%(+7.10)#78 | 11.4%(+9.60)#2,849 |
| 79. | Chacra | 21.0% | 13.9%(+7.10)#79 | 11.4%(+9.60)#2,853 |
| 80. | Lafayette | 20.9% | 13.9%(+7.00)#80 | 11.4%(+9.50)#2,860 |
| 81. | Aspen | 20.7% | 13.9%(+6.80)#81 | 11.4%(+9.30)#2,900 |
| 82. | Telluride | 20.0% | 13.9%(+6.10)#82 | 11.4%(+8.60)#3,041 |
| 83. | Boulder | 19.8% | 13.9%(+5.90)#83 | 11.4%(+8.40)#3,088 |
| 84. | Golden | 19.5% | 13.9%(+5.60)#84 | 11.4%(+8.10)#3,152 |
| 85. | Brick Center | 19.5% | 13.9%(+5.60)#85 | 11.4%(+8.10)#3,169 |
| 86. | Edwards | 19.4% | 13.9%(+5.50)#86 | 11.4%(+8.00)#3,174 |
| 87. | Avon | 19.2% | 13.9%(+5.30)#87 | 11.4%(+7.80)#3,217 |
| 88. | Sedalia | 18.8% | 13.9%(+4.90)#88 | 11.4%(+7.40)#3,336 |
| 89. | Dakota Ridge | 18.6% | 13.9%(+4.70)#89 | 11.4%(+7.20)#3,360 |
| 90. | Frederick | 18.6% | 13.9%(+4.70)#90 | 11.4%(+7.20)#3,363 |
| 91. | Breckenridge | 18.5% | 13.9%(+4.60)#91 | 11.4%(+7.10)#3,393 |
| 92. | Allenspark | 18.3% | 13.9%(+4.40)#92 | 11.4%(+6.90)#3,434 |
| 93. | Sierra Ridge | 18.2% | 13.9%(+4.30)#93 | 11.4%(+6.80)#3,453 |
| 94. | Cathedral | 18.2% | 13.9%(+4.30)#94 | 11.4%(+6.80)#3,468 |
| 95. | Monument | 17.7% | 13.9%(+3.80)#95 | 11.4%(+6.30)#3,570 |
| 96. | Matheson | 17.6% | 13.9%(+3.70)#96 | 11.4%(+6.20)#3,608 |
| 97. | Windsor | 17.2% | 13.9%(+3.30)#97 | 11.4%(+5.80)#3,671 |
| 98. | Ken Caryl | 17.2% | 13.9%(+3.30)#98 | 11.4%(+5.80)#3,672 |
| 99. | Woody Creek | 16.8% | 13.9%(+2.90)#99 | 11.4%(+5.40)#3,775 |
| 100. | Winter Park | 16.7% | 13.9%(+2.80)#100 | 11.4%(+5.30)#3,793 |
Common Questions
What are the Top 10 Cities with the Highest Percentage of Households with Income Above $200,000 in Colorado?
Top 10 Cities with the Highest Percentage of Households with Income Above $200,000 in Colorado are:
#1
100.0%
#2
75.0%
#3
66.9%
#4
62.5%
#5
60.0%
#6
58.6%
#7
57.0%
#8
51.3%
#9
46.9%
#10
45.8%
What city has the Highest Percentage of Households with Income Above $200,000 in Colorado?
Guffey has the Highest Percentage of Households with Income Above $200,000 in Colorado with 100.0%.
What is the Percentage of Households with Income Above $200,000 in the State of Colorado?
Percentage of Households with Income Above $200,000 in Colorado is 13.9%.
What is the Percentage of Households with Income Above $200,000 in the United States?
Percentage of Households with Income Above $200,000 in the United States is 11.4%.