Cities with the Highest Percentage of Households with Income Above $200,000 in Virginia
RELATED REPORTS & OPTIONS
Household Income | $200k+
Virginia
Compare Cities
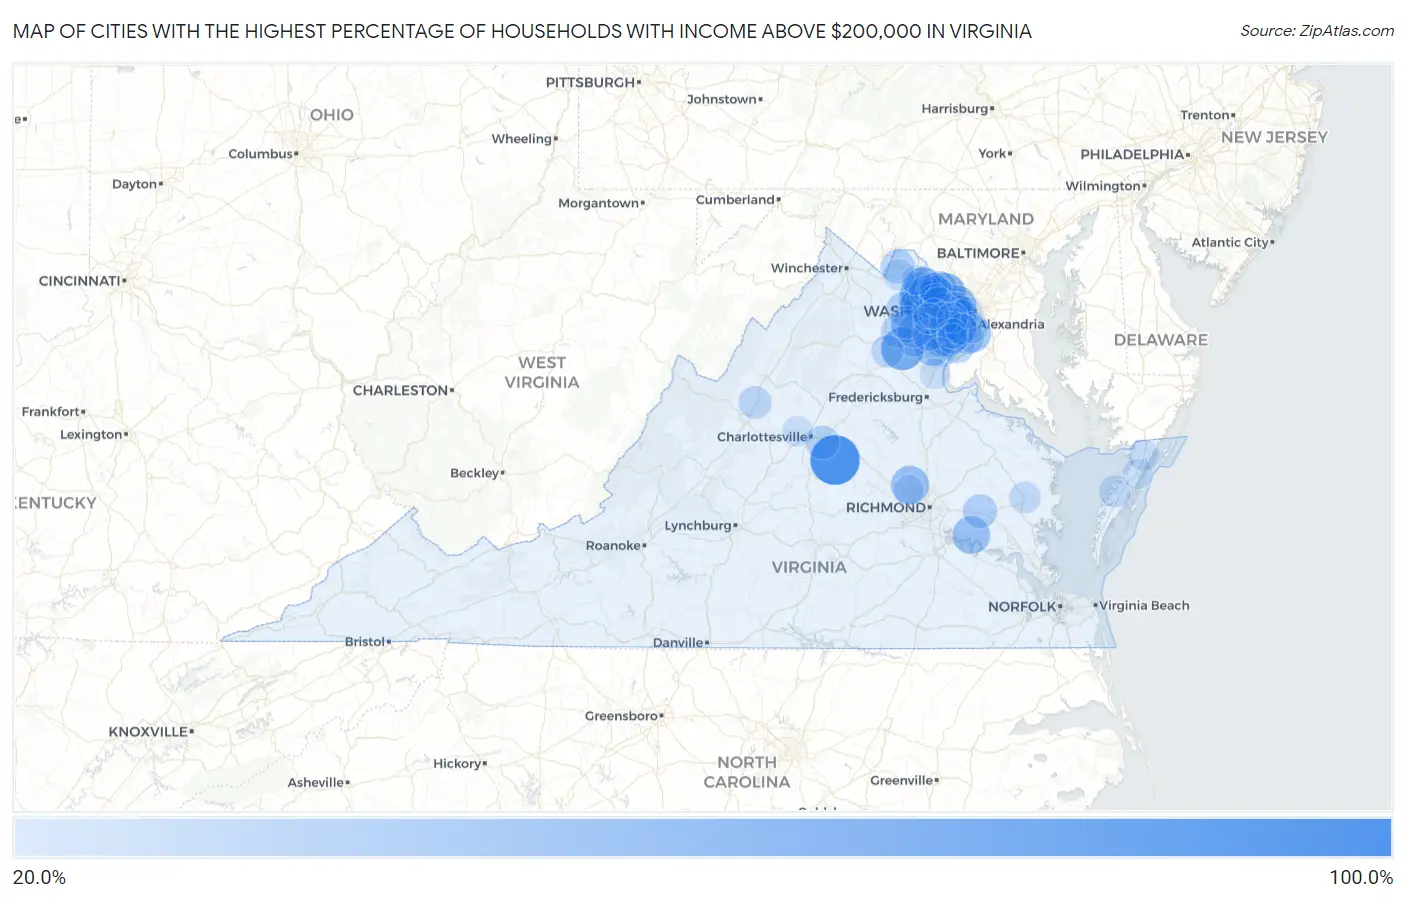
Map of Cities with the Highest Percentage of Households with Income Above $200,000 in Virginia
0.0%
100.0%
Cities with the Highest Percentage of Households with Income Above $200,000 in Virginia
| City | Households with Income > $200k | vs State | vs National | |
| 1. | Palmyra | 100.0% | 15.6%(+84.4)#1 | 11.4%(+88.6)#4 |
| 2. | Keswick | 81.4% | 15.6%(+65.8)#2 | 11.4%(+70.0)#31 |
| 3. | Great Falls Crossing | 75.7% | 15.6%(+60.1)#3 | 11.4%(+64.3)#46 |
| 4. | Calverton | 73.8% | 15.6%(+58.2)#4 | 11.4%(+62.4)#55 |
| 5. | One Loudoun | 71.1% | 15.6%(+55.5)#5 | 11.4%(+59.7)#68 |
| 6. | Great Falls | 69.4% | 15.6%(+53.8)#6 | 11.4%(+58.0)#81 |
| 7. | Difficult Run | 68.9% | 15.6%(+53.3)#7 | 11.4%(+57.5)#87 |
| 8. | Clifton | 65.7% | 15.6%(+50.1)#8 | 11.4%(+54.3)#109 |
| 9. | Union Mill | 63.5% | 15.6%(+47.9)#9 | 11.4%(+52.1)#128 |
| 10. | Crosspointe | 63.0% | 15.6%(+47.4)#10 | 11.4%(+51.6)#136 |
| 11. | Wolf Trap | 62.8% | 15.6%(+47.2)#11 | 11.4%(+51.4)#142 |
| 12. | Mclean | 61.8% | 15.6%(+46.2)#12 | 11.4%(+50.4)#149 |
| 13. | Schooner Bay | 61.5% | 15.6%(+45.9)#13 | 11.4%(+50.1)#155 |
| 14. | Broadlands | 61.1% | 15.6%(+45.5)#14 | 11.4%(+49.7)#161 |
| 15. | Dunn Loring | 60.6% | 15.6%(+45.0)#15 | 11.4%(+49.2)#173 |
| 16. | Brambleton | 59.8% | 15.6%(+44.2)#16 | 11.4%(+48.4)#191 |
| 17. | Floris | 59.6% | 15.6%(+44.0)#17 | 11.4%(+48.2)#195 |
| 18. | South Run | 59.5% | 15.6%(+43.9)#18 | 11.4%(+48.1)#199 |
| 19. | Loudoun Valley Estates | 58.4% | 15.6%(+42.8)#19 | 11.4%(+47.0)#222 |
| 20. | Navy | 57.5% | 15.6%(+41.9)#20 | 11.4%(+46.1)#239 |
| 21. | Wyndham | 55.8% | 15.6%(+40.2)#21 | 11.4%(+44.4)#276 |
| 22. | Belmont | 55.0% | 15.6%(+39.4)#22 | 11.4%(+43.6)#292 |
| 23. | Braddock | 54.7% | 15.6%(+39.1)#23 | 11.4%(+43.3)#306 |
| 24. | Charles City | 54.5% | 15.6%(+38.9)#24 | 11.4%(+43.1)#314 |
| 25. | Lowes Island | 53.3% | 15.6%(+37.7)#25 | 11.4%(+41.9)#350 |
| 26. | Fort Hunt | 53.2% | 15.6%(+37.6)#26 | 11.4%(+41.8)#353 |
| 27. | Vienna | 52.8% | 15.6%(+37.2)#27 | 11.4%(+41.4)#368 |
| 28. | Fairfax Station | 52.5% | 15.6%(+36.9)#28 | 11.4%(+41.1)#378 |
| 29. | Dranesville | 52.1% | 15.6%(+36.5)#29 | 11.4%(+40.7)#383 |
| 30. | Franklin Farm | 51.9% | 15.6%(+36.3)#30 | 11.4%(+40.5)#390 |
| 31. | Independent Hill | 51.1% | 15.6%(+35.5)#31 | 11.4%(+39.7)#416 |
| 32. | Sully Square | 50.9% | 15.6%(+35.3)#32 | 11.4%(+39.5)#422 |
| 33. | Mantua | 49.7% | 15.6%(+34.1)#33 | 11.4%(+38.3)#463 |
| 34. | Goose Creek | 47.4% | 15.6%(+31.8)#34 | 11.4%(+36.0)#521 |
| 35. | South Riding | 44.3% | 15.6%(+28.7)#35 | 11.4%(+32.9)#639 |
| 36. | Long Branch | 44.0% | 15.6%(+28.4)#36 | 11.4%(+32.6)#655 |
| 37. | North Garden | 43.0% | 15.6%(+27.4)#37 | 11.4%(+31.6)#695 |
| 38. | Hayfield | 42.1% | 15.6%(+26.5)#38 | 11.4%(+30.7)#730 |
| 39. | New Kent | 41.0% | 15.6%(+25.4)#39 | 11.4%(+29.6)#782 |
| 40. | Hillsboro | 40.7% | 15.6%(+25.1)#40 | 11.4%(+29.3)#791 |
| 41. | Bull Run Mountain Estates | 40.6% | 15.6%(+25.0)#41 | 11.4%(+29.2)#794 |
| 42. | Mason Neck | 40.4% | 15.6%(+24.8)#42 | 11.4%(+29.0)#805 |
| 43. | Stone Ridge | 40.2% | 15.6%(+24.6)#43 | 11.4%(+28.8)#813 |
| 44. | Rivanna | 40.1% | 15.6%(+24.5)#44 | 11.4%(+28.7)#828 |
| 45. | Falls Church | 39.9% | 15.6%(+24.3)#45 | 11.4%(+28.5)#840 |
| 46. | Lansdowne | 39.6% | 15.6%(+24.0)#46 | 11.4%(+28.2)#858 |
| 47. | Mount Vernon | 39.2% | 15.6%(+23.6)#47 | 11.4%(+27.8)#888 |
| 48. | Nokesville | 39.2% | 15.6%(+23.6)#48 | 11.4%(+27.8)#891 |
| 49. | Burke | 39.1% | 15.6%(+23.5)#49 | 11.4%(+27.7)#893 |
| 50. | Pimmit Hills | 39.1% | 15.6%(+23.5)#50 | 11.4%(+27.7)#894 |
| 51. | County Center | 38.7% | 15.6%(+23.1)#51 | 11.4%(+27.3)#915 |
| 52. | Oak Grove | 38.7% | 15.6%(+23.1)#52 | 11.4%(+27.3)#917 |
| 53. | Rose Hill Cdp Fairfax County | 38.2% | 15.6%(+22.6)#53 | 11.4%(+26.8)#944 |
| 54. | Moorefield | 37.1% | 15.6%(+21.5)#54 | 11.4%(+25.7)#1,009 |
| 55. | New Baltimore | 37.0% | 15.6%(+21.4)#55 | 11.4%(+25.6)#1,017 |
| 56. | Oakton | 36.3% | 15.6%(+20.7)#56 | 11.4%(+24.9)#1,058 |
| 57. | Ravensworth | 36.3% | 15.6%(+20.7)#57 | 11.4%(+24.9)#1,060 |
| 58. | Lake Barcroft | 36.2% | 15.6%(+20.6)#58 | 11.4%(+24.8)#1,065 |
| 59. | Gainesville | 36.0% | 15.6%(+20.4)#59 | 11.4%(+24.6)#1,077 |
| 60. | Mount Sidney | 36.0% | 15.6%(+20.4)#60 | 11.4%(+24.6)#1,084 |
| 61. | Linton Hall | 35.9% | 15.6%(+20.3)#61 | 11.4%(+24.5)#1,088 |
| 62. | Kings Park West | 35.5% | 15.6%(+19.9)#62 | 11.4%(+24.1)#1,125 |
| 63. | Locust Mount | 35.4% | 15.6%(+19.8)#63 | 11.4%(+24.0)#1,144 |
| 64. | George Mason | 35.3% | 15.6%(+19.7)#64 | 11.4%(+23.9)#1,152 |
| 65. | Haymarket | 35.2% | 15.6%(+19.6)#65 | 11.4%(+23.8)#1,160 |
| 66. | Opal | 35.0% | 15.6%(+19.4)#66 | 11.4%(+23.6)#1,175 |
| 67. | Kings Park | 34.4% | 15.6%(+18.8)#67 | 11.4%(+23.0)#1,221 |
| 68. | Newington | 34.2% | 15.6%(+18.6)#68 | 11.4%(+22.8)#1,228 |
| 69. | Buckhall | 34.0% | 15.6%(+18.4)#69 | 11.4%(+22.6)#1,237 |
| 70. | Kingstowne | 33.8% | 15.6%(+18.2)#70 | 11.4%(+22.4)#1,266 |
| 71. | Chantilly | 33.4% | 15.6%(+17.8)#71 | 11.4%(+22.0)#1,292 |
| 72. | Ashburn | 33.3% | 15.6%(+17.7)#72 | 11.4%(+21.9)#1,303 |
| 73. | Burke Centre | 33.2% | 15.6%(+17.6)#73 | 11.4%(+21.8)#1,322 |
| 74. | Sugarland Run | 33.0% | 15.6%(+17.4)#74 | 11.4%(+21.6)#1,336 |
| 75. | Cascades | 33.0% | 15.6%(+17.4)#75 | 11.4%(+21.6)#1,337 |
| 76. | Bobtown | 33.0% | 15.6%(+17.4)#76 | 11.4%(+21.6)#1,343 |
| 77. | Waterford | 32.8% | 15.6%(+17.2)#77 | 11.4%(+21.4)#1,360 |
| 78. | Herndon | 32.7% | 15.6%(+17.1)#78 | 11.4%(+21.3)#1,361 |
| 79. | Saluda | 32.0% | 15.6%(+16.4)#79 | 11.4%(+20.6)#1,433 |
| 80. | Purcellville | 31.5% | 15.6%(+15.9)#80 | 11.4%(+20.1)#1,474 |
| 81. | Belle Haven | 31.2% | 15.6%(+15.6)#81 | 11.4%(+19.8)#1,501 |
| 82. | Arlington | 30.3% | 15.6%(+14.7)#82 | 11.4%(+18.9)#1,578 |
| 83. | West Springfield | 30.2% | 15.6%(+14.6)#83 | 11.4%(+18.8)#1,593 |
| 84. | Fairfax | 29.7% | 15.6%(+14.1)#84 | 11.4%(+18.3)#1,648 |
| 85. | Franconia | 29.6% | 15.6%(+14.0)#85 | 11.4%(+18.2)#1,655 |
| 86. | Centreville | 29.2% | 15.6%(+13.6)#86 | 11.4%(+17.8)#1,683 |
| 87. | Montclair | 28.9% | 15.6%(+13.3)#87 | 11.4%(+17.5)#1,718 |
| 88. | Ivy | 28.9% | 15.6%(+13.3)#88 | 11.4%(+17.5)#1,728 |
| 89. | Temperanceville | 28.9% | 15.6%(+13.3)#89 | 11.4%(+17.5)#1,729 |
| 90. | Reston | 28.5% | 15.6%(+12.9)#90 | 11.4%(+17.1)#1,765 |
| 91. | Aquia Harbour | 28.3% | 15.6%(+12.7)#91 | 11.4%(+16.9)#1,793 |
| 92. | Short Pump | 28.1% | 15.6%(+12.5)#92 | 11.4%(+16.7)#1,802 |
| 93. | Countryside | 27.8% | 15.6%(+12.2)#93 | 11.4%(+16.4)#1,840 |
| 94. | Earlysville | 27.8% | 15.6%(+12.2)#94 | 11.4%(+16.4)#1,847 |
| 95. | Woodburn | 27.2% | 15.6%(+11.6)#95 | 11.4%(+15.8)#1,912 |
| 96. | Greenbriar | 26.8% | 15.6%(+11.2)#96 | 11.4%(+15.4)#1,956 |
| 97. | Leesburg | 26.7% | 15.6%(+11.1)#97 | 11.4%(+15.3)#1,961 |
| 98. | Laurel Hill | 26.7% | 15.6%(+11.1)#98 | 11.4%(+15.3)#1,966 |
| 99. | Metompkin | 26.4% | 15.6%(+10.8)#99 | 11.4%(+15.0)#2,009 |
| 100. | Newington Forest | 26.3% | 15.6%(+10.7)#100 | 11.4%(+14.9)#2,015 |
Common Questions
What are the Top 10 Cities with the Highest Percentage of Households with Income Above $200,000 in Virginia?
Top 10 Cities with the Highest Percentage of Households with Income Above $200,000 in Virginia are:
#1
100.0%
#2
73.8%
#3
69.4%
#4
65.7%
#5
63.0%
#6
62.8%
#7
61.8%
#8
61.1%
#9
60.6%
#10
59.8%
What city has the Highest Percentage of Households with Income Above $200,000 in Virginia?
Palmyra has the Highest Percentage of Households with Income Above $200,000 in Virginia with 100.0%.
What is the Percentage of Households with Income Above $200,000 in the State of Virginia?
Percentage of Households with Income Above $200,000 in Virginia is 15.6%.
What is the Percentage of Households with Income Above $200,000 in the United States?
Percentage of Households with Income Above $200,000 in the United States is 11.4%.