Timber Cove, CA Map & Demographics
Timber Cove Map
Timber Cove Overview
$49,345
PER CAPITA INCOME
$77,500
AVG FAMILY INCOME
$87,500
AVG HOUSEHOLD INCOME
60.9%
WAGE / INCOME GAP [ % ]
39.1¢/ $1
WAGE / INCOME GAP [ $ ]
0.33
INEQUALITY / GINI INDEX
235
TOTAL POPULATION
130
MALE POPULATION
105
FEMALE POPULATION
123.81
MALES / 100 FEMALES
80.77
FEMALES / 100 MALES
54.6
MEDIAN AGE
2.7
AVG FAMILY SIZE
2.4
AVG HOUSEHOLD SIZE
122
LABOR FORCE [ PEOPLE ]
55.2%
PERCENT IN LABOR FORCE
4.9%
UNEMPLOYMENT RATE
Income in Timber Cove
Income Overview in Timber Cove
Per Capita Income in Timber Cove is $49,345, while median incomes of families and households are $77,500 and $87,500 respectively.
| Characteristic | Number | Measure |
| Per Capita Income | 235 | $49,345 |
| Median Family Income | 62 | $77,500 |
| Mean Family Income | 62 | $105,905 |
| Median Household Income | 98 | $87,500 |
| Mean Household Income | 98 | $116,944 |
| Income Deficit | 62 | $0 |
| Wage / Income Gap (%) | 235 | 60.91% |
| Wage / Income Gap ($) | 235 | 39.09¢ per $1 |
| Gini / Inequality Index | 235 | 0.33 |
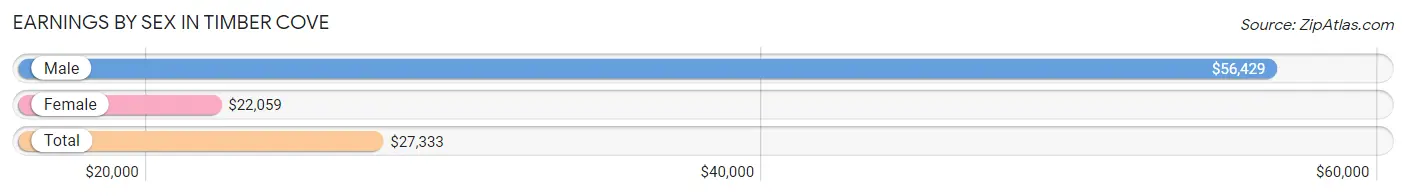
Earnings by Sex in Timber Cove
Average Earnings in Timber Cove are $27,333, $56,429 for men and $22,059 for women, a difference of 60.9%.
| Sex | Number | Average Earnings |
| Male | 64 (50.0%) | $56,429 |
| Female | 64 (50.0%) | $22,059 |
| Total | 128 (100.0%) | $27,333 |
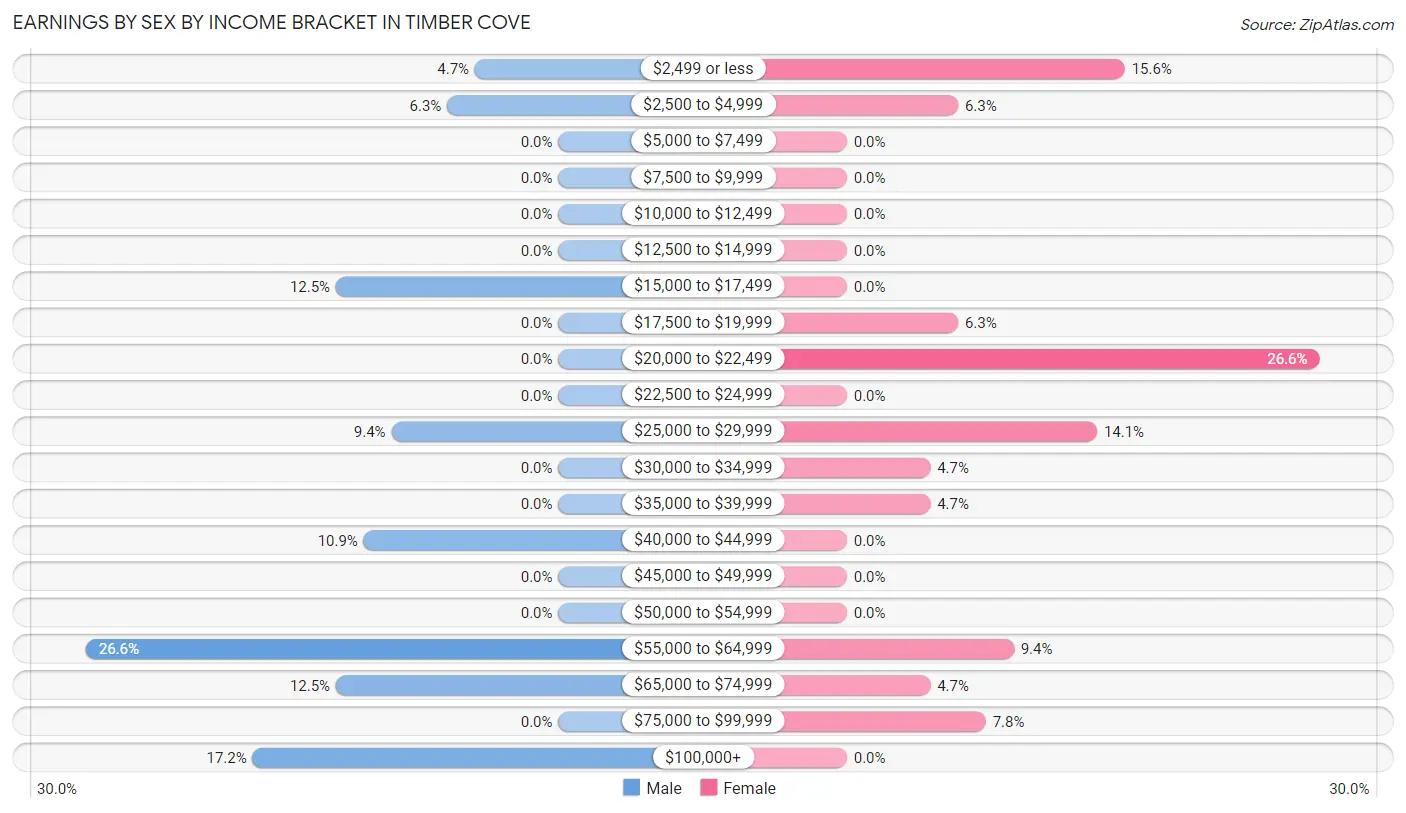
Earnings by Sex by Income Bracket in Timber Cove
The most common earnings brackets in Timber Cove are $55,000 to $64,999 for men (17 | 26.6%) and $20,000 to $22,499 for women (17 | 26.6%).
| Income | Male | Female |
| $2,499 or less | 3 (4.7%) | 10 (15.6%) |
| $2,500 to $4,999 | 4 (6.2%) | 4 (6.2%) |
| $5,000 to $7,499 | 0 (0.0%) | 0 (0.0%) |
| $7,500 to $9,999 | 0 (0.0%) | 0 (0.0%) |
| $10,000 to $12,499 | 0 (0.0%) | 0 (0.0%) |
| $12,500 to $14,999 | 0 (0.0%) | 0 (0.0%) |
| $15,000 to $17,499 | 8 (12.5%) | 0 (0.0%) |
| $17,500 to $19,999 | 0 (0.0%) | 4 (6.2%) |
| $20,000 to $22,499 | 0 (0.0%) | 17 (26.6%) |
| $22,500 to $24,999 | 0 (0.0%) | 0 (0.0%) |
| $25,000 to $29,999 | 6 (9.4%) | 9 (14.1%) |
| $30,000 to $34,999 | 0 (0.0%) | 3 (4.7%) |
| $35,000 to $39,999 | 0 (0.0%) | 3 (4.7%) |
| $40,000 to $44,999 | 7 (10.9%) | 0 (0.0%) |
| $45,000 to $49,999 | 0 (0.0%) | 0 (0.0%) |
| $50,000 to $54,999 | 0 (0.0%) | 0 (0.0%) |
| $55,000 to $64,999 | 17 (26.6%) | 6 (9.4%) |
| $65,000 to $74,999 | 8 (12.5%) | 3 (4.7%) |
| $75,000 to $99,999 | 0 (0.0%) | 5 (7.8%) |
| $100,000+ | 11 (17.2%) | 0 (0.0%) |
| Total | 64 (100.0%) | 64 (100.0%) |
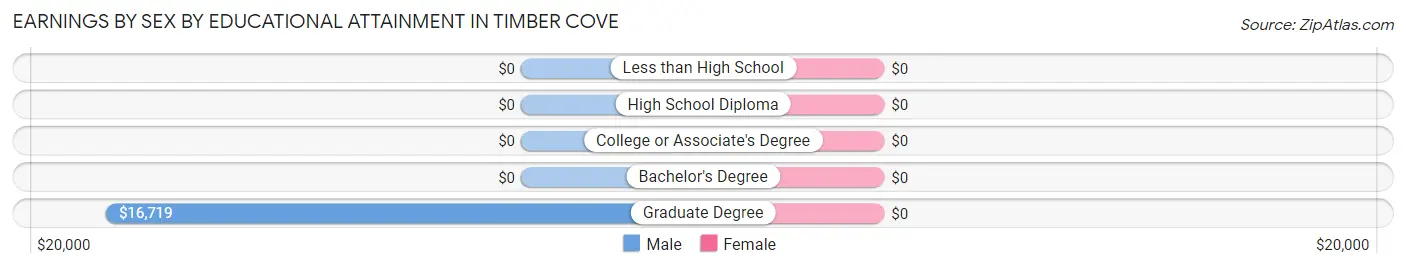
Earnings by Sex by Educational Attainment in Timber Cove
| Educational Attainment | Male Income | Female Income |
| Less than High School | - | - |
| High School Diploma | - | - |
| College or Associate's Degree | - | - |
| Bachelor's Degree | - | - |
| Graduate Degree | $16,719 | $0 |
| Total | $57,143 | $26,111 |
Family Income in Timber Cove
Family Income Brackets in Timber Cove
According to the Timber Cove family income data, there are 20 families falling into the $50,000 to $74,999 income range, which is the most common income bracket and makes up 32.3% of all families.
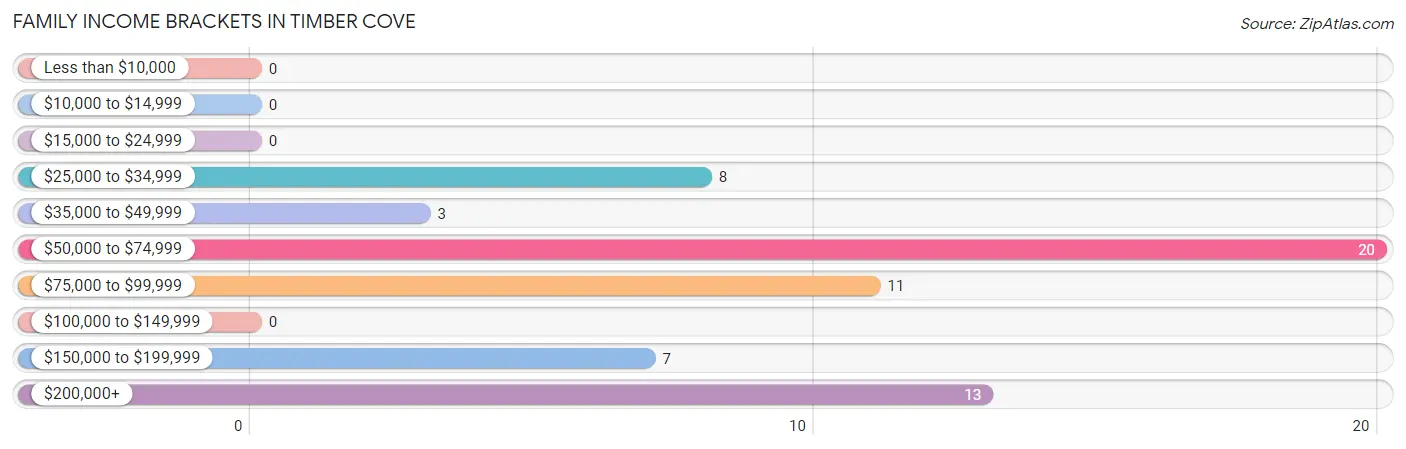
| Income Bracket | # Families | % Families |
| Less than $10,000 | 0 | 0.0% |
| $10,000 to $14,999 | 0 | 0.0% |
| $15,000 to $24,999 | 0 | 0.0% |
| $25,000 to $34,999 | 8 | 12.9% |
| $35,000 to $49,999 | 3 | 4.8% |
| $50,000 to $74,999 | 20 | 32.3% |
| $75,000 to $99,999 | 11 | 17.7% |
| $100,000 to $149,999 | 0 | 0.0% |
| $150,000 to $199,999 | 7 | 11.3% |
| $200,000+ | 13 | 21.0% |
Family Income by Famaliy Size in Timber Cove
2-person families (39 | 62.9%) account for the highest median family income in Timber Cove with $64,583 per family, while 2-person families (39 | 62.9%) have the highest median income of $32,292 per family member.
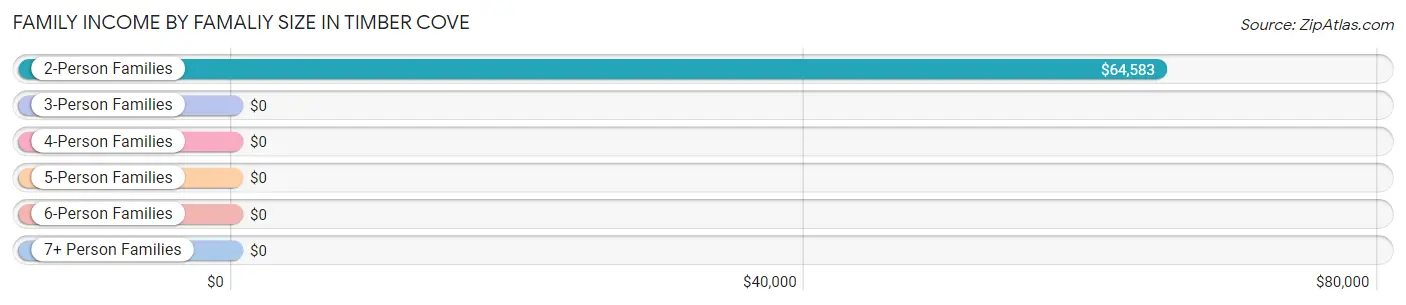
| Income Bracket | # Families | Median Income |
| 2-Person Families | 39 (62.9%) | $64,583 |
| 3-Person Families | 8 (12.9%) | $0 |
| 4-Person Families | 15 (24.2%) | $0 |
| 5-Person Families | 0 (0.0%) | $0 |
| 6-Person Families | 0 (0.0%) | $0 |
| 7+ Person Families | 0 (0.0%) | $0 |
| Total | 62 (100.0%) | $77,500 |
Family Income by Number of Earners in Timber Cove
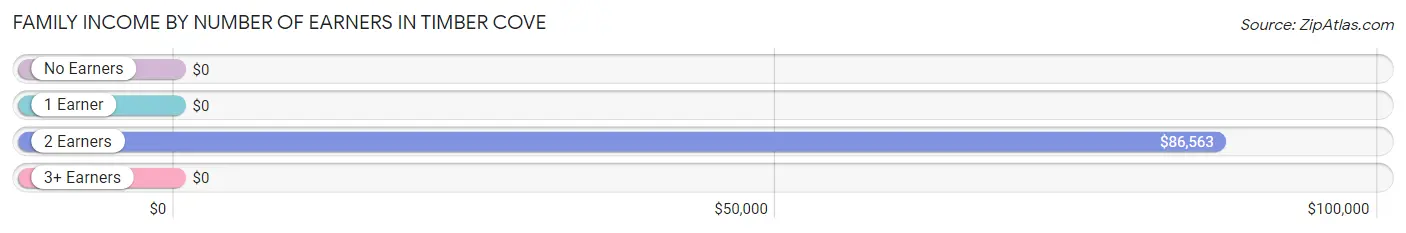
| Number of Earners | # Families | Median Income |
| No Earners | 20 (32.3%) | $0 |
| 1 Earner | 20 (32.3%) | $0 |
| 2 Earners | 22 (35.5%) | $86,563 |
| 3+ Earners | 0 (0.0%) | $0 |
| Total | 62 (100.0%) | $77,500 |
Household Income in Timber Cove
Household Income Brackets in Timber Cove
With 29 households falling in the category, the $50,000 to $74,999 income range is the most frequent in Timber Cove, accounting for 29.6% of all households.
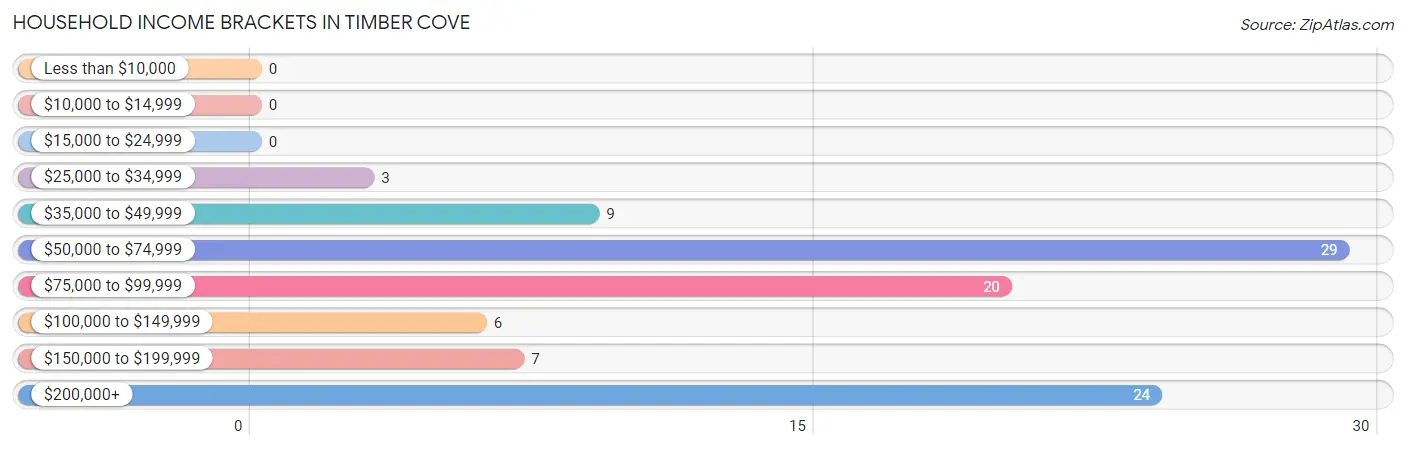
| Income Bracket | # Households | % Households |
| Less than $10,000 | 0 | 0.0% |
| $10,000 to $14,999 | 0 | 0.0% |
| $15,000 to $24,999 | 0 | 0.0% |
| $25,000 to $34,999 | 3 | 3.1% |
| $35,000 to $49,999 | 9 | 9.2% |
| $50,000 to $74,999 | 29 | 29.6% |
| $75,000 to $99,999 | 20 | 20.4% |
| $100,000 to $149,999 | 6 | 6.1% |
| $150,000 to $199,999 | 7 | 7.1% |
| $200,000+ | 24 | 24.5% |
Household Income by Householder Age in Timber Cove
The median household income in Timber Cove is $87,500, with the highest median household income of $89,688 found in the 65+ years age bracket for the primary householder. A total of 39 households (39.8%) fall into this category.
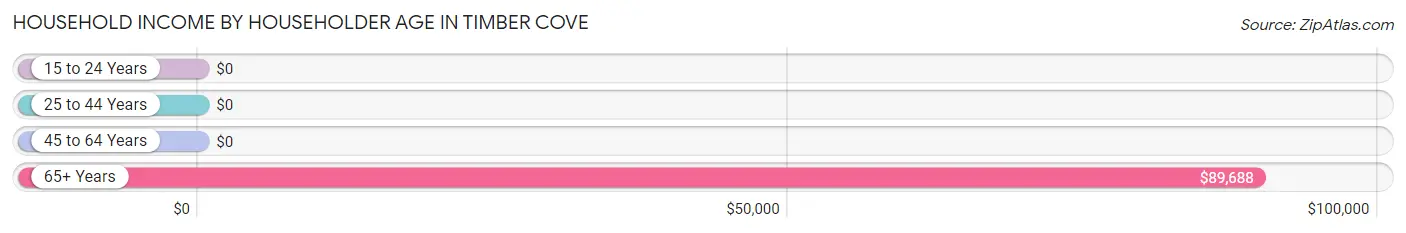
| Income Bracket | # Households | Median Income |
| 15 to 24 Years | 0 (0.0%) | $0 |
| 25 to 44 Years | 5 (5.1%) | $0 |
| 45 to 64 Years | 54 (55.1%) | $0 |
| 65+ Years | 39 (39.8%) | $89,688 |
| Total | 98 (100.0%) | $87,500 |
Poverty in Timber Cove
Income Below Poverty by Sex and Age in Timber Cove
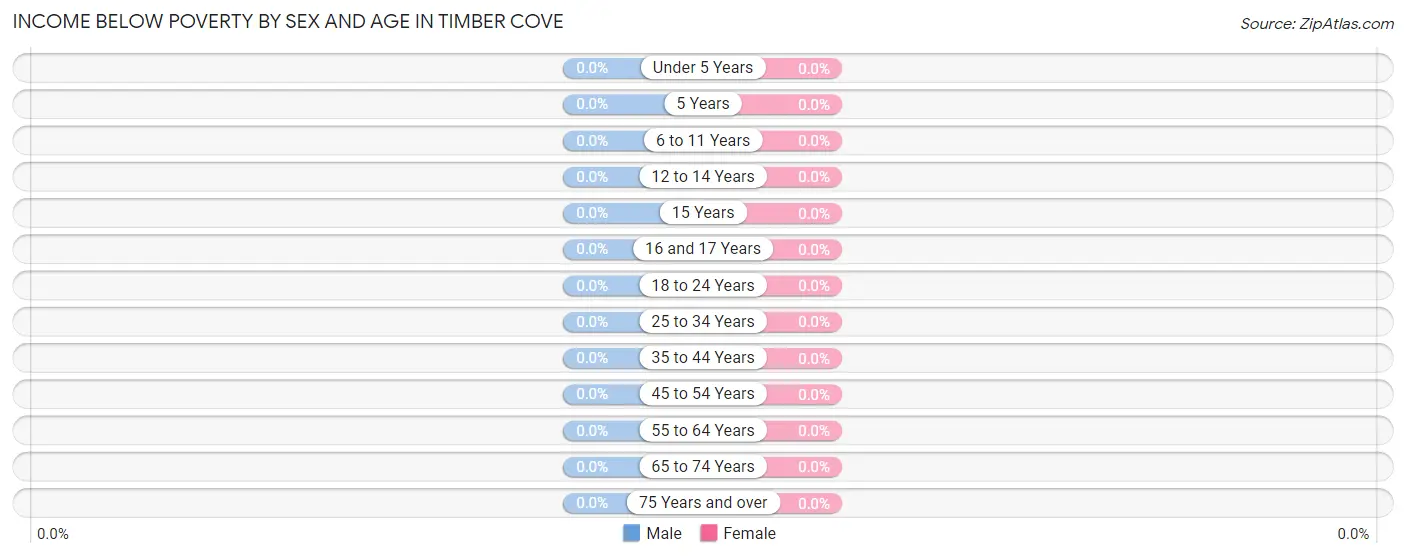
| Age Bracket | Male | Female |
| Under 5 Years | 0 (0.0%) | 0 (0.0%) |
| 5 Years | 0 (0.0%) | 0 (0.0%) |
| 6 to 11 Years | 0 (0.0%) | 0 (0.0%) |
| 12 to 14 Years | 0 (0.0%) | 0 (0.0%) |
| 15 Years | 0 (0.0%) | 0 (0.0%) |
| 16 and 17 Years | 0 (0.0%) | 0 (0.0%) |
| 18 to 24 Years | 0 (0.0%) | 0 (0.0%) |
| 25 to 34 Years | 0 (0.0%) | 0 (0.0%) |
| 35 to 44 Years | 0 (0.0%) | 0 (0.0%) |
| 45 to 54 Years | 0 (0.0%) | 0 (0.0%) |
| 55 to 64 Years | 0 (0.0%) | 0 (0.0%) |
| 65 to 74 Years | 0 (0.0%) | 0 (0.0%) |
| 75 Years and over | 0 (0.0%) | 0 (0.0%) |
| Total | 0 (0.0%) | 0 (0.0%) |
Income Above Poverty by Sex and Age in Timber Cove
According to the poverty statistics in Timber Cove, males aged under 5 years and females aged 18 to 24 years are the age groups that are most secure financially, with 100.0% of males and 100.0% of females in these age groups living above the poverty line.
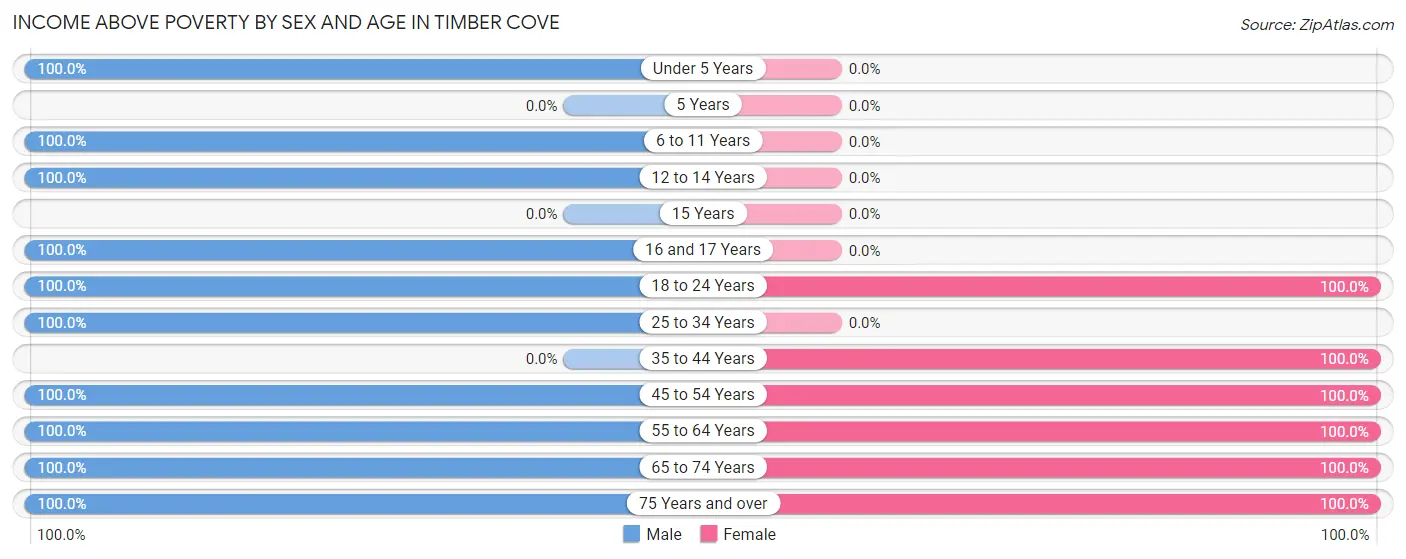
| Age Bracket | Male | Female |
| Under 5 Years | 4 (100.0%) | 0 (0.0%) |
| 5 Years | 0 (0.0%) | 0 (0.0%) |
| 6 to 11 Years | 3 (100.0%) | 0 (0.0%) |
| 12 to 14 Years | 7 (100.0%) | 0 (0.0%) |
| 15 Years | 0 (0.0%) | 0 (0.0%) |
| 16 and 17 Years | 8 (100.0%) | 0 (0.0%) |
| 18 to 24 Years | 4 (100.0%) | 17 (100.0%) |
| 25 to 34 Years | 13 (100.0%) | 0 (0.0%) |
| 35 to 44 Years | 0 (0.0%) | 21 (100.0%) |
| 45 to 54 Years | 38 (100.0%) | 11 (100.0%) |
| 55 to 64 Years | 13 (100.0%) | 19 (100.0%) |
| 65 to 74 Years | 21 (100.0%) | 23 (100.0%) |
| 75 Years and over | 19 (100.0%) | 14 (100.0%) |
| Total | 130 (100.0%) | 105 (100.0%) |
Income Below Poverty Among Married-Couple Families in Timber Cove
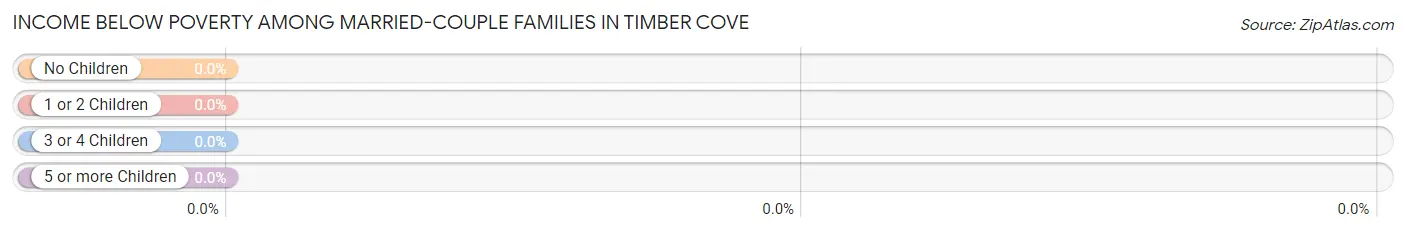
| Children | Above Poverty | Below Poverty |
| No Children | 32 (100.0%) | 0 (0.0%) |
| 1 or 2 Children | 11 (100.0%) | 0 (0.0%) |
| 3 or 4 Children | 0 (0.0%) | 0 (0.0%) |
| 5 or more Children | 0 (0.0%) | 0 (0.0%) |
| Total | 43 (100.0%) | 0 (0.0%) |
Income Below Poverty Among Single-Parent Households in Timber Cove
| Children | Single Father | Single Mother |
| No Children | 0 (0.0%) | 0 (0.0%) |
| 1 or 2 Children | 0 (0.0%) | 0 (0.0%) |
| 3 or 4 Children | 0 (0.0%) | 0 (0.0%) |
| 5 or more Children | 0 (0.0%) | 0 (0.0%) |
| Total | 0 (0.0%) | 0 (0.0%) |
Income Below Poverty Among Married-Couple vs Single-Parent Households in Timber Cove
| Children | Married-Couple Families | Single-Parent Households |
| No Children | 0 (0.0%) | 0 (0.0%) |
| 1 or 2 Children | 0 (0.0%) | 0 (0.0%) |
| 3 or 4 Children | 0 (0.0%) | 0 (0.0%) |
| 5 or more Children | 0 (0.0%) | 0 (0.0%) |
| Total | 0 (0.0%) | 0 (0.0%) |
Race in Timber Cove
The most populous races in Timber Cove are White / Caucasian (164 | 69.8%), Hispanic or Latino (68 | 28.9%), and Two or more Races (38 | 16.2%).
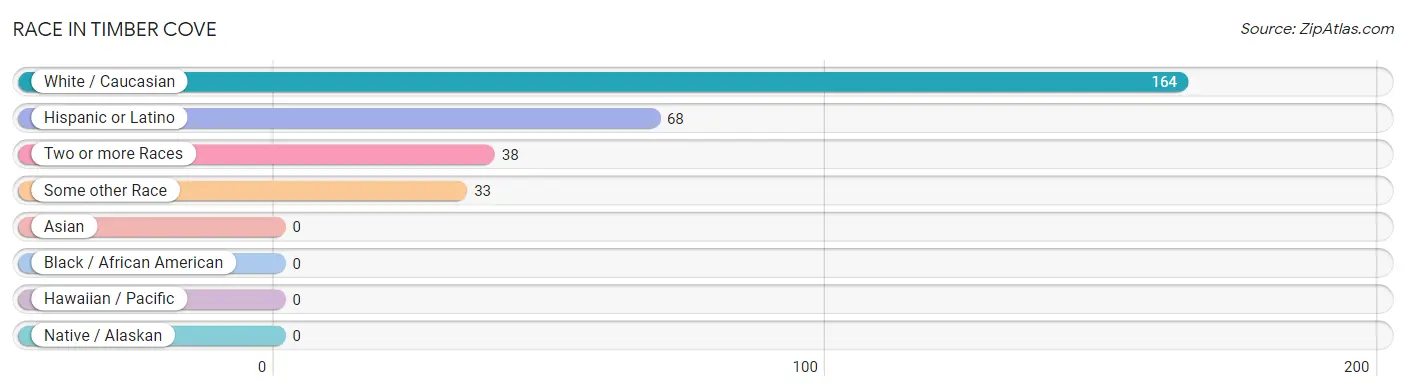
| Race | # Population | % Population |
| Asian | 0 | 0.0% |
| Black / African American | 0 | 0.0% |
| Hawaiian / Pacific | 0 | 0.0% |
| Hispanic or Latino | 68 | 28.9% |
| Native / Alaskan | 0 | 0.0% |
| White / Caucasian | 164 | 69.8% |
| Two or more Races | 38 | 16.2% |
| Some other Race | 33 | 14.0% |
| Total | 235 | 100.0% |
Ancestry in Timber Cove
The most populous ancestries reported in Timber Cove are English (69 | 29.4%), Mexican (68 | 28.9%), German (45 | 19.2%), Irish (34 | 14.5%), and Lithuanian (12 | 5.1%), together accounting for 97.0% of all Timber Cove residents.
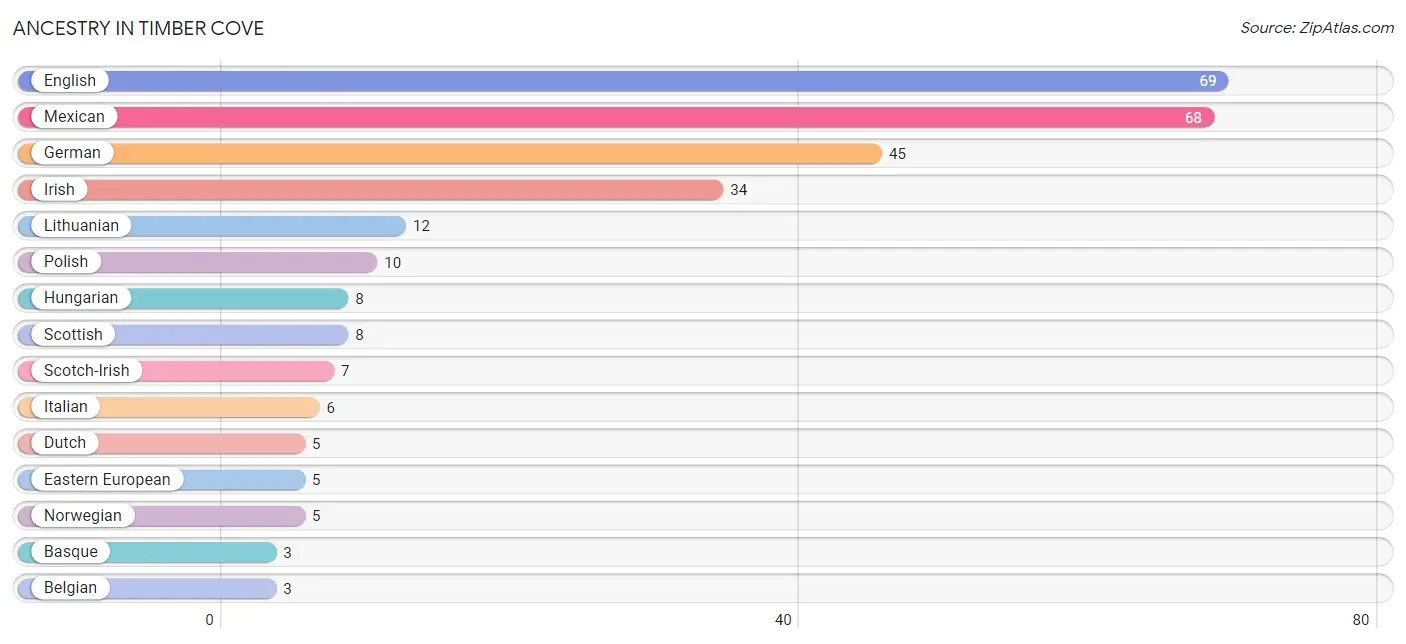
| Ancestry | # Population | % Population |
| Basque | 3 | 1.3% |
| Belgian | 3 | 1.3% |
| Dutch | 5 | 2.1% |
| Eastern European | 5 | 2.1% |
| English | 69 | 29.4% |
| French | 3 | 1.3% |
| German | 45 | 19.2% |
| Hungarian | 8 | 3.4% |
| Irish | 34 | 14.5% |
| Italian | 6 | 2.5% |
| Lithuanian | 12 | 5.1% |
| Mexican | 68 | 28.9% |
| Norwegian | 5 | 2.1% |
| Polish | 10 | 4.3% |
| Scotch-Irish | 7 | 3.0% |
| Scottish | 8 | 3.4% | View All 16 Rows |
Immigrants in Timber Cove
The most numerous immigrant groups reported in Timber Cove came from Central America (42 | 17.9%), Latin America (42 | 17.9%), Mexico (42 | 17.9%), Australia (5 | 2.1%), and Oceania (5 | 2.1%), together accounting for 57.9% of all Timber Cove residents.
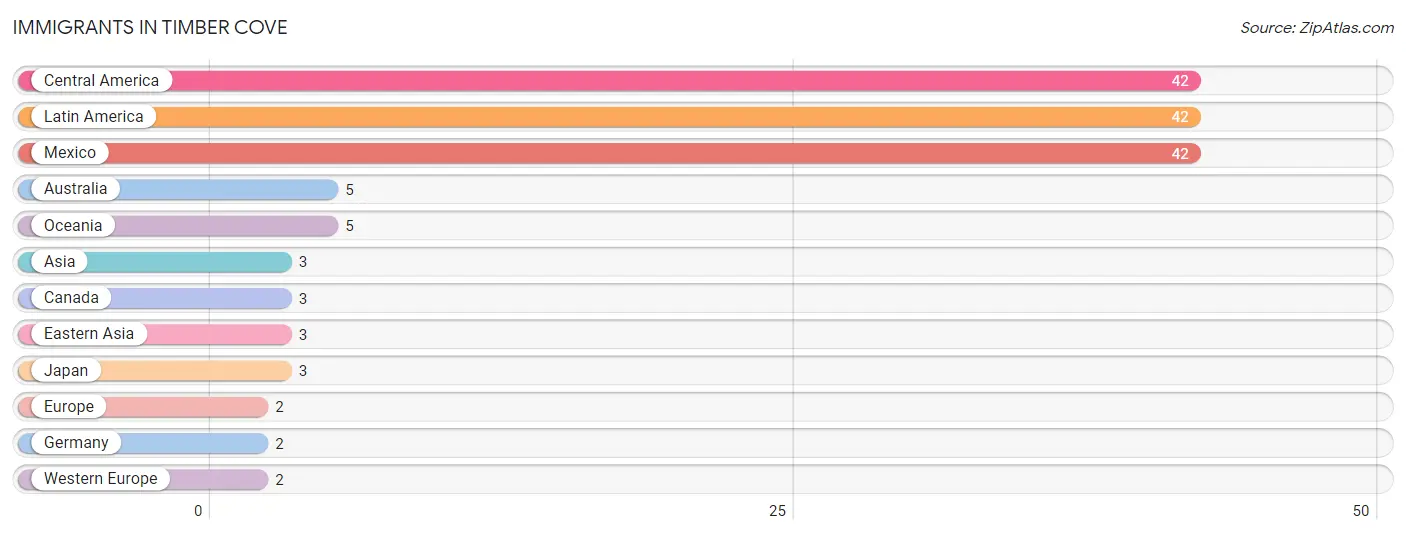
| Immigration Origin | # Population | % Population |
| Asia | 3 | 1.3% |
| Australia | 5 | 2.1% |
| Canada | 3 | 1.3% |
| Central America | 42 | 17.9% |
| Eastern Asia | 3 | 1.3% |
| Europe | 2 | 0.9% |
| Germany | 2 | 0.9% |
| Japan | 3 | 1.3% |
| Latin America | 42 | 17.9% |
| Mexico | 42 | 17.9% |
| Oceania | 5 | 2.1% |
| Western Europe | 2 | 0.9% | View All 12 Rows |
Sex and Age in Timber Cove
Sex and Age in Timber Cove
The most populous age groups in Timber Cove are 50 to 54 Years (35 | 26.9%) for men and 70 to 74 Years (17 | 16.2%) for women.
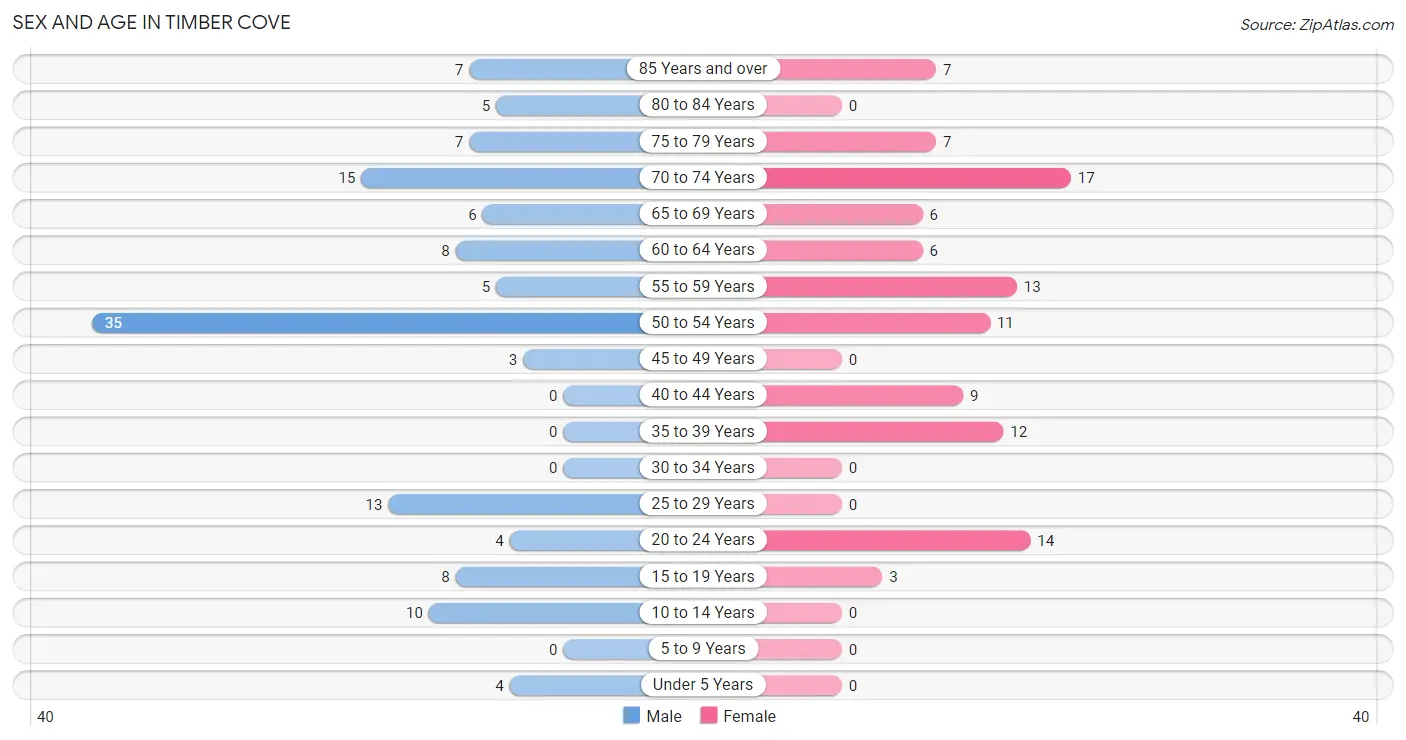
| Age Bracket | Male | Female |
| Under 5 Years | 4 (3.1%) | 0 (0.0%) |
| 5 to 9 Years | 0 (0.0%) | 0 (0.0%) |
| 10 to 14 Years | 10 (7.7%) | 0 (0.0%) |
| 15 to 19 Years | 8 (6.1%) | 3 (2.9%) |
| 20 to 24 Years | 4 (3.1%) | 14 (13.3%) |
| 25 to 29 Years | 13 (10.0%) | 0 (0.0%) |
| 30 to 34 Years | 0 (0.0%) | 0 (0.0%) |
| 35 to 39 Years | 0 (0.0%) | 12 (11.4%) |
| 40 to 44 Years | 0 (0.0%) | 9 (8.6%) |
| 45 to 49 Years | 3 (2.3%) | 0 (0.0%) |
| 50 to 54 Years | 35 (26.9%) | 11 (10.5%) |
| 55 to 59 Years | 5 (3.8%) | 13 (12.4%) |
| 60 to 64 Years | 8 (6.1%) | 6 (5.7%) |
| 65 to 69 Years | 6 (4.6%) | 6 (5.7%) |
| 70 to 74 Years | 15 (11.5%) | 17 (16.2%) |
| 75 to 79 Years | 7 (5.4%) | 7 (6.7%) |
| 80 to 84 Years | 5 (3.8%) | 0 (0.0%) |
| 85 Years and over | 7 (5.4%) | 7 (6.7%) |
| Total | 130 (100.0%) | 105 (100.0%) |
Families and Households in Timber Cove
Median Family Size in Timber Cove
The median family size in Timber Cove is 2.66 persons per family, with single female/mother families (3 | 4.8%) accounting for the largest median family size of 3.67 persons per family. On the other hand, single male/father families (16 | 25.8%) represent the smallest median family size with 2.00 persons per family.
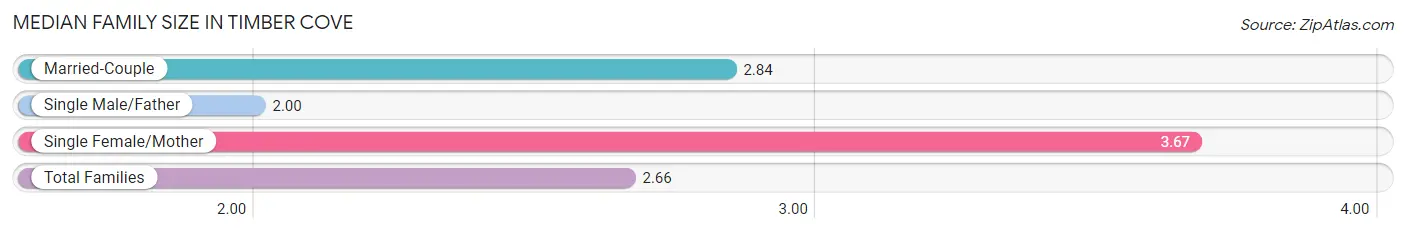
| Family Type | # Families | Family Size |
| Married-Couple | 43 (69.4%) | 2.84 |
| Single Male/Father | 16 (25.8%) | 2.00 |
| Single Female/Mother | 3 (4.8%) | 3.67 |
| Total Families | 62 (100.0%) | 2.66 |
Median Household Size in Timber Cove
The median household size in Timber Cove is 2.40 persons per household, with single female/mother households (3 | 3.1%) accounting for the largest median household size of 4.67 persons per household. non-family households (36 | 36.7%) represent the smallest median household size with 1.31 persons per household.
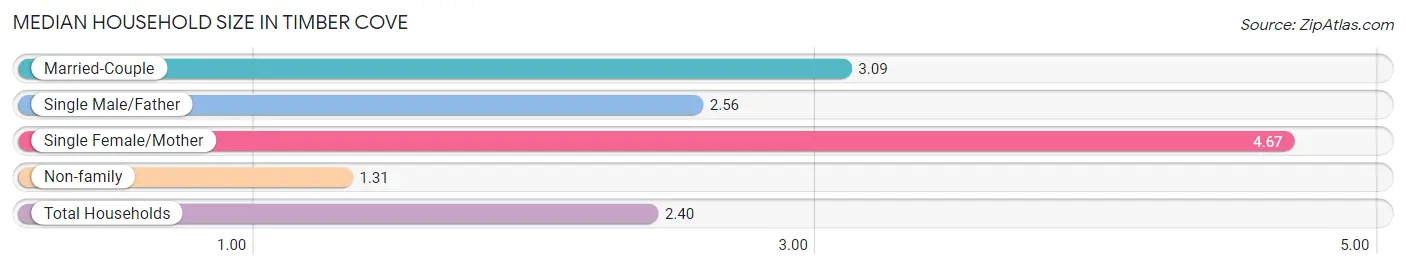
| Household Type | # Households | Household Size |
| Married-Couple | 43 (43.9%) | 3.09 |
| Single Male/Father | 16 (16.3%) | 2.56 |
| Single Female/Mother | 3 (3.1%) | 4.67 |
| Non-family | 36 (36.7%) | 1.31 |
| Total Households | 98 (100.0%) | 2.40 |
Household Size by Marriage Status in Timber Cove
Out of a total of 98 households in Timber Cove, 62 (63.3%) are family households, while 36 (36.7%) are nonfamily households. The most numerous type of family households are 2-person households, comprising 31, and the most common type of nonfamily households are 1-person households, comprising 25.
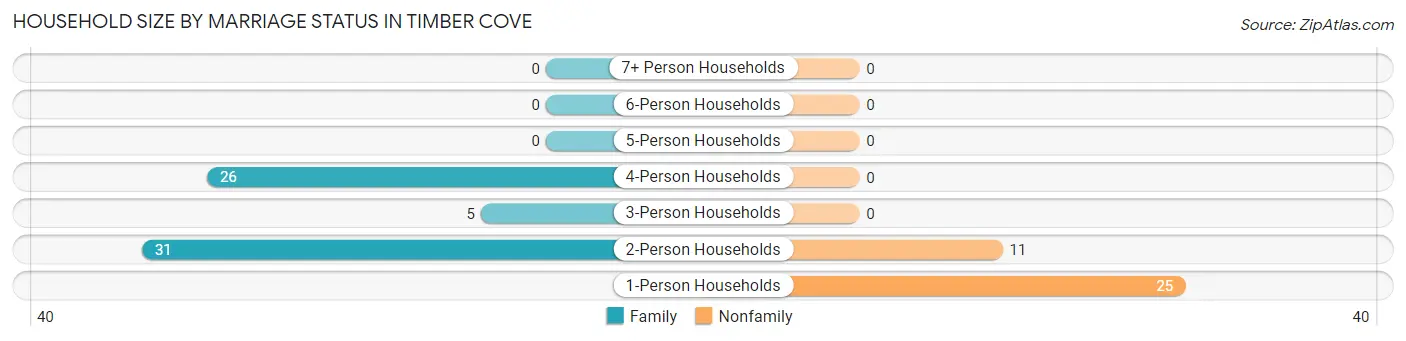
| Household Size | Family Households | Nonfamily Households |
| 1-Person Households | - | 25 (25.5%) |
| 2-Person Households | 31 (31.6%) | 11 (11.2%) |
| 3-Person Households | 5 (5.1%) | 0 (0.0%) |
| 4-Person Households | 26 (26.5%) | 0 (0.0%) |
| 5-Person Households | 0 (0.0%) | 0 (0.0%) |
| 6-Person Households | 0 (0.0%) | 0 (0.0%) |
| 7+ Person Households | 0 (0.0%) | 0 (0.0%) |
| Total | 62 (63.3%) | 36 (36.7%) |
Female Fertility in Timber Cove
Fertility by Age in Timber Cove
| Age Bracket | Women with Births | Births / 1,000 Women |
| 15 to 19 years | 0 (0.0%) | 0.0 |
| 20 to 34 years | 0 (0.0%) | 0.0 |
| 35 to 50 years | 0 (0.0%) | 0.0 |
| Total | 0 (0.0%) | 0.0 |
Fertility by Age by Marriage Status in Timber Cove
| Age Bracket | Married | Unmarried |
| 15 to 19 years | 0 (0.0%) | 0 (0.0%) |
| 20 to 34 years | 0 (0.0%) | 0 (0.0%) |
| 35 to 50 years | 0 (0.0%) | 0 (0.0%) |
| Total | 0 (0.0%) | 0 (0.0%) |
Fertility by Education in Timber Cove
| Educational Attainment | Women with Births | Births / 1,000 Women |
| Less than High School | 0 (0.0%) | 0.0 |
| High School Diploma | 0 (0.0%) | 0.0 |
| College or Associate's Degree | 0 (0.0%) | 0.0 |
| Bachelor's Degree | 0 (0.0%) | 0.0 |
| Graduate Degree | 0 (0.0%) | 0.0 |
| Total | 0 (0.0%) | 0.0 |
Fertility by Education by Marriage Status in Timber Cove
| Educational Attainment | Married | Unmarried |
| Less than High School | 0 (0.0%) | 0 (0.0%) |
| High School Diploma | 0 (0.0%) | 0 (0.0%) |
| College or Associate's Degree | 0 (0.0%) | 0 (0.0%) |
| Bachelor's Degree | 0 (0.0%) | 0 (0.0%) |
| Graduate Degree | 0 (0.0%) | 0 (0.0%) |
| Total | 0 (0.0%) | 0 (0.0%) |
Employment Characteristics in Timber Cove
Employment by Class of Employer in Timber Cove
Among the 113 employed individuals in Timber Cove, private company employees (65 | 57.5%), self-employed (not incorporated) (20 | 17.7%), and not-for-profit organizations (8 | 7.1%) make up the most common classes of employment.
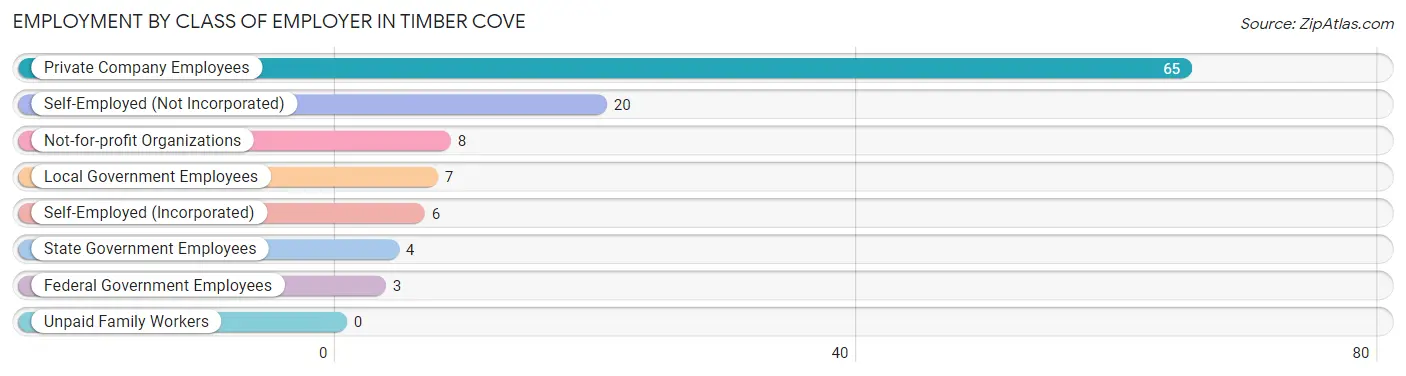
| Employer Class | # Employees | % Employees |
| Private Company Employees | 65 | 57.5% |
| Self-Employed (Incorporated) | 6 | 5.3% |
| Self-Employed (Not Incorporated) | 20 | 17.7% |
| Not-for-profit Organizations | 8 | 7.1% |
| Local Government Employees | 7 | 6.2% |
| State Government Employees | 4 | 3.5% |
| Federal Government Employees | 3 | 2.6% |
| Unpaid Family Workers | 0 | 0.0% |
| Total | 113 | 100.0% |
Employment Status by Age in Timber Cove
According to the labor force statistics for Timber Cove, out of the total population over 16 years of age (221), 55.2% or 122 individuals are in the labor force, with 4.9% or 6 of them unemployed. The age group with the highest labor force participation rate is 20 to 24 years, with 100.0% or 18 individuals in the labor force. Within the labor force, the 16 to 19 years age range has the highest percentage of unemployed individuals, with 100.0% or 3 of them being unemployed.
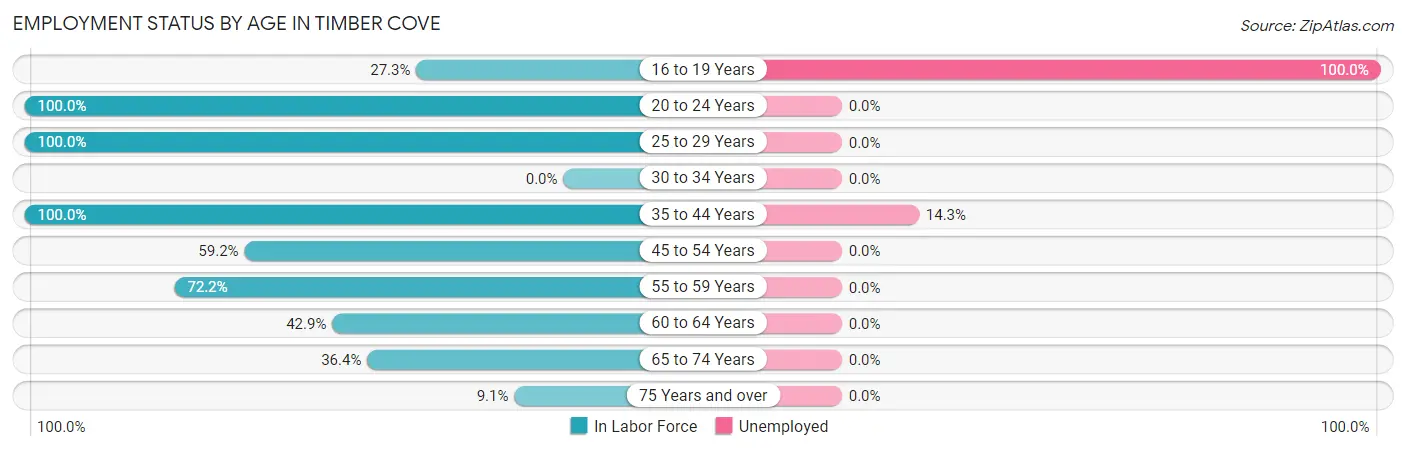
| Age Bracket | In Labor Force | Unemployed |
| 16 to 19 Years | 3 (27.3%) | 3 (100.0%) |
| 20 to 24 Years | 18 (100.0%) | 0 (0.0%) |
| 25 to 29 Years | 13 (100.0%) | 0 (0.0%) |
| 30 to 34 Years | 0 (0.0%) | 0 (0.0%) |
| 35 to 44 Years | 21 (100.0%) | 3 (14.3%) |
| 45 to 54 Years | 29 (59.2%) | 0 (0.0%) |
| 55 to 59 Years | 13 (72.2%) | 0 (0.0%) |
| 60 to 64 Years | 6 (42.9%) | 0 (0.0%) |
| 65 to 74 Years | 16 (36.4%) | 0 (0.0%) |
| 75 Years and over | 3 (9.1%) | 0 (0.0%) |
| Total | 122 (55.2%) | 6 (4.9%) |
Employment Status by Educational Attainment in Timber Cove
According to labor force statistics for Timber Cove, 71.3% of individuals (82) out of the total population between 25 and 64 years of age (115) are in the labor force, with 3.7% or 3 of them being unemployed. The group with the highest labor force participation rate are those with the educational attainment of high school diploma, with 100.0% or 37 individuals in the labor force. Within the labor force, individuals with college / associate degree education have the highest percentage of unemployment, with 50.0% or 3 of them being unemployed.
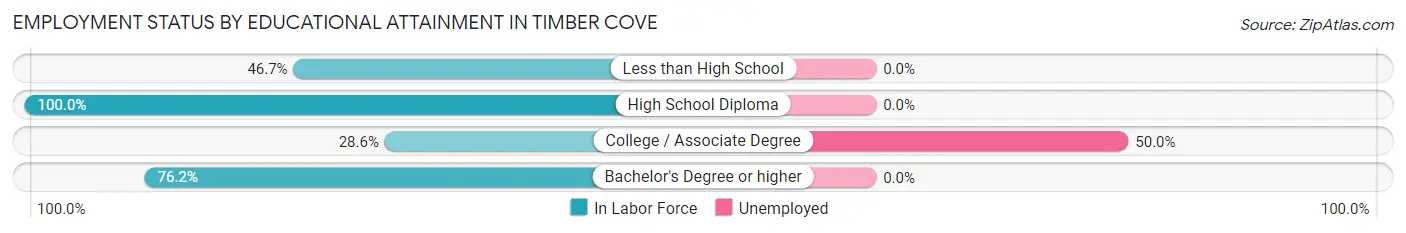
| Educational Attainment | In Labor Force | Unemployed |
| Less than High School | 7 (46.7%) | 0 (0.0%) |
| High School Diploma | 37 (100.0%) | 0 (0.0%) |
| College / Associate Degree | 6 (28.6%) | 10 (50.0%) |
| Bachelor's Degree or higher | 32 (76.2%) | 0 (0.0%) |
| Total | 82 (71.3%) | 4 (3.7%) |
Employment Occupations by Sex in Timber Cove
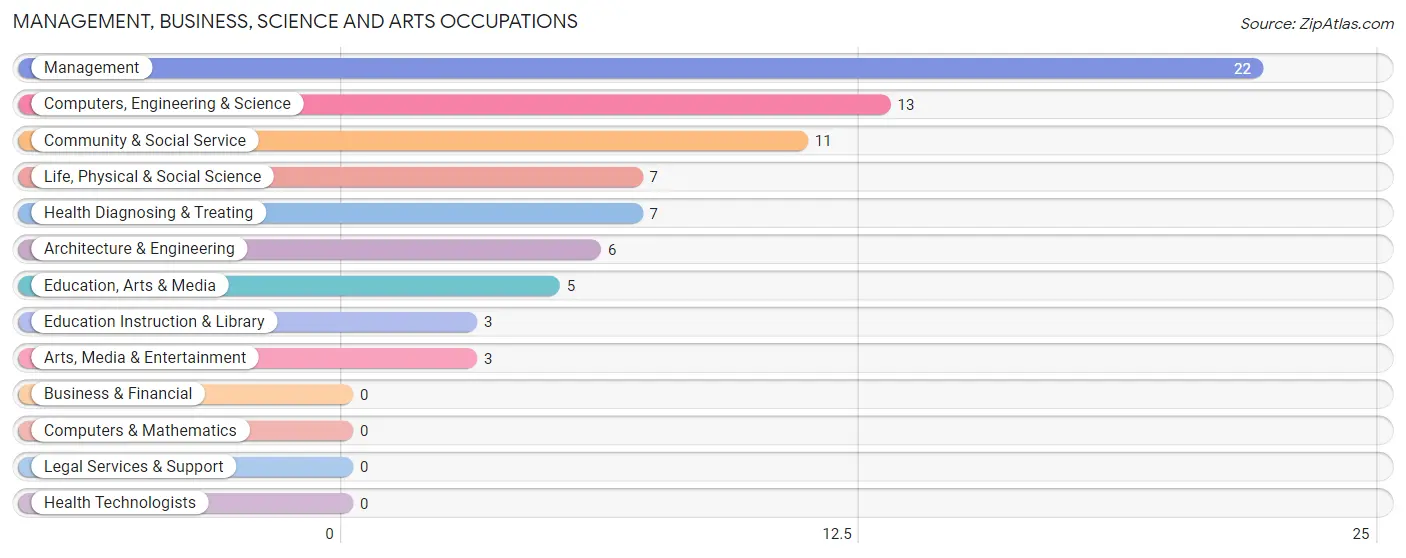
Management, Business, Science and Arts Occupations
The most common Management, Business, Science and Arts occupations in Timber Cove are Management (22 | 19.0%), Computers, Engineering & Science (13 | 11.2%), Community & Social Service (11 | 9.5%), Life, Physical & Social Science (7 | 6.0%), and Health Diagnosing & Treating (7 | 6.0%).
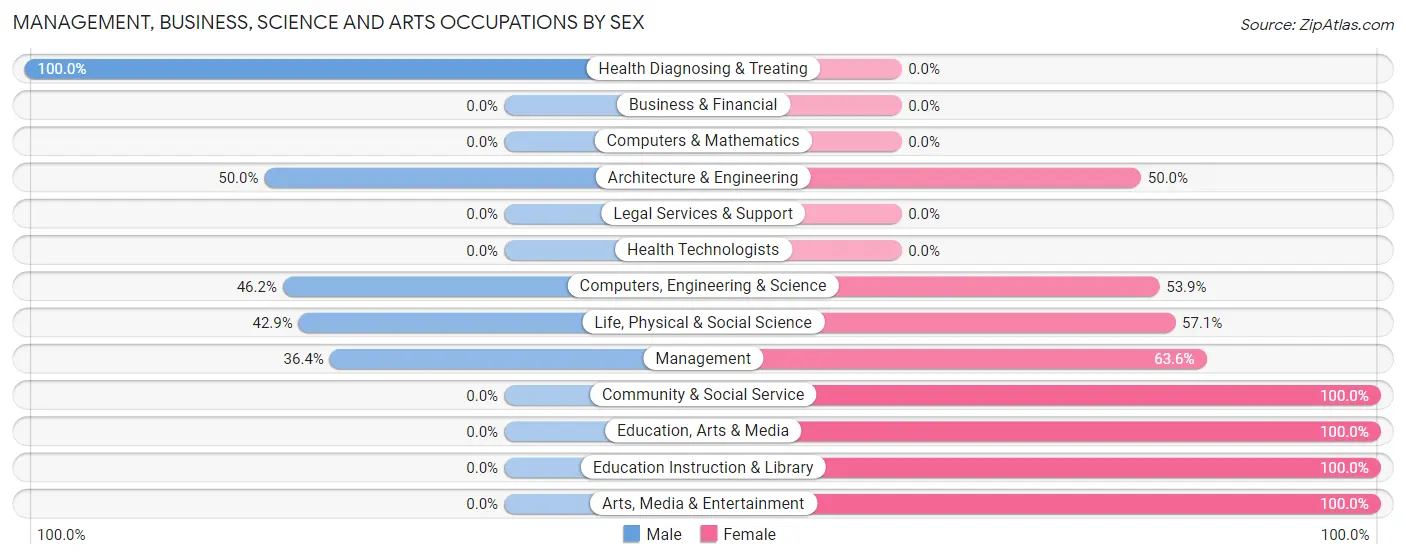
Management, Business, Science and Arts Occupations by Sex
Within the Management, Business, Science and Arts occupations in Timber Cove, the most male-oriented occupations are Health Diagnosing & Treating (100.0%), Architecture & Engineering (50.0%), and Computers, Engineering & Science (46.2%), while the most female-oriented occupations are Community & Social Service (100.0%), Education, Arts & Media (100.0%), and Education Instruction & Library (100.0%).
| Occupation | Male | Female |
| Management | 8 (36.4%) | 14 (63.6%) |
| Business & Financial | 0 (0.0%) | 0 (0.0%) |
| Computers, Engineering & Science | 6 (46.2%) | 7 (53.8%) |
| Computers & Mathematics | 0 (0.0%) | 0 (0.0%) |
| Architecture & Engineering | 3 (50.0%) | 3 (50.0%) |
| Life, Physical & Social Science | 3 (42.9%) | 4 (57.1%) |
| Community & Social Service | 0 (0.0%) | 11 (100.0%) |
| Education, Arts & Media | 0 (0.0%) | 5 (100.0%) |
| Legal Services & Support | 0 (0.0%) | 0 (0.0%) |
| Education Instruction & Library | 0 (0.0%) | 3 (100.0%) |
| Arts, Media & Entertainment | 0 (0.0%) | 3 (100.0%) |
| Health Diagnosing & Treating | 7 (100.0%) | 0 (0.0%) |
| Health Technologists | 0 (0.0%) | 0 (0.0%) |
| Total (Category) | 21 (39.6%) | 32 (60.4%) |
| Total (Overall) | 64 (55.2%) | 52 (44.8%) |
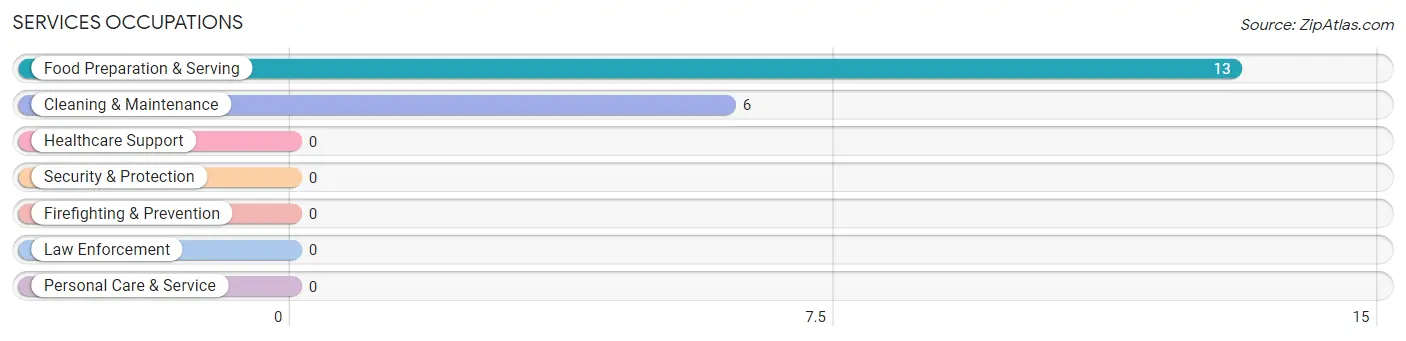
Services Occupations
The most common Services occupations in Timber Cove are Food Preparation & Serving (13 | 11.2%), and Cleaning & Maintenance (6 | 5.2%).
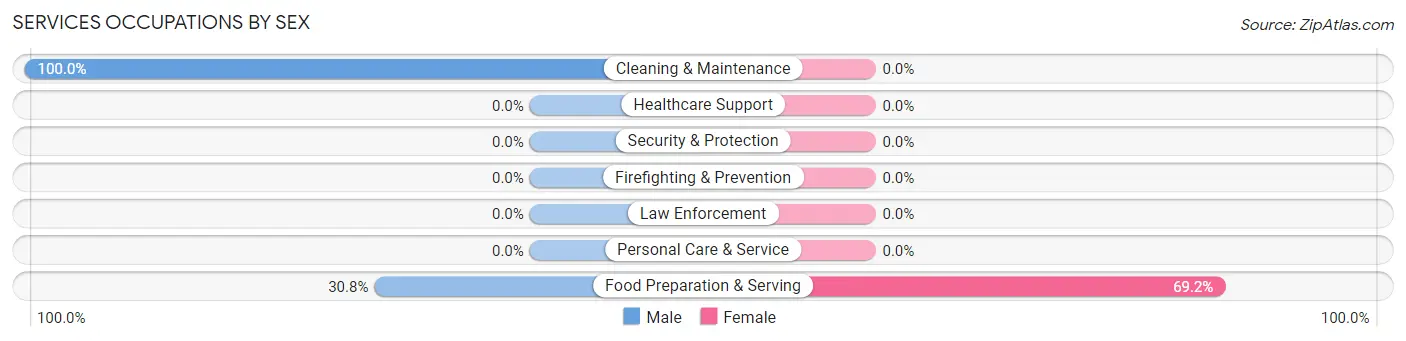
Services Occupations by Sex
| Occupation | Male | Female |
| Healthcare Support | 0 (0.0%) | 0 (0.0%) |
| Security & Protection | 0 (0.0%) | 0 (0.0%) |
| Firefighting & Prevention | 0 (0.0%) | 0 (0.0%) |
| Law Enforcement | 0 (0.0%) | 0 (0.0%) |
| Food Preparation & Serving | 4 (30.8%) | 9 (69.2%) |
| Cleaning & Maintenance | 6 (100.0%) | 0 (0.0%) |
| Personal Care & Service | 0 (0.0%) | 0 (0.0%) |
| Total (Category) | 10 (52.6%) | 9 (47.4%) |
| Total (Overall) | 64 (55.2%) | 52 (44.8%) |
Sales and Office Occupations
The most common Sales and Office occupations in Timber Cove are Office & Administration (8 | 6.9%), and Sales & Related (6 | 5.2%).
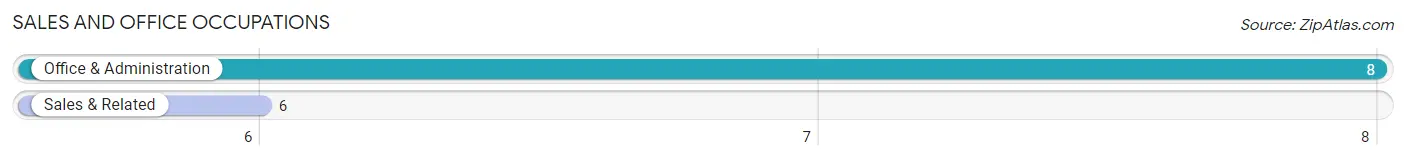
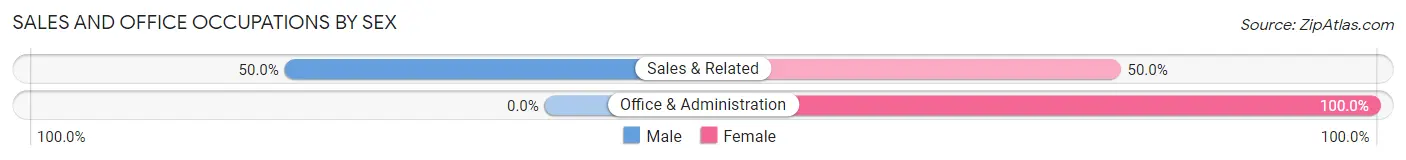
Sales and Office Occupations by Sex
| Occupation | Male | Female |
| Sales & Related | 3 (50.0%) | 3 (50.0%) |
| Office & Administration | 0 (0.0%) | 8 (100.0%) |
| Total (Category) | 3 (21.4%) | 11 (78.6%) |
| Total (Overall) | 64 (55.2%) | 52 (44.8%) |
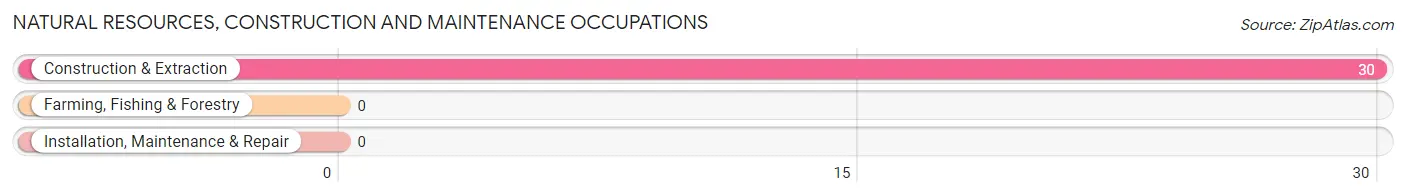
Natural Resources, Construction and Maintenance Occupations
The most common Natural Resources, Construction and Maintenance occupations in Timber Cove are , and Construction & Extraction (30 | 25.9%).
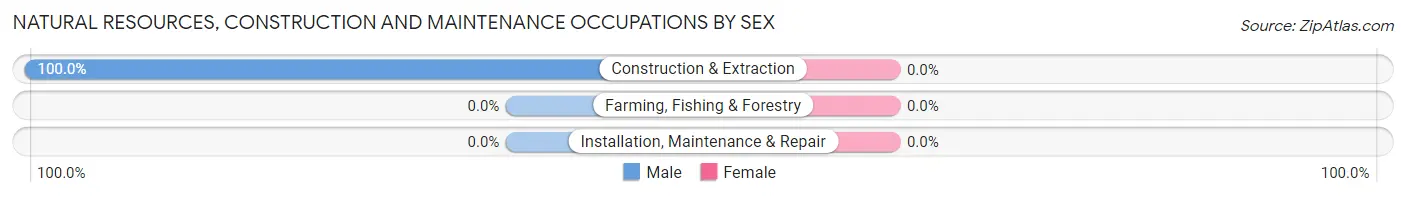
Natural Resources, Construction and Maintenance Occupations by Sex
| Occupation | Male | Female |
| Farming, Fishing & Forestry | 0 (0.0%) | 0 (0.0%) |
| Construction & Extraction | 30 (100.0%) | 0 (0.0%) |
| Installation, Maintenance & Repair | 0 (0.0%) | 0 (0.0%) |
| Total (Category) | 30 (100.0%) | 0 (0.0%) |
| Total (Overall) | 64 (55.2%) | 52 (44.8%) |
Production, Transportation and Moving Occupations
Production, Transportation and Moving Occupations by Sex
| Occupation | Male | Female |
| Production | 0 (0.0%) | 0 (0.0%) |
| Transportation | 0 (0.0%) | 0 (0.0%) |
| Material Moving | 0 (0.0%) | 0 (0.0%) |
| Total (Category) | 0 (0.0%) | 0 (0.0%) |
| Total (Overall) | 64 (55.2%) | 52 (44.8%) |
Employment Industries by Sex in Timber Cove
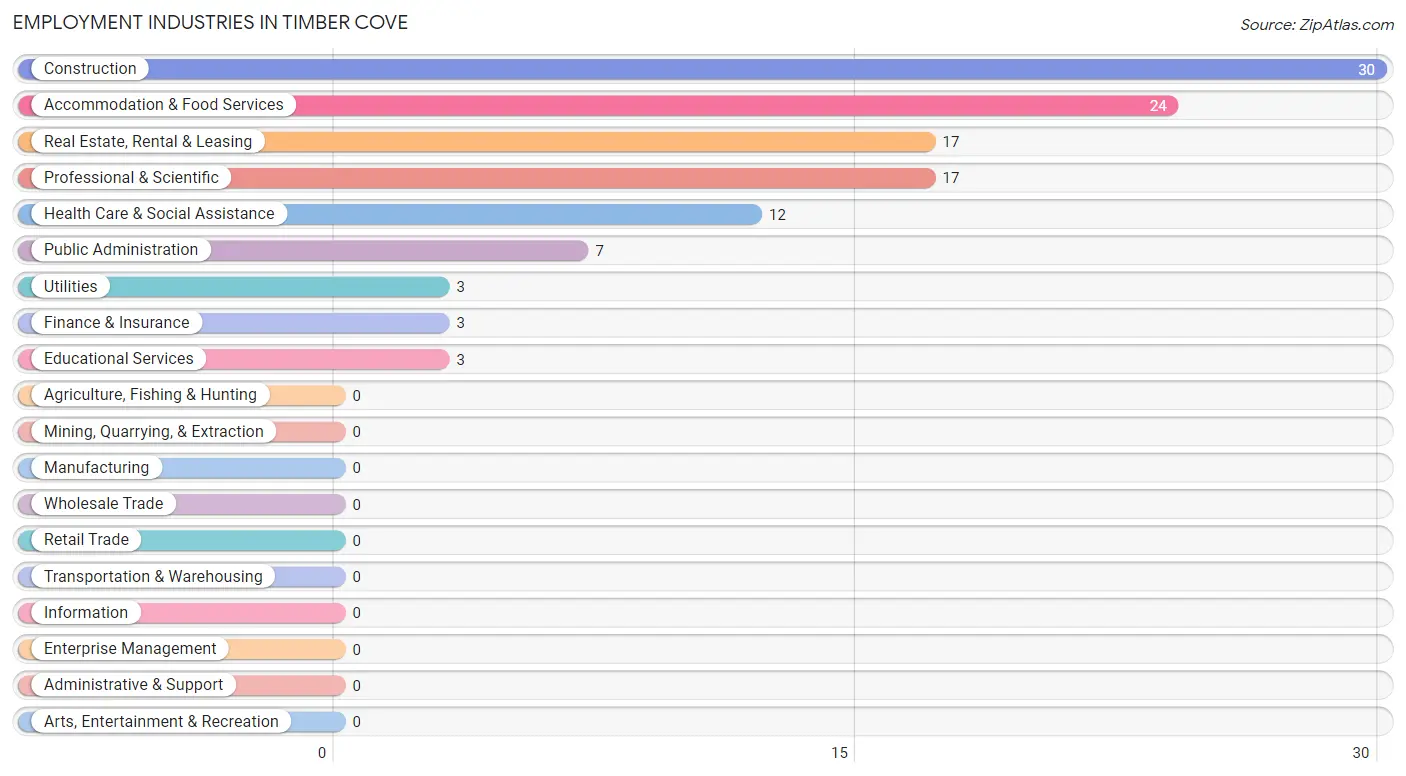
Employment Industries in Timber Cove
The major employment industries in Timber Cove include Construction (30 | 25.9%), Accommodation & Food Services (24 | 20.7%), Real Estate, Rental & Leasing (17 | 14.7%), Professional & Scientific (17 | 14.7%), and Health Care & Social Assistance (12 | 10.3%).
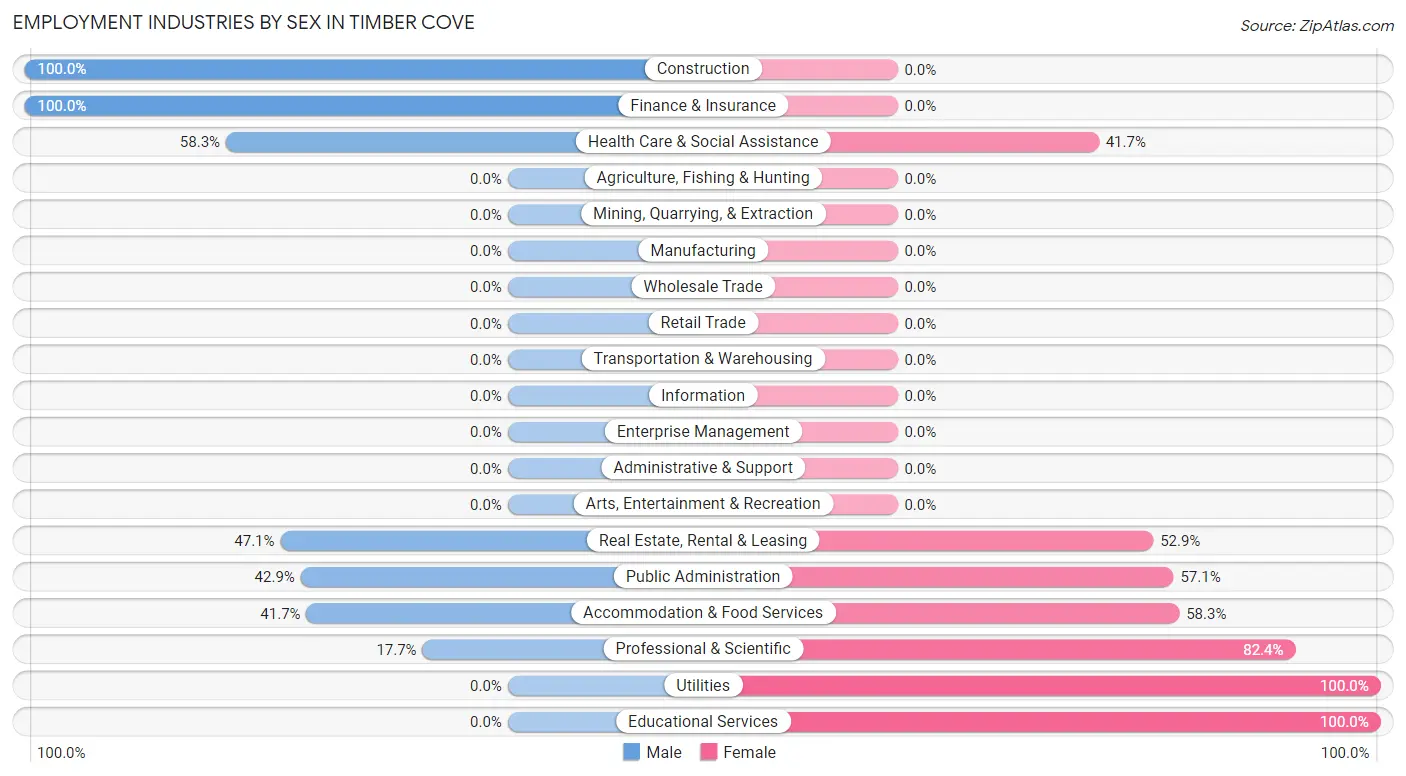
Employment Industries by Sex in Timber Cove
The Timber Cove industries that see more men than women are Construction (100.0%), Finance & Insurance (100.0%), and Health Care & Social Assistance (58.3%), whereas the industries that tend to have a higher number of women are Utilities (100.0%), Educational Services (100.0%), and Professional & Scientific (82.4%).
| Industry | Male | Female |
| Agriculture, Fishing & Hunting | 0 (0.0%) | 0 (0.0%) |
| Mining, Quarrying, & Extraction | 0 (0.0%) | 0 (0.0%) |
| Construction | 30 (100.0%) | 0 (0.0%) |
| Manufacturing | 0 (0.0%) | 0 (0.0%) |
| Wholesale Trade | 0 (0.0%) | 0 (0.0%) |
| Retail Trade | 0 (0.0%) | 0 (0.0%) |
| Transportation & Warehousing | 0 (0.0%) | 0 (0.0%) |
| Utilities | 0 (0.0%) | 3 (100.0%) |
| Information | 0 (0.0%) | 0 (0.0%) |
| Finance & Insurance | 3 (100.0%) | 0 (0.0%) |
| Real Estate, Rental & Leasing | 8 (47.1%) | 9 (52.9%) |
| Professional & Scientific | 3 (17.6%) | 14 (82.4%) |
| Enterprise Management | 0 (0.0%) | 0 (0.0%) |
| Administrative & Support | 0 (0.0%) | 0 (0.0%) |
| Educational Services | 0 (0.0%) | 3 (100.0%) |
| Health Care & Social Assistance | 7 (58.3%) | 5 (41.7%) |
| Arts, Entertainment & Recreation | 0 (0.0%) | 0 (0.0%) |
| Accommodation & Food Services | 10 (41.7%) | 14 (58.3%) |
| Public Administration | 3 (42.9%) | 4 (57.1%) |
| Total | 64 (55.2%) | 52 (44.8%) |
Education in Timber Cove
School Enrollment in Timber Cove
The most common levels of schooling among the 27 students in Timber Cove are middle school (10 | 37.0%), college / undergraduate (9 | 33.3%), and high school (8 | 29.6%).
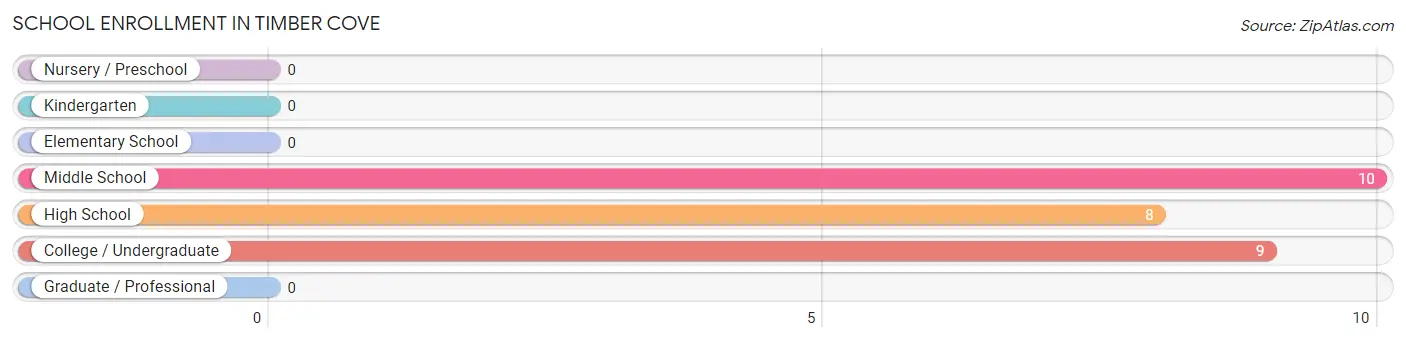
| School Level | # Students | % Students |
| Nursery / Preschool | 0 | 0.0% |
| Kindergarten | 0 | 0.0% |
| Elementary School | 0 | 0.0% |
| Middle School | 10 | 37.0% |
| High School | 8 | 29.6% |
| College / Undergraduate | 9 | 33.3% |
| Graduate / Professional | 0 | 0.0% |
| Total | 27 | 100.0% |
School Enrollment by Age by Funding Source in Timber Cove
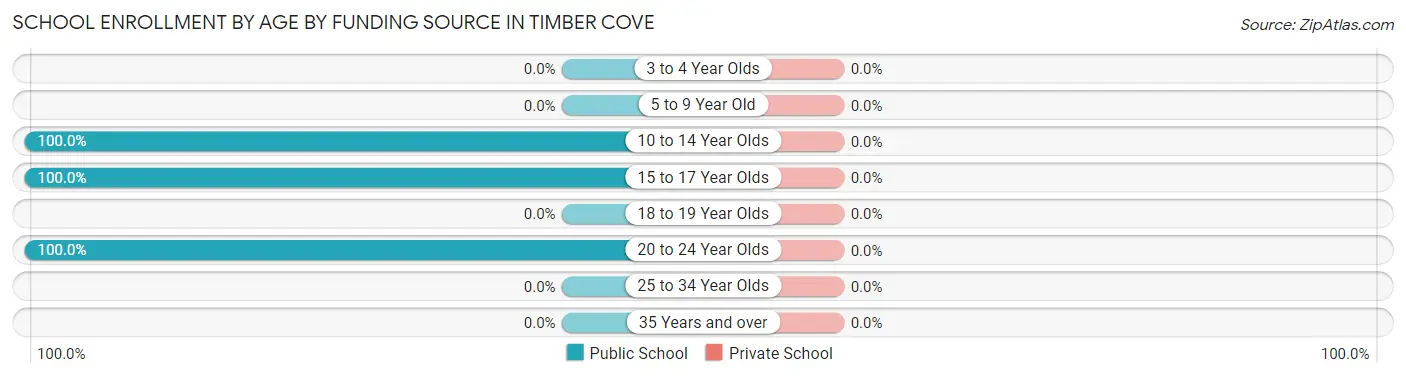
| Age Bracket | Public School | Private School |
| 3 to 4 Year Olds | 0 (0.0%) | 0 (0.0%) |
| 5 to 9 Year Old | 0 (0.0%) | 0 (0.0%) |
| 10 to 14 Year Olds | 10 (100.0%) | 0 (0.0%) |
| 15 to 17 Year Olds | 8 (100.0%) | 0 (0.0%) |
| 18 to 19 Year Olds | 0 (0.0%) | 0 (0.0%) |
| 20 to 24 Year Olds | 9 (100.0%) | 0 (0.0%) |
| 25 to 34 Year Olds | 0 (0.0%) | 0 (0.0%) |
| 35 Years and over | 0 (0.0%) | 0 (0.0%) |
| Total | 27 (100.0%) | 0 (0.0%) |
Educational Attainment by Field of Study in Timber Cove
Science & technology (17 | 18.3%), bio, nature & agricultural (15 | 16.1%), business (12 | 12.9%), literature & languages (10 | 10.7%), and physical & health sciences (8 | 8.6%) are the most common fields of study among 93 individuals in Timber Cove who have obtained a bachelor's degree or higher.
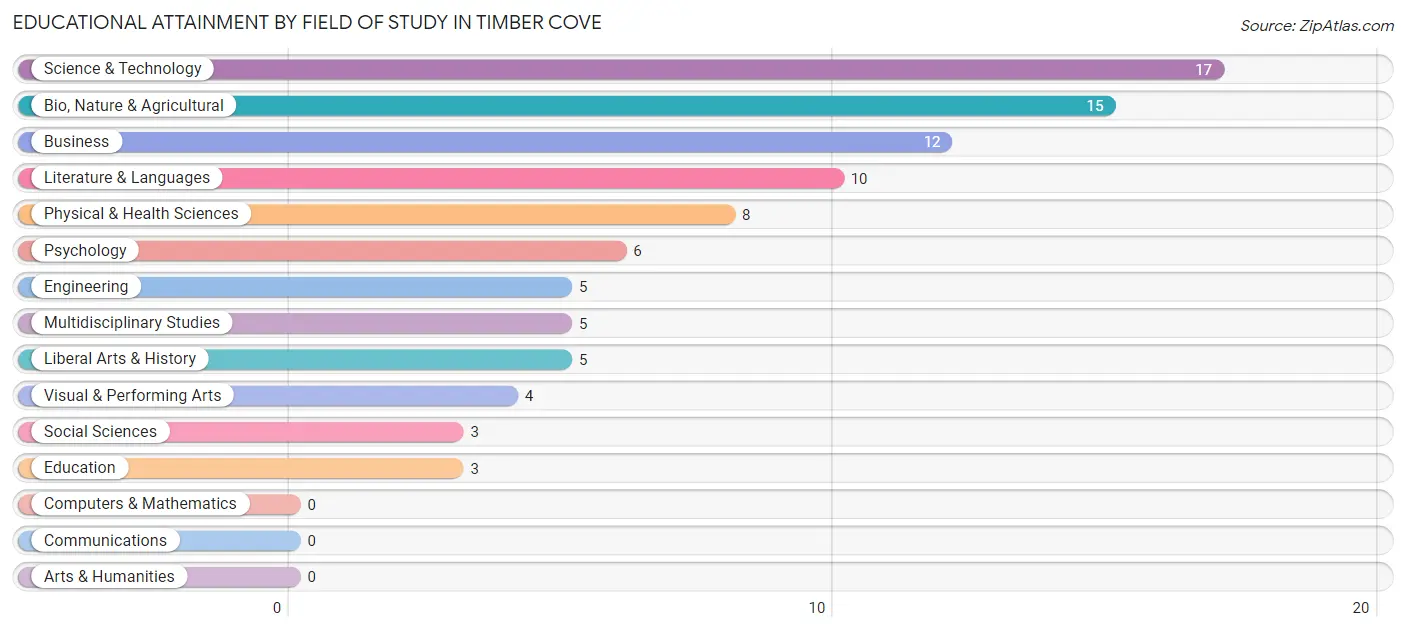
| Field of Study | # Graduates | % Graduates |
| Computers & Mathematics | 0 | 0.0% |
| Bio, Nature & Agricultural | 15 | 16.1% |
| Physical & Health Sciences | 8 | 8.6% |
| Psychology | 6 | 6.5% |
| Social Sciences | 3 | 3.2% |
| Engineering | 5 | 5.4% |
| Multidisciplinary Studies | 5 | 5.4% |
| Science & Technology | 17 | 18.3% |
| Business | 12 | 12.9% |
| Education | 3 | 3.2% |
| Literature & Languages | 10 | 10.7% |
| Liberal Arts & History | 5 | 5.4% |
| Visual & Performing Arts | 4 | 4.3% |
| Communications | 0 | 0.0% |
| Arts & Humanities | 0 | 0.0% |
| Total | 93 | 100.0% |
Transportation & Commute in Timber Cove
Vehicle Availability by Sex in Timber Cove
The most prevalent vehicle ownership categories in Timber Cove are males with 2 vehicles (24, accounting for 39.3%) and females with 2 vehicles (9, making up 46.2%).
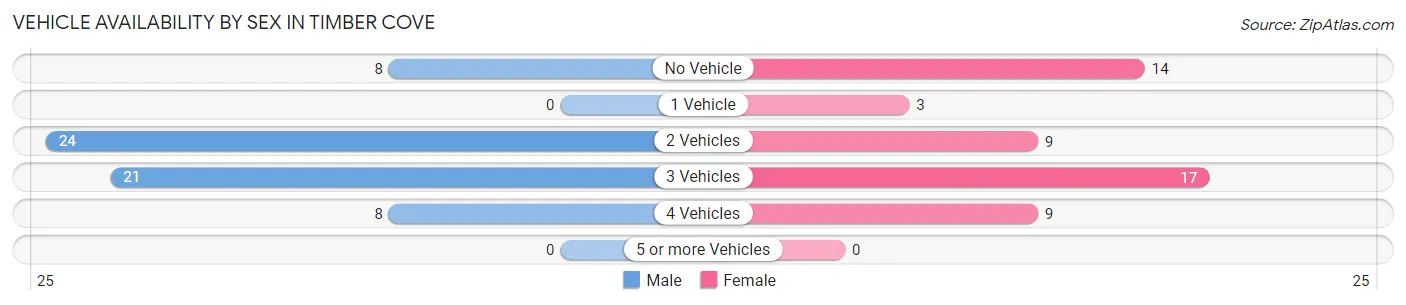
| Vehicles Available | Male | Female |
| No Vehicle | 8 (13.1%) | 14 (26.9%) |
| 1 Vehicle | 0 (0.0%) | 3 (5.8%) |
| 2 Vehicles | 24 (39.3%) | 9 (17.3%) |
| 3 Vehicles | 21 (34.4%) | 17 (32.7%) |
| 4 Vehicles | 8 (13.1%) | 9 (17.3%) |
| 5 or more Vehicles | 0 (0.0%) | 0 (0.0%) |
| Total | 61 (100.0%) | 52 (100.0%) |
Commute Time in Timber Cove
The most frequently occuring commute durations in Timber Cove are 35 to 39 minutes (17 commuters, 22.4%), 10 to 14 minutes (11 commuters, 14.5%), and 20 to 24 minutes (11 commuters, 14.5%).
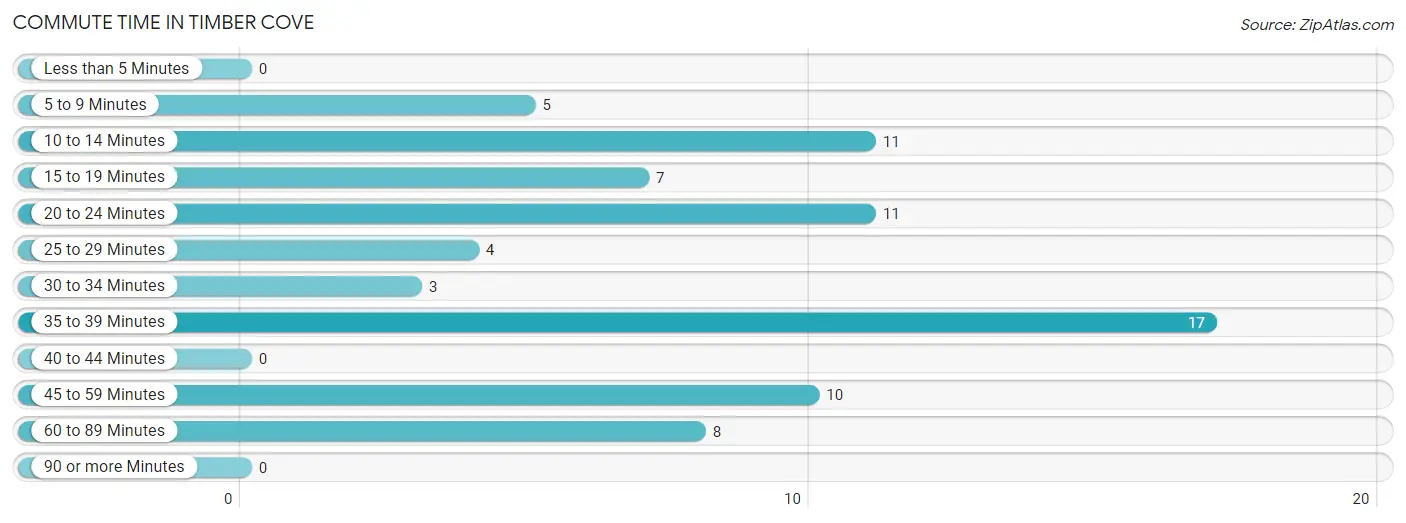
| Commute Time | # Commuters | % Commuters |
| Less than 5 Minutes | 0 | 0.0% |
| 5 to 9 Minutes | 5 | 6.6% |
| 10 to 14 Minutes | 11 | 14.5% |
| 15 to 19 Minutes | 7 | 9.2% |
| 20 to 24 Minutes | 11 | 14.5% |
| 25 to 29 Minutes | 4 | 5.3% |
| 30 to 34 Minutes | 3 | 4.0% |
| 35 to 39 Minutes | 17 | 22.4% |
| 40 to 44 Minutes | 0 | 0.0% |
| 45 to 59 Minutes | 10 | 13.2% |
| 60 to 89 Minutes | 8 | 10.5% |
| 90 or more Minutes | 0 | 0.0% |
Commute Time by Sex in Timber Cove
The most common commute times in Timber Cove are 45 to 59 minutes (10 commuters, 21.3%) for males and 35 to 39 minutes (9 commuters, 31.0%) for females.
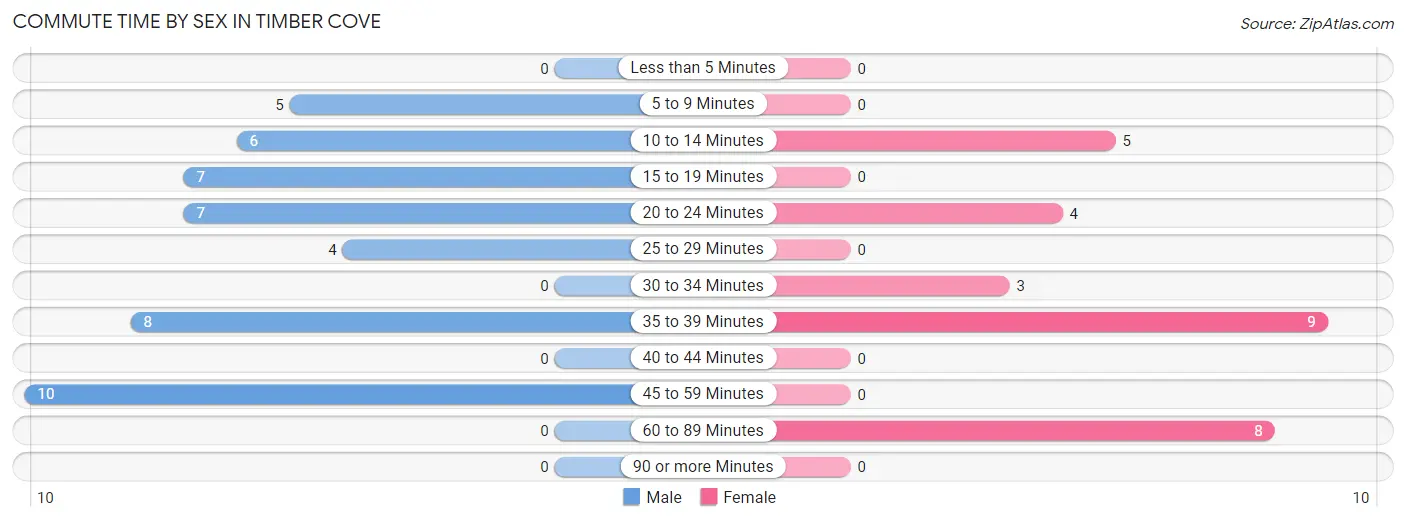
| Commute Time | Male | Female |
| Less than 5 Minutes | 0 (0.0%) | 0 (0.0%) |
| 5 to 9 Minutes | 5 (10.6%) | 0 (0.0%) |
| 10 to 14 Minutes | 6 (12.8%) | 5 (17.2%) |
| 15 to 19 Minutes | 7 (14.9%) | 0 (0.0%) |
| 20 to 24 Minutes | 7 (14.9%) | 4 (13.8%) |
| 25 to 29 Minutes | 4 (8.5%) | 0 (0.0%) |
| 30 to 34 Minutes | 0 (0.0%) | 3 (10.3%) |
| 35 to 39 Minutes | 8 (17.0%) | 9 (31.0%) |
| 40 to 44 Minutes | 0 (0.0%) | 0 (0.0%) |
| 45 to 59 Minutes | 10 (21.3%) | 0 (0.0%) |
| 60 to 89 Minutes | 0 (0.0%) | 8 (27.6%) |
| 90 or more Minutes | 0 (0.0%) | 0 (0.0%) |
Time of Departure to Work by Sex in Timber Cove
The most frequent times of departure to work in Timber Cove are 7:30 AM to 7:59 AM (14, 29.8%) for males and 6:30 AM to 6:59 AM (9, 31.0%) for females.
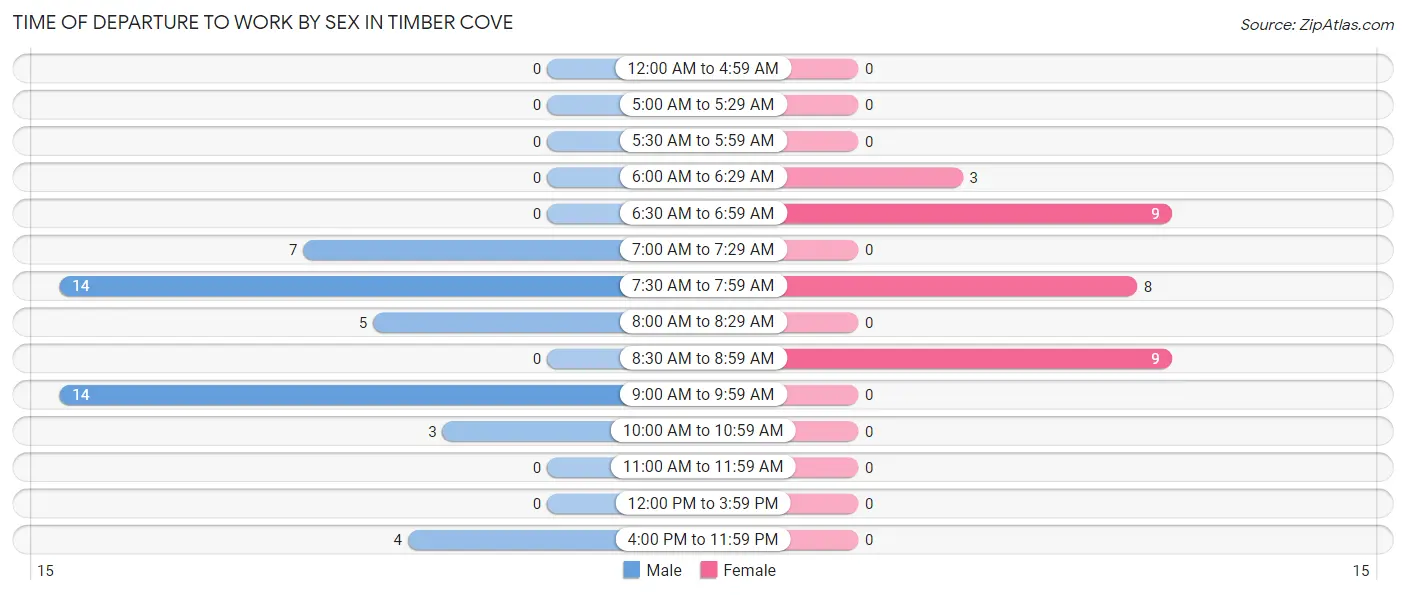
| Time of Departure | Male | Female |
| 12:00 AM to 4:59 AM | 0 (0.0%) | 0 (0.0%) |
| 5:00 AM to 5:29 AM | 0 (0.0%) | 0 (0.0%) |
| 5:30 AM to 5:59 AM | 0 (0.0%) | 0 (0.0%) |
| 6:00 AM to 6:29 AM | 0 (0.0%) | 3 (10.3%) |
| 6:30 AM to 6:59 AM | 0 (0.0%) | 9 (31.0%) |
| 7:00 AM to 7:29 AM | 7 (14.9%) | 0 (0.0%) |
| 7:30 AM to 7:59 AM | 14 (29.8%) | 8 (27.6%) |
| 8:00 AM to 8:29 AM | 5 (10.6%) | 0 (0.0%) |
| 8:30 AM to 8:59 AM | 0 (0.0%) | 9 (31.0%) |
| 9:00 AM to 9:59 AM | 14 (29.8%) | 0 (0.0%) |
| 10:00 AM to 10:59 AM | 3 (6.4%) | 0 (0.0%) |
| 11:00 AM to 11:59 AM | 0 (0.0%) | 0 (0.0%) |
| 12:00 PM to 3:59 PM | 0 (0.0%) | 0 (0.0%) |
| 4:00 PM to 11:59 PM | 4 (8.5%) | 0 (0.0%) |
| Total | 47 (100.0%) | 29 (100.0%) |
Housing Occupancy in Timber Cove
Occupancy by Ownership in Timber Cove
Of the total 98 dwellings in Timber Cove, owner-occupied units account for 60 (61.2%), while renter-occupied units make up 38 (38.8%).
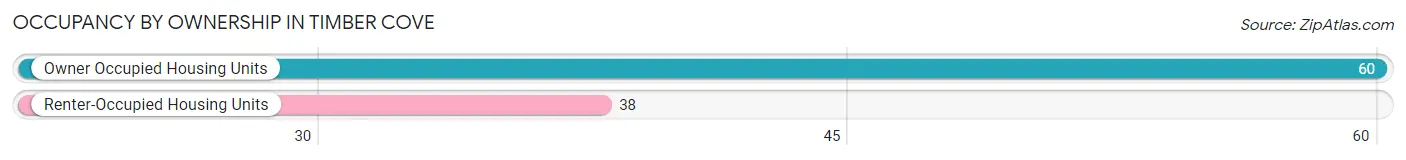
| Occupancy | # Housing Units | % Housing Units |
| Owner Occupied Housing Units | 60 | 61.2% |
| Renter-Occupied Housing Units | 38 | 38.8% |
| Total Occupied Housing Units | 98 | 100.0% |
Occupancy by Household Size in Timber Cove
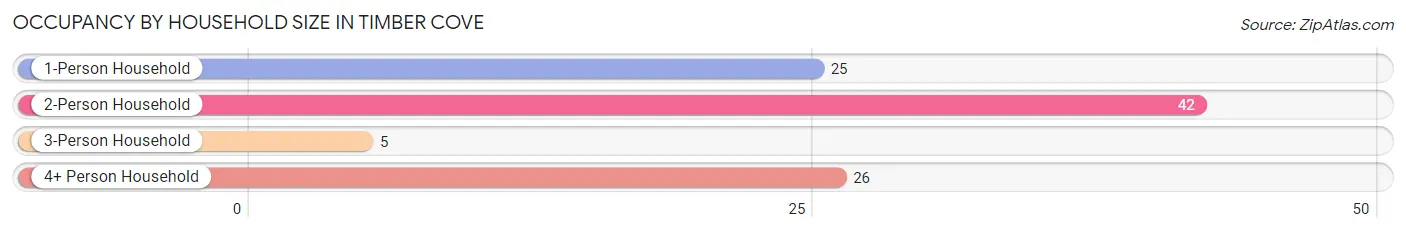
| Household Size | # Housing Units | % Housing Units |
| 1-Person Household | 25 | 25.5% |
| 2-Person Household | 42 | 42.9% |
| 3-Person Household | 5 | 5.1% |
| 4+ Person Household | 26 | 26.5% |
| Total Housing Units | 98 | 100.0% |
Occupancy by Ownership by Household Size in Timber Cove
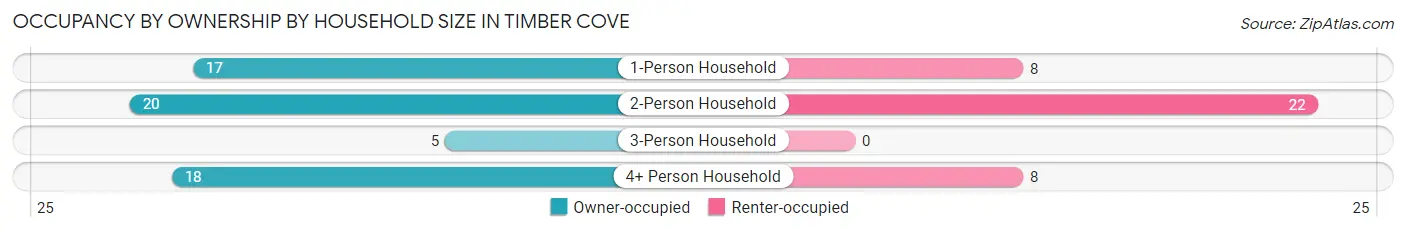
| Household Size | Owner-occupied | Renter-occupied |
| 1-Person Household | 17 (68.0%) | 8 (32.0%) |
| 2-Person Household | 20 (47.6%) | 22 (52.4%) |
| 3-Person Household | 5 (100.0%) | 0 (0.0%) |
| 4+ Person Household | 18 (69.2%) | 8 (30.8%) |
| Total Housing Units | 60 (61.2%) | 38 (38.8%) |
Occupancy by Educational Attainment in Timber Cove
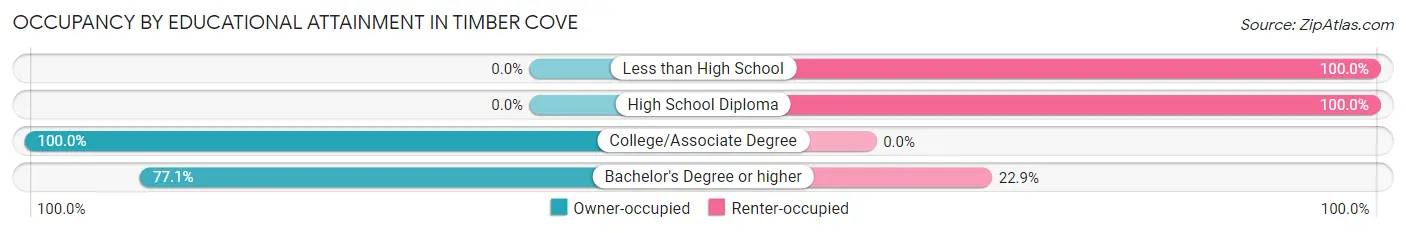
| Household Size | Owner-occupied | Renter-occupied |
| Less than High School | 0 (0.0%) | 8 (100.0%) |
| High School Diploma | 0 (0.0%) | 19 (100.0%) |
| College/Associate Degree | 23 (100.0%) | 0 (0.0%) |
| Bachelor's Degree or higher | 37 (77.1%) | 11 (22.9%) |
Occupancy by Age of Householder in Timber Cove
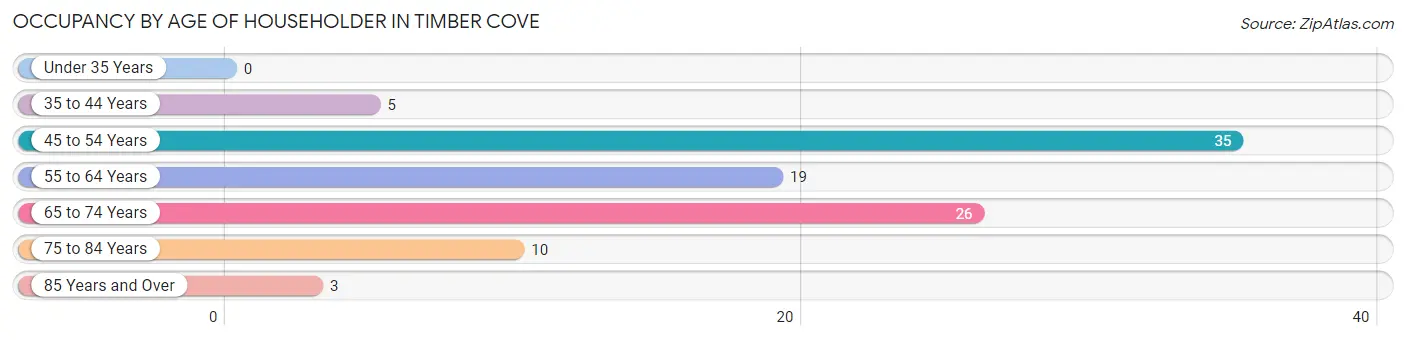
| Age Bracket | # Households | % Households |
| Under 35 Years | 0 | 0.0% |
| 35 to 44 Years | 5 | 5.1% |
| 45 to 54 Years | 35 | 35.7% |
| 55 to 64 Years | 19 | 19.4% |
| 65 to 74 Years | 26 | 26.5% |
| 75 to 84 Years | 10 | 10.2% |
| 85 Years and Over | 3 | 3.1% |
| Total | 98 | 100.0% |
Housing Finances in Timber Cove
Median Income by Occupancy in Timber Cove
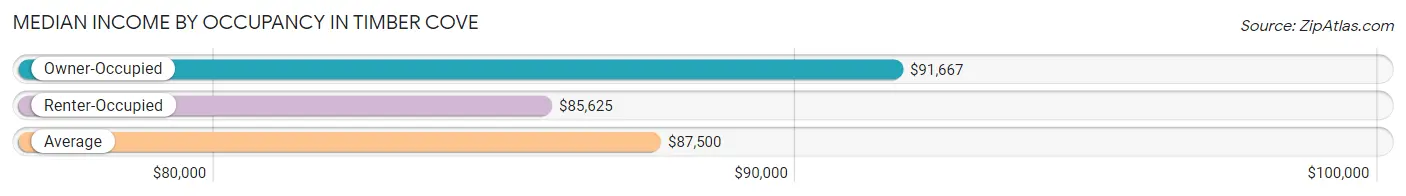
| Occupancy Type | # Households | Median Income |
| Owner-Occupied | 60 (61.2%) | $91,667 |
| Renter-Occupied | 38 (38.8%) | $85,625 |
| Average | 98 (100.0%) | $87,500 |
Occupancy by Householder Income Bracket in Timber Cove
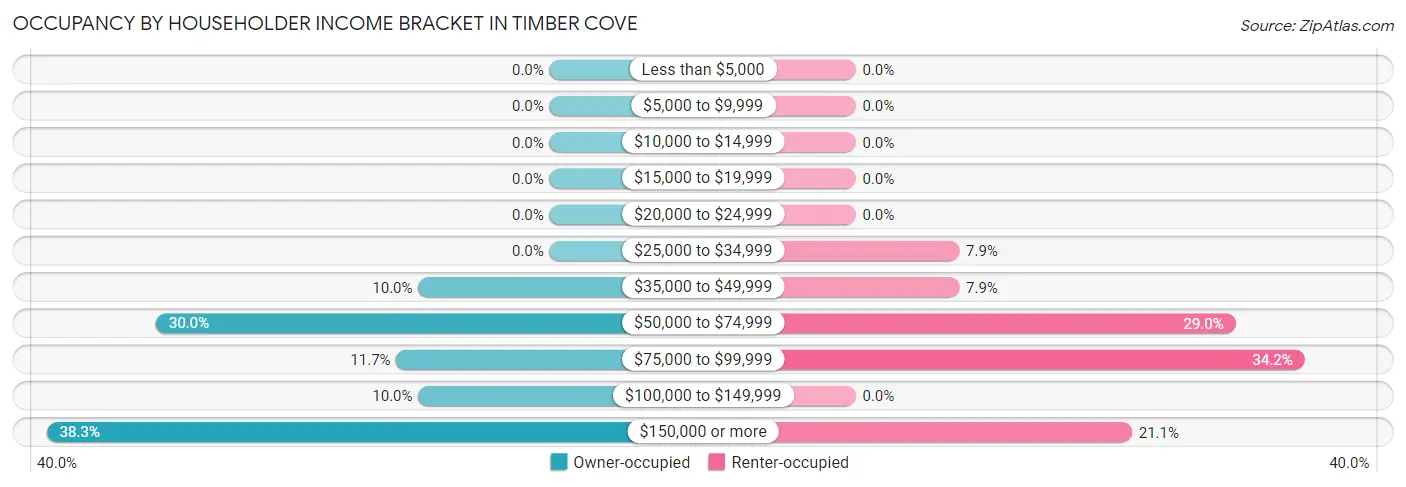
| Income Bracket | Owner-occupied | Renter-occupied |
| Less than $5,000 | 0 (0.0%) | 0 (0.0%) |
| $5,000 to $9,999 | 0 (0.0%) | 0 (0.0%) |
| $10,000 to $14,999 | 0 (0.0%) | 0 (0.0%) |
| $15,000 to $19,999 | 0 (0.0%) | 0 (0.0%) |
| $20,000 to $24,999 | 0 (0.0%) | 0 (0.0%) |
| $25,000 to $34,999 | 0 (0.0%) | 3 (7.9%) |
| $35,000 to $49,999 | 6 (10.0%) | 3 (7.9%) |
| $50,000 to $74,999 | 18 (30.0%) | 11 (28.9%) |
| $75,000 to $99,999 | 7 (11.7%) | 13 (34.2%) |
| $100,000 to $149,999 | 6 (10.0%) | 0 (0.0%) |
| $150,000 or more | 23 (38.3%) | 8 (21.0%) |
| Total | 60 (100.0%) | 38 (100.0%) |
Monthly Housing Cost Tiers in Timber Cove
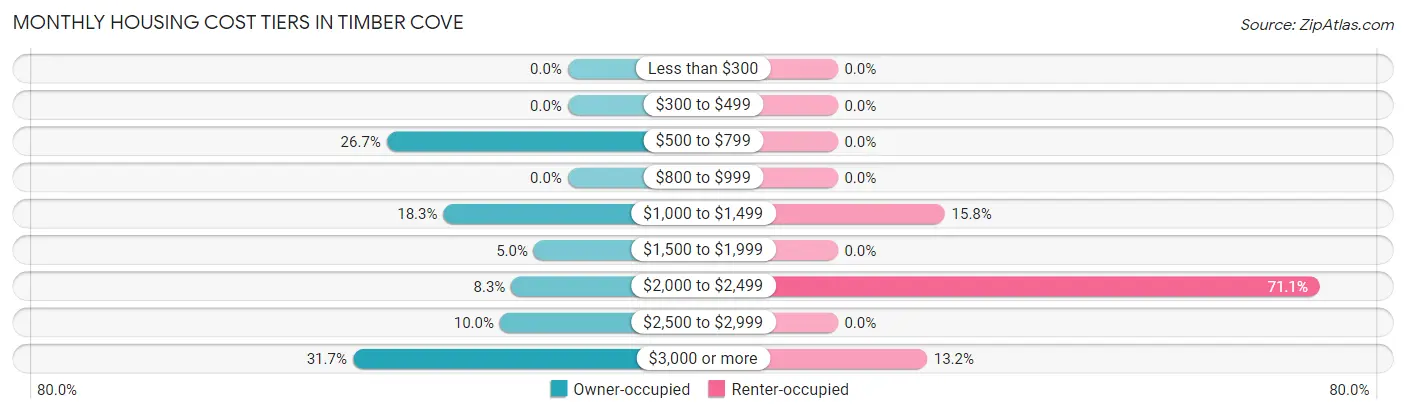
| Monthly Cost | Owner-occupied | Renter-occupied |
| Less than $300 | 0 (0.0%) | 0 (0.0%) |
| $300 to $499 | 0 (0.0%) | 0 (0.0%) |
| $500 to $799 | 16 (26.7%) | 0 (0.0%) |
| $800 to $999 | 0 (0.0%) | 0 (0.0%) |
| $1,000 to $1,499 | 11 (18.3%) | 6 (15.8%) |
| $1,500 to $1,999 | 3 (5.0%) | 0 (0.0%) |
| $2,000 to $2,499 | 5 (8.3%) | 27 (71.1%) |
| $2,500 to $2,999 | 6 (10.0%) | 0 (0.0%) |
| $3,000 or more | 19 (31.7%) | 5 (13.2%) |
| Total | 60 (100.0%) | 38 (100.0%) |
Physical Housing Characteristics in Timber Cove
Housing Structures in Timber Cove
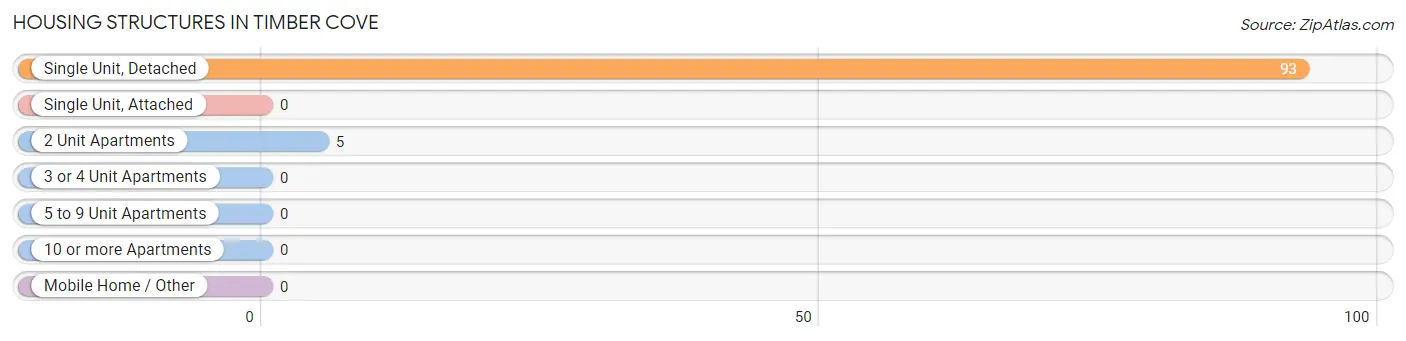
| Structure Type | # Housing Units | % Housing Units |
| Single Unit, Detached | 93 | 94.9% |
| Single Unit, Attached | 0 | 0.0% |
| 2 Unit Apartments | 5 | 5.1% |
| 3 or 4 Unit Apartments | 0 | 0.0% |
| 5 to 9 Unit Apartments | 0 | 0.0% |
| 10 or more Apartments | 0 | 0.0% |
| Mobile Home / Other | 0 | 0.0% |
| Total | 98 | 100.0% |
Housing Structures by Occupancy in Timber Cove
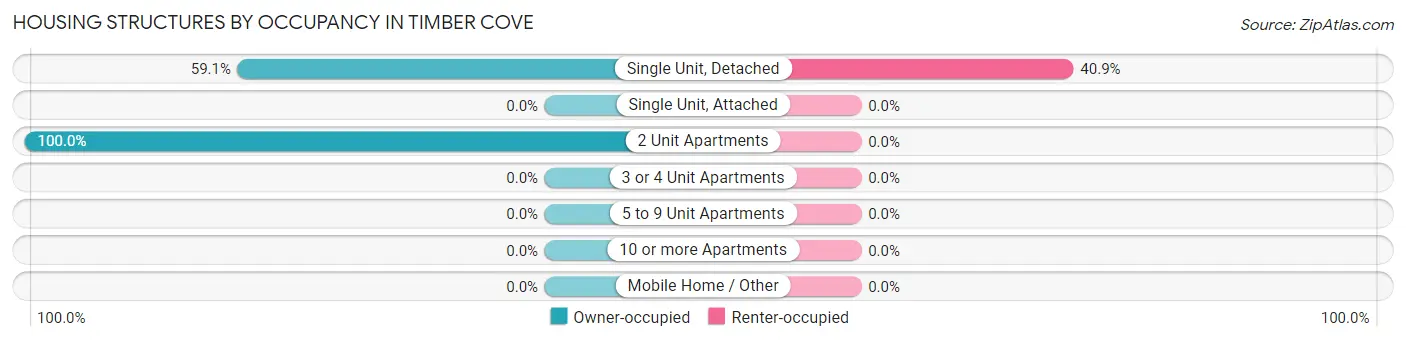
| Structure Type | Owner-occupied | Renter-occupied |
| Single Unit, Detached | 55 (59.1%) | 38 (40.9%) |
| Single Unit, Attached | 0 (0.0%) | 0 (0.0%) |
| 2 Unit Apartments | 5 (100.0%) | 0 (0.0%) |
| 3 or 4 Unit Apartments | 0 (0.0%) | 0 (0.0%) |
| 5 to 9 Unit Apartments | 0 (0.0%) | 0 (0.0%) |
| 10 or more Apartments | 0 (0.0%) | 0 (0.0%) |
| Mobile Home / Other | 0 (0.0%) | 0 (0.0%) |
| Total | 60 (61.2%) | 38 (38.8%) |
Housing Structures by Number of Rooms in Timber Cove
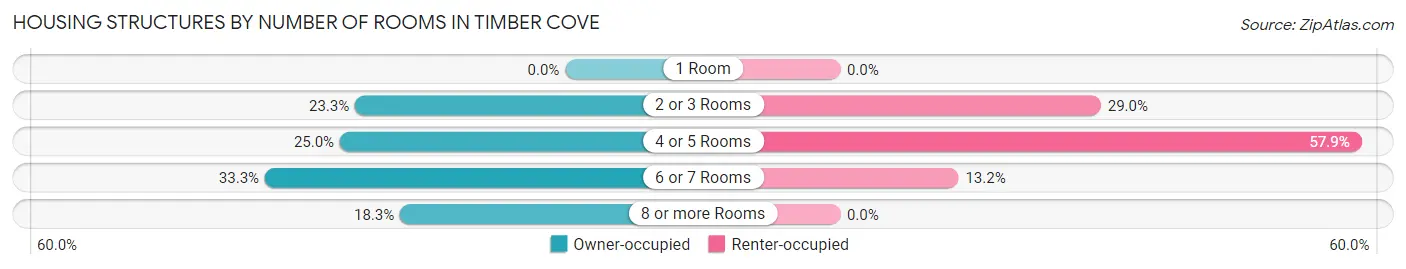
| Number of Rooms | Owner-occupied | Renter-occupied |
| 1 Room | 0 (0.0%) | 0 (0.0%) |
| 2 or 3 Rooms | 14 (23.3%) | 11 (28.9%) |
| 4 or 5 Rooms | 15 (25.0%) | 22 (57.9%) |
| 6 or 7 Rooms | 20 (33.3%) | 5 (13.2%) |
| 8 or more Rooms | 11 (18.3%) | 0 (0.0%) |
| Total | 60 (100.0%) | 38 (100.0%) |
Housing Structure by Heating Type in Timber Cove
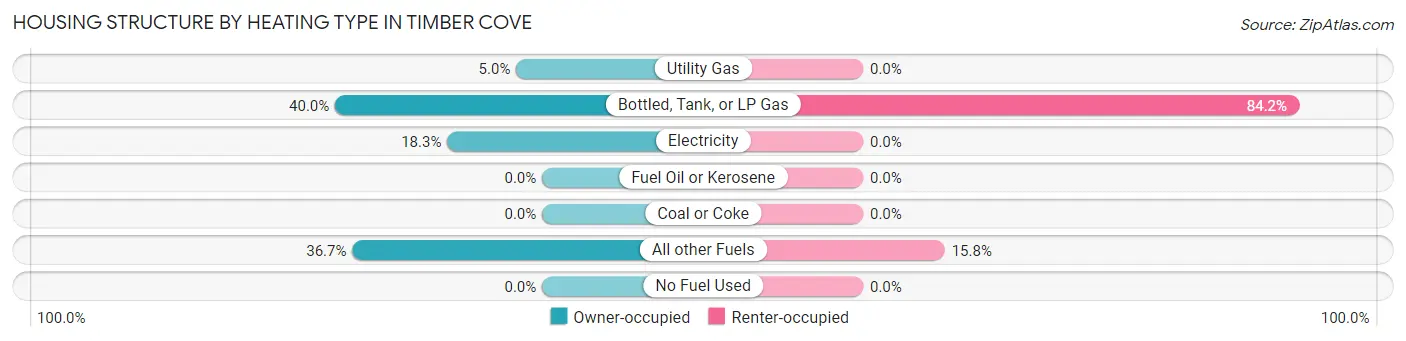
| Heating Type | Owner-occupied | Renter-occupied |
| Utility Gas | 3 (5.0%) | 0 (0.0%) |
| Bottled, Tank, or LP Gas | 24 (40.0%) | 32 (84.2%) |
| Electricity | 11 (18.3%) | 0 (0.0%) |
| Fuel Oil or Kerosene | 0 (0.0%) | 0 (0.0%) |
| Coal or Coke | 0 (0.0%) | 0 (0.0%) |
| All other Fuels | 22 (36.7%) | 6 (15.8%) |
| No Fuel Used | 0 (0.0%) | 0 (0.0%) |
| Total | 60 (100.0%) | 38 (100.0%) |
Household Vehicle Usage in Timber Cove
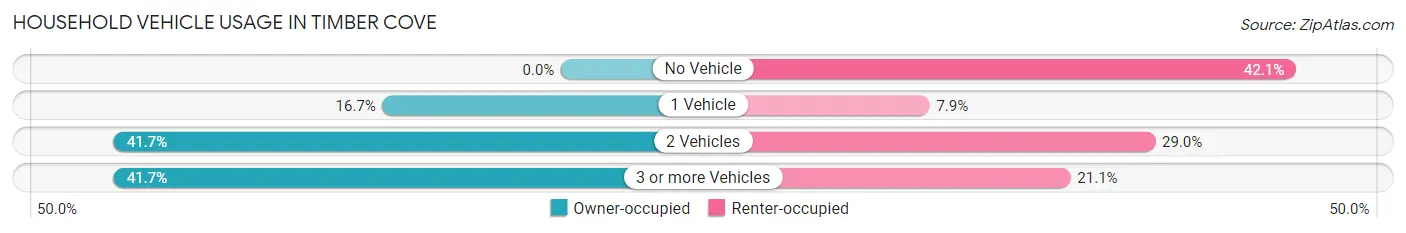
| Vehicles per Household | Owner-occupied | Renter-occupied |
| No Vehicle | 0 (0.0%) | 16 (42.1%) |
| 1 Vehicle | 10 (16.7%) | 3 (7.9%) |
| 2 Vehicles | 25 (41.7%) | 11 (28.9%) |
| 3 or more Vehicles | 25 (41.7%) | 8 (21.0%) |
| Total | 60 (100.0%) | 38 (100.0%) |
Real Estate & Mortgages in Timber Cove
Real Estate and Mortgage Overview in Timber Cove
| Characteristic | Without Mortgage | With Mortgage |
| Housing Units | 35 | 25 |
| Median Property Value | $875,000 | $767,900 |
| Median Household Income | $89,063 | $13 |
| Monthly Housing Costs | $1,030 | $19 |
| Real Estate Taxes | $5,469 | $0 |
Property Value by Mortgage Status in Timber Cove
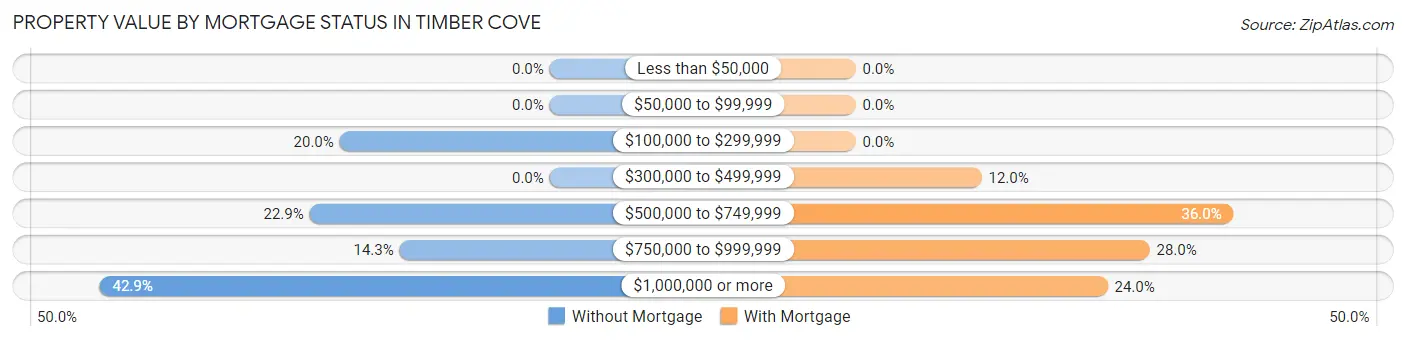
| Property Value | Without Mortgage | With Mortgage |
| Less than $50,000 | 0 (0.0%) | 0 (0.0%) |
| $50,000 to $99,999 | 0 (0.0%) | 0 (0.0%) |
| $100,000 to $299,999 | 7 (20.0%) | 0 (0.0%) |
| $300,000 to $499,999 | 0 (0.0%) | 3 (12.0%) |
| $500,000 to $749,999 | 8 (22.9%) | 9 (36.0%) |
| $750,000 to $999,999 | 5 (14.3%) | 7 (28.0%) |
| $1,000,000 or more | 15 (42.9%) | 6 (24.0%) |
| Total | 35 (100.0%) | 25 (100.0%) |
Household Income by Mortgage Status in Timber Cove
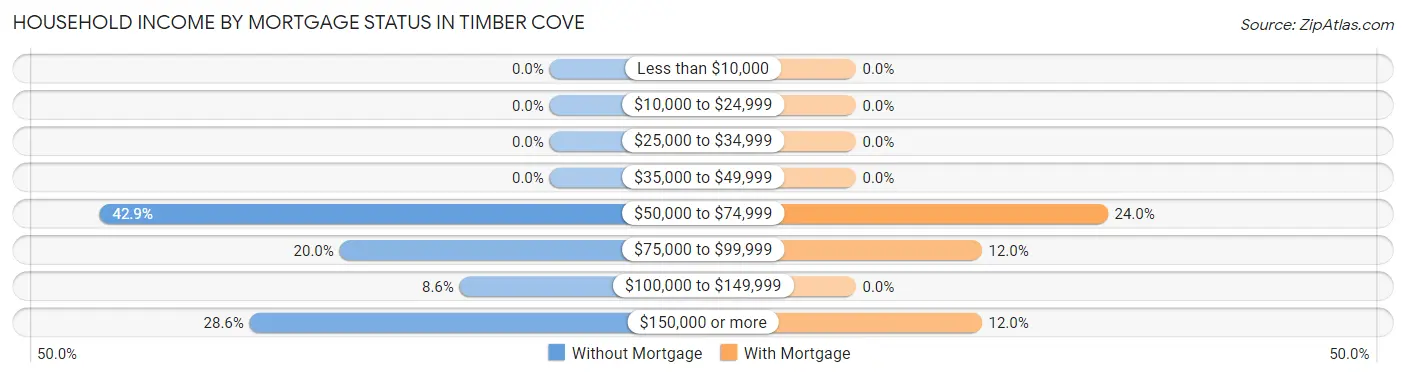
| Household Income | Without Mortgage | With Mortgage |
| Less than $10,000 | 0 (0.0%) | 0 (0.0%) |
| $10,000 to $24,999 | 0 (0.0%) | 0 (0.0%) |
| $25,000 to $34,999 | 0 (0.0%) | 0 (0.0%) |
| $35,000 to $49,999 | 0 (0.0%) | 0 (0.0%) |
| $50,000 to $74,999 | 15 (42.9%) | 6 (24.0%) |
| $75,000 to $99,999 | 7 (20.0%) | 3 (12.0%) |
| $100,000 to $149,999 | 3 (8.6%) | 0 (0.0%) |
| $150,000 or more | 10 (28.6%) | 3 (12.0%) |
| Total | 35 (100.0%) | 25 (100.0%) |
Property Value to Household Income Ratio in Timber Cove
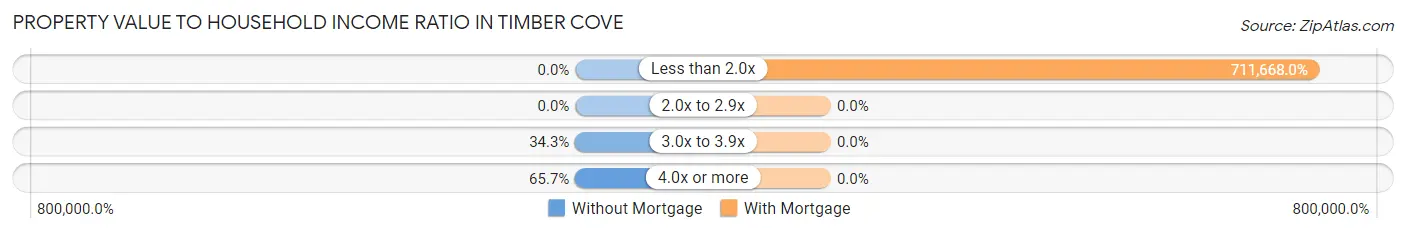
| Value-to-Income Ratio | Without Mortgage | With Mortgage |
| Less than 2.0x | 0 (0.0%) | 177,917 (711,668.0%) |
| 2.0x to 2.9x | 0 (0.0%) | 0 (0.0%) |
| 3.0x to 3.9x | 12 (34.3%) | 0 (0.0%) |
| 4.0x or more | 23 (65.7%) | 0 (0.0%) |
| Total | 35 (100.0%) | 25 (100.0%) |
Real Estate Taxes by Mortgage Status in Timber Cove
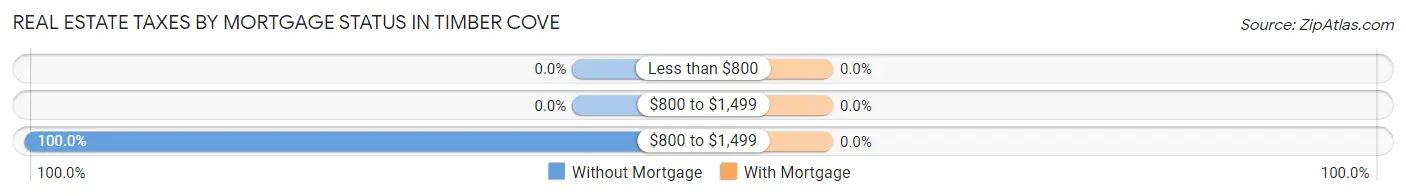
| Property Taxes | Without Mortgage | With Mortgage |
| Less than $800 | 0 (0.0%) | 0 (0.0%) |
| $800 to $1,499 | 0 (0.0%) | 0 (0.0%) |
| $800 to $1,499 | 35 (100.0%) | 0 (0.0%) |
| Total | 35 (100.0%) | 25 (100.0%) |
Health & Disability in Timber Cove
Health Insurance Coverage by Age in Timber Cove
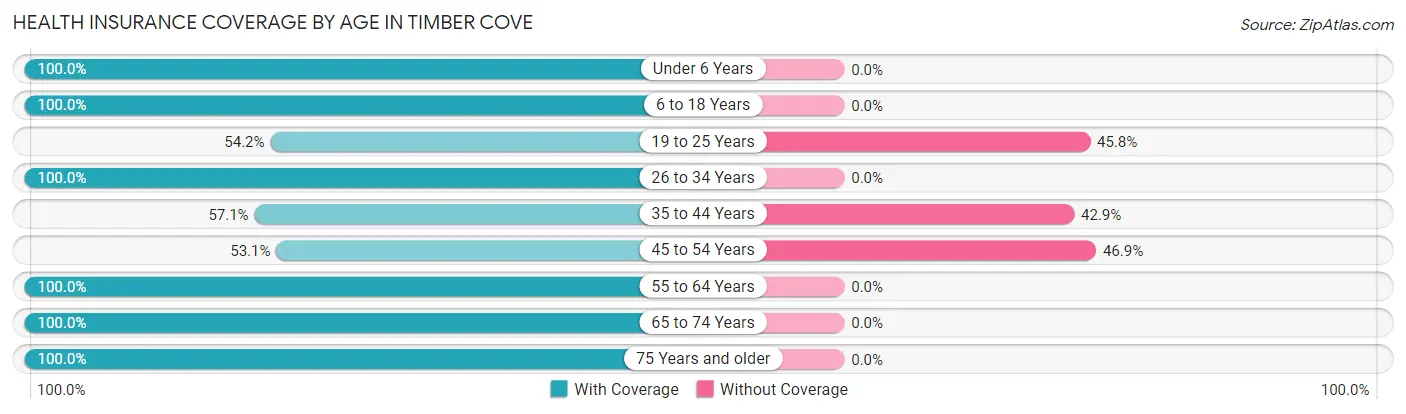
| Age Bracket | With Coverage | Without Coverage |
| Under 6 Years | 4 (100.0%) | 0 (0.0%) |
| 6 to 18 Years | 21 (100.0%) | 0 (0.0%) |
| 19 to 25 Years | 13 (54.2%) | 11 (45.8%) |
| 26 to 34 Years | 7 (100.0%) | 0 (0.0%) |
| 35 to 44 Years | 12 (57.1%) | 9 (42.9%) |
| 45 to 54 Years | 26 (53.1%) | 23 (46.9%) |
| 55 to 64 Years | 32 (100.0%) | 0 (0.0%) |
| 65 to 74 Years | 44 (100.0%) | 0 (0.0%) |
| 75 Years and older | 33 (100.0%) | 0 (0.0%) |
| Total | 192 (81.7%) | 43 (18.3%) |
Health Insurance Coverage by Citizenship Status in Timber Cove
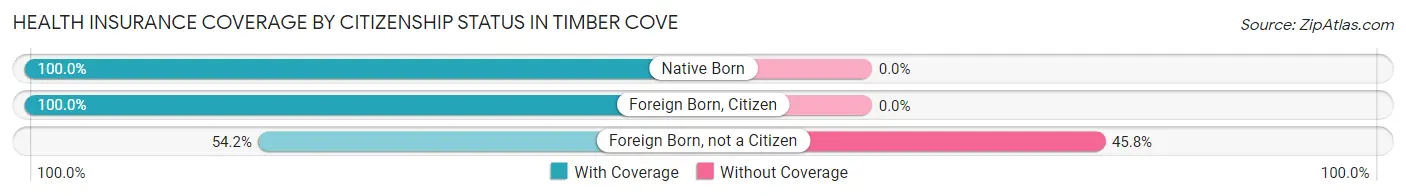
| Citizenship Status | With Coverage | Without Coverage |
| Native Born | 4 (100.0%) | 0 (0.0%) |
| Foreign Born, Citizen | 21 (100.0%) | 0 (0.0%) |
| Foreign Born, not a Citizen | 13 (54.2%) | 11 (45.8%) |
Health Insurance Coverage by Household Income in Timber Cove
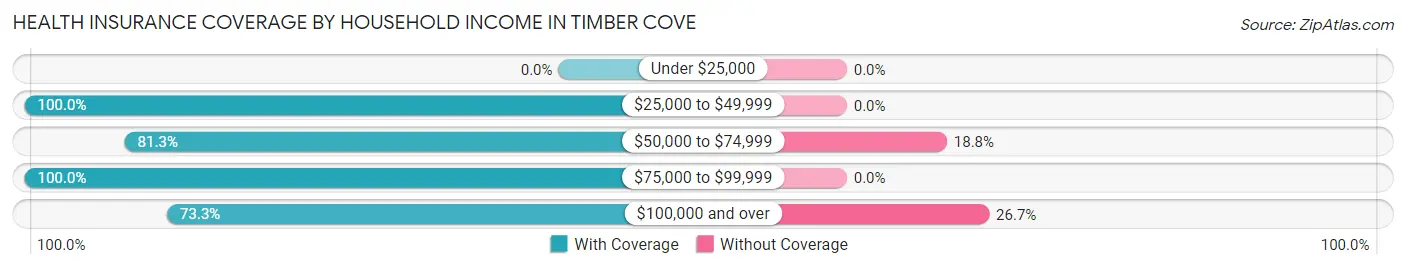
| Household Income | With Coverage | Without Coverage |
| Under $25,000 | 0 (0.0%) | 0 (0.0%) |
| $25,000 to $49,999 | 18 (100.0%) | 0 (0.0%) |
| $50,000 to $74,999 | 65 (81.2%) | 15 (18.8%) |
| $75,000 to $99,999 | 32 (100.0%) | 0 (0.0%) |
| $100,000 and over | 77 (73.3%) | 28 (26.7%) |
Public vs Private Health Insurance Coverage by Age in Timber Cove
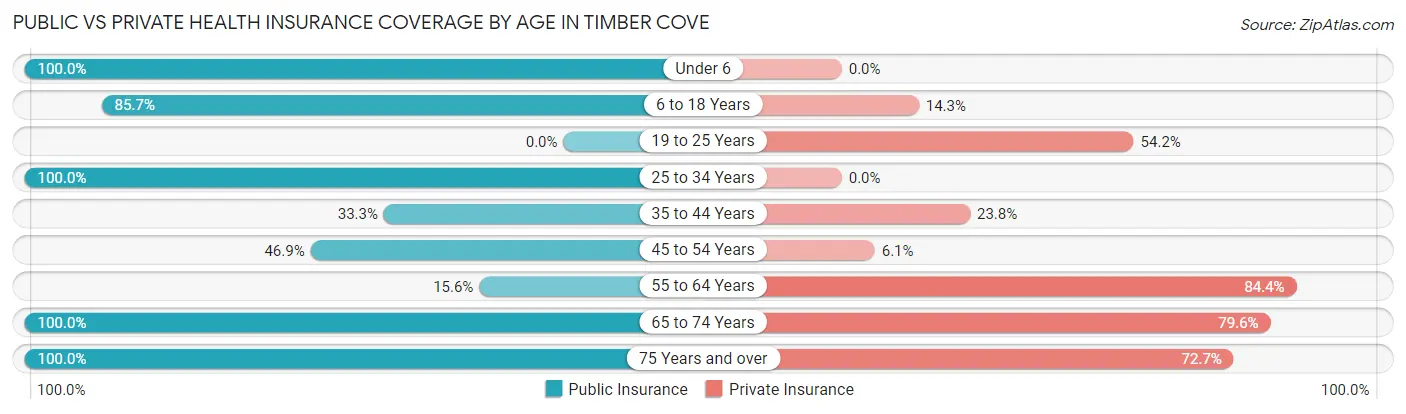
| Age Bracket | Public Insurance | Private Insurance |
| Under 6 | 4 (100.0%) | 0 (0.0%) |
| 6 to 18 Years | 18 (85.7%) | 3 (14.3%) |
| 19 to 25 Years | 0 (0.0%) | 13 (54.2%) |
| 25 to 34 Years | 7 (100.0%) | 0 (0.0%) |
| 35 to 44 Years | 7 (33.3%) | 5 (23.8%) |
| 45 to 54 Years | 23 (46.9%) | 3 (6.1%) |
| 55 to 64 Years | 5 (15.6%) | 27 (84.4%) |
| 65 to 74 Years | 44 (100.0%) | 35 (79.5%) |
| 75 Years and over | 33 (100.0%) | 24 (72.7%) |
| Total | 141 (60.0%) | 110 (46.8%) |
Disability Status by Sex by Age in Timber Cove
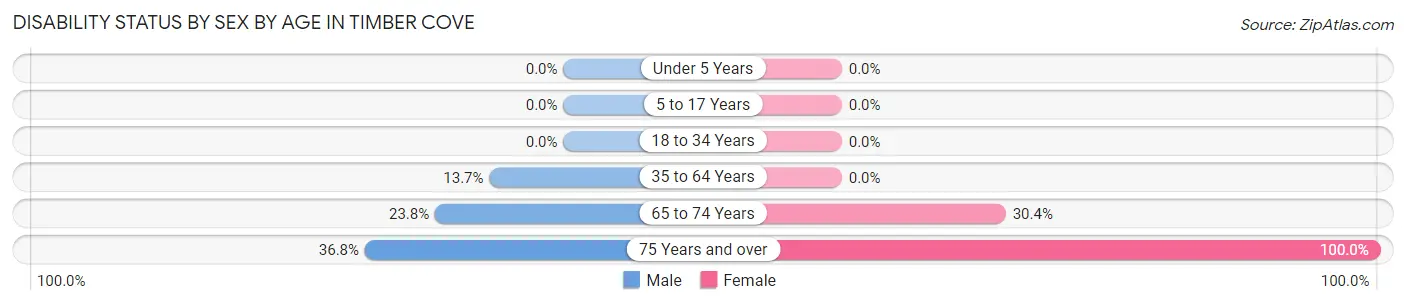
| Age Bracket | Male | Female |
| Under 5 Years | 0 (0.0%) | 0 (0.0%) |
| 5 to 17 Years | 0 (0.0%) | 0 (0.0%) |
| 18 to 34 Years | 0 (0.0%) | 0 (0.0%) |
| 35 to 64 Years | 7 (13.7%) | 0 (0.0%) |
| 65 to 74 Years | 5 (23.8%) | 7 (30.4%) |
| 75 Years and over | 7 (36.8%) | 14 (100.0%) |
Disability Class by Sex by Age in Timber Cove
Disability Class: Hearing Difficulty
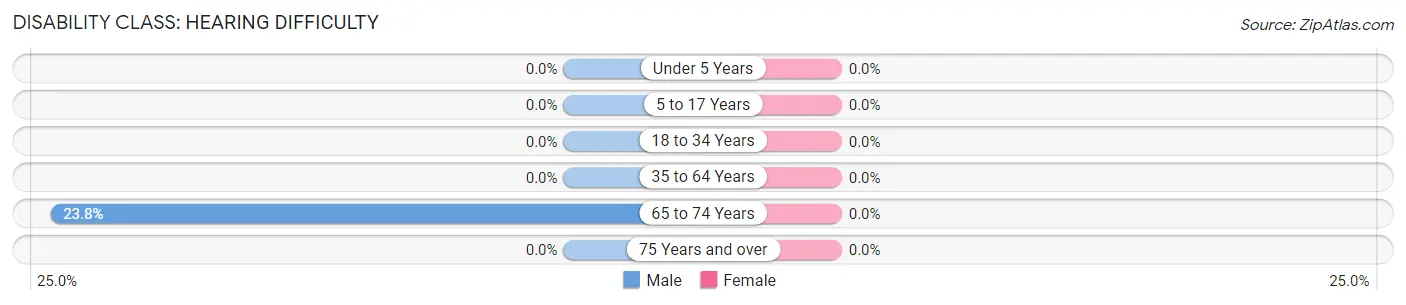
| Age Bracket | Male | Female |
| Under 5 Years | 0 (0.0%) | 0 (0.0%) |
| 5 to 17 Years | 0 (0.0%) | 0 (0.0%) |
| 18 to 34 Years | 0 (0.0%) | 0 (0.0%) |
| 35 to 64 Years | 0 (0.0%) | 0 (0.0%) |
| 65 to 74 Years | 5 (23.8%) | 0 (0.0%) |
| 75 Years and over | 0 (0.0%) | 0 (0.0%) |
Disability Class: Vision Difficulty
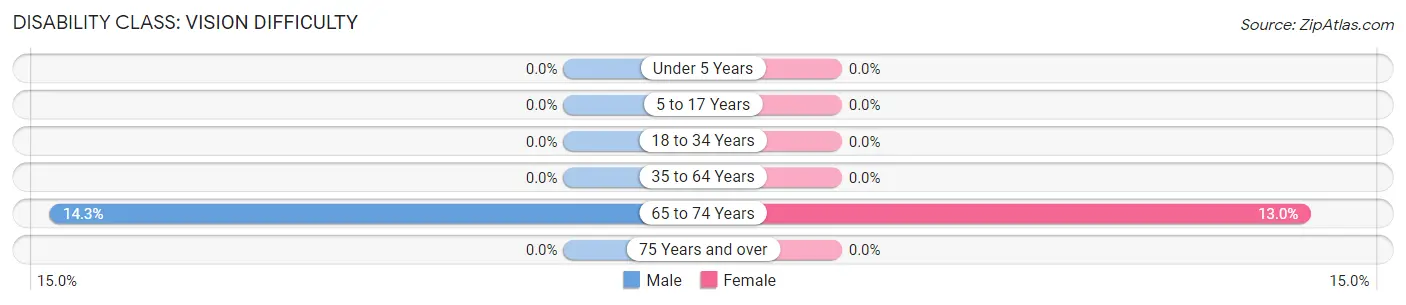
| Age Bracket | Male | Female |
| Under 5 Years | 0 (0.0%) | 0 (0.0%) |
| 5 to 17 Years | 0 (0.0%) | 0 (0.0%) |
| 18 to 34 Years | 0 (0.0%) | 0 (0.0%) |
| 35 to 64 Years | 0 (0.0%) | 0 (0.0%) |
| 65 to 74 Years | 3 (14.3%) | 3 (13.0%) |
| 75 Years and over | 0 (0.0%) | 0 (0.0%) |
Disability Class: Cognitive Difficulty
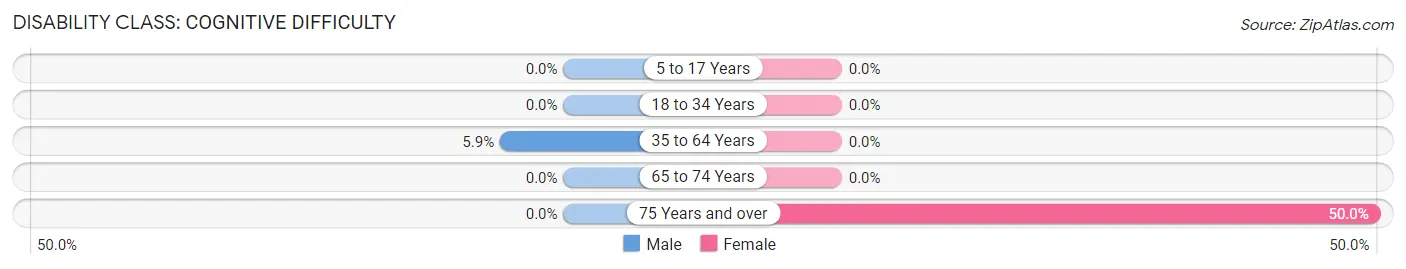
| Age Bracket | Male | Female |
| 5 to 17 Years | 0 (0.0%) | 0 (0.0%) |
| 18 to 34 Years | 0 (0.0%) | 0 (0.0%) |
| 35 to 64 Years | 3 (5.9%) | 0 (0.0%) |
| 65 to 74 Years | 0 (0.0%) | 0 (0.0%) |
| 75 Years and over | 0 (0.0%) | 7 (50.0%) |
Disability Class: Ambulatory Difficulty
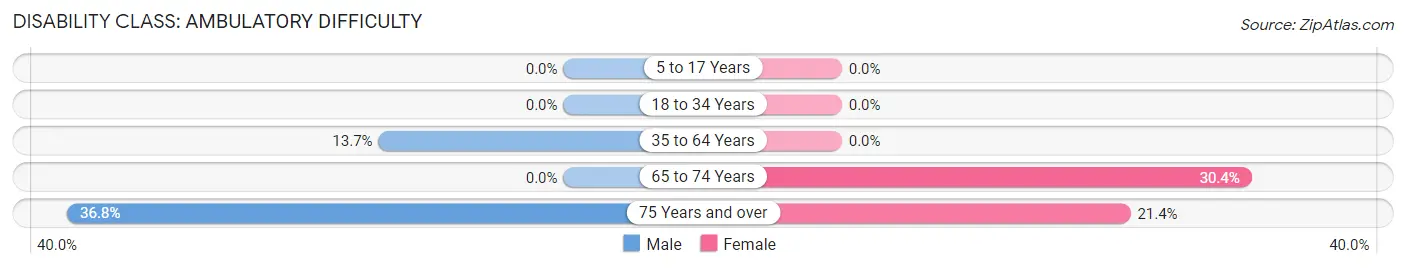
| Age Bracket | Male | Female |
| 5 to 17 Years | 0 (0.0%) | 0 (0.0%) |
| 18 to 34 Years | 0 (0.0%) | 0 (0.0%) |
| 35 to 64 Years | 7 (13.7%) | 0 (0.0%) |
| 65 to 74 Years | 0 (0.0%) | 7 (30.4%) |
| 75 Years and over | 7 (36.8%) | 3 (21.4%) |
Disability Class: Self-Care Difficulty
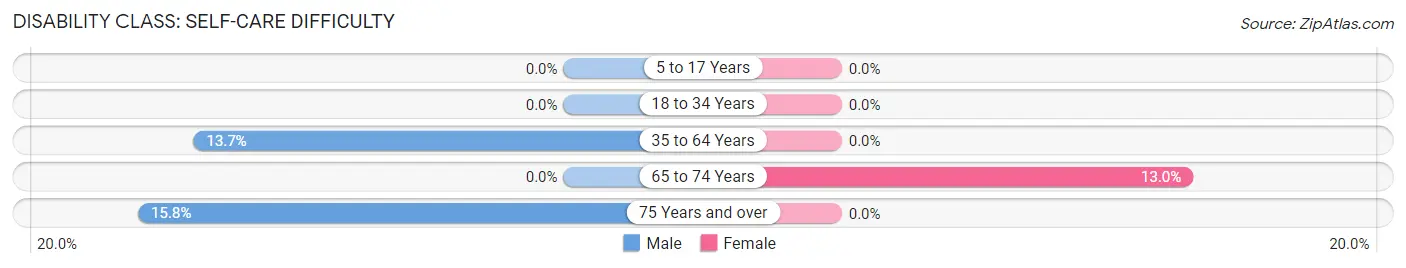
| Age Bracket | Male | Female |
| 5 to 17 Years | 0 (0.0%) | 0 (0.0%) |
| 18 to 34 Years | 0 (0.0%) | 0 (0.0%) |
| 35 to 64 Years | 7 (13.7%) | 0 (0.0%) |
| 65 to 74 Years | 0 (0.0%) | 3 (13.0%) |
| 75 Years and over | 3 (15.8%) | 0 (0.0%) |
Technology Access in Timber Cove
Computing Device Access in Timber Cove
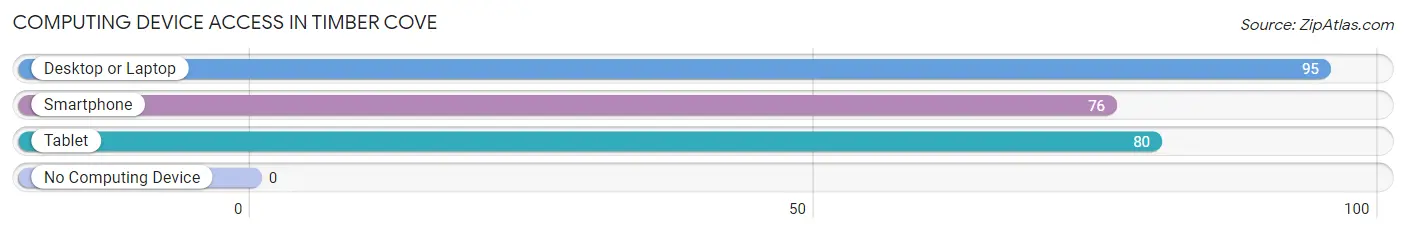
| Device Type | # Households | % Households |
| Desktop or Laptop | 95 | 96.9% |
| Smartphone | 76 | 77.5% |
| Tablet | 80 | 81.6% |
| No Computing Device | 0 | 0.0% |
| Total | 98 | 100.0% |
Internet Access in Timber Cove
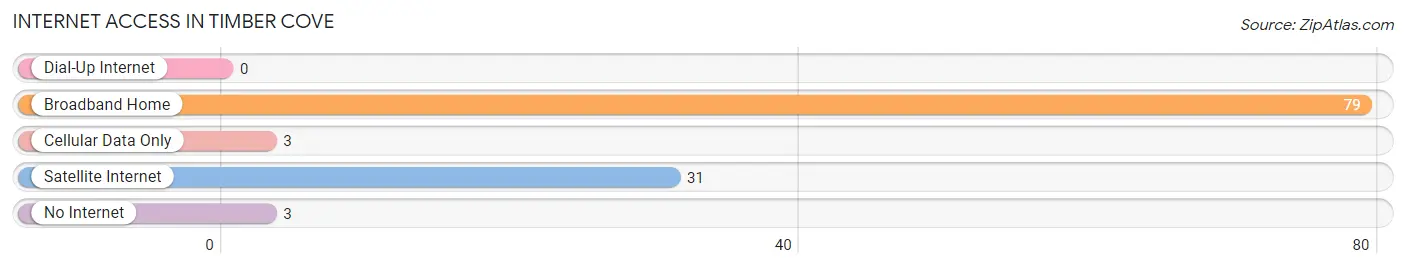
| Internet Type | # Households | % Households |
| Dial-Up Internet | 0 | 0.0% |
| Broadband Home | 79 | 80.6% |
| Cellular Data Only | 3 | 3.1% |
| Satellite Internet | 31 | 31.6% |
| No Internet | 3 | 3.1% |
| Total | 98 | 100.0% |
Timber Cove Summary
Timber Cove is a small unincorporated community located in Sonoma County, California. It is situated on the Pacific Coast, approximately 50 miles north of San Francisco. The community is nestled in a picturesque cove, surrounded by redwood forests and the Pacific Ocean. It is a popular destination for tourists and locals alike, offering a variety of activities and attractions.
History
The area now known as Timber Cove was first inhabited by the Coast Miwok Native Americans. They lived in the area for thousands of years, relying on the abundant natural resources of the area for sustenance. In the late 1800s, the area was settled by European settlers, who began to log the redwood forests and harvest the abundant seafood from the ocean.
In the early 1900s, the area was developed as a resort destination. The first hotel was built in 1910, and the area quickly became a popular destination for tourists. The area was also home to a number of fishing villages, which provided a livelihood for many of the local residents.
Geography
Timber Cove is located in Sonoma County, California, approximately 50 miles north of San Francisco. It is situated on the Pacific Coast, surrounded by redwood forests and the Pacific Ocean. The area is characterized by rugged terrain, with steep cliffs and rocky shorelines. The climate is mild, with temperatures rarely dropping below freezing.
Economy
The economy of Timber Cove is largely based on tourism. The area is a popular destination for visitors from all over the world, who come to enjoy the natural beauty of the area. The area is also home to a number of fishing villages, which provide a livelihood for many of the local residents. In addition, the area is home to a number of small businesses, including restaurants, shops, and galleries.
Demographics
As of the 2010 census, the population of Timber Cove was 1,093. The population is largely white (90.2%), with a small percentage of Hispanic or Latino (4.2%) and Asian (2.2%) residents. The median household income is $60,000, and the median age is 44. The area is largely rural, with a small number of businesses and services.
Conclusion
Timber Cove is a small unincorporated community located in Sonoma County, California. It is situated on the Pacific Coast, surrounded by redwood forests and the Pacific Ocean. The area is characterized by its natural beauty, and is a popular destination for tourists and locals alike. The economy of the area is largely based on tourism, with a number of fishing villages providing a livelihood for many of the local residents. The population of Timber Cove is largely white, with a median household income of $60,000 and a median age of 44.
Common Questions
What is Per Capita Income in Timber Cove?
Per Capita income in Timber Cove is $49,345.
What is the Median Family Income in Timber Cove?
Median Family Income in Timber Cove is $77,500.
What is the Median Household income in Timber Cove?
Median Household Income in Timber Cove is $87,500.
What is Income or Wage Gap in Timber Cove?
Income or Wage Gap in Timber Cove is 60.9%.
Women in Timber Cove earn 39.1 cents for every dollar earned by a man.
What is Inequality or Gini Index in Timber Cove?
Inequality or Gini Index in Timber Cove is 0.33.
What is the Total Population of Timber Cove?
Total Population of Timber Cove is 235.
What is the Total Male Population of Timber Cove?
Total Male Population of Timber Cove is 130.
What is the Total Female Population of Timber Cove?
Total Female Population of Timber Cove is 105.
What is the Ratio of Males per 100 Females in Timber Cove?
There are 123.81 Males per 100 Females in Timber Cove.
What is the Ratio of Females per 100 Males in Timber Cove?
There are 80.77 Females per 100 Males in Timber Cove.
What is the Median Population Age in Timber Cove?
Median Population Age in Timber Cove is 54.6 Years.
What is the Average Family Size in Timber Cove
Average Family Size in Timber Cove is 2.7 People.
What is the Average Household Size in Timber Cove
Average Household Size in Timber Cove is 2.4 People.
How Large is the Labor Force in Timber Cove?
There are 122 People in the Labor Forcein in Timber Cove.
What is the Percentage of People in the Labor Force in Timber Cove?
55.2% of People are in the Labor Force in Timber Cove.
What is the Unemployment Rate in Timber Cove?
Unemployment Rate in Timber Cove is 4.9%.