Cities with the Highest Percentage of Population Employed in Life, Physical & Social Science in the United States
RELATED REPORTS & OPTIONS
Life, Physical & Social Science
United States
Compare Cities
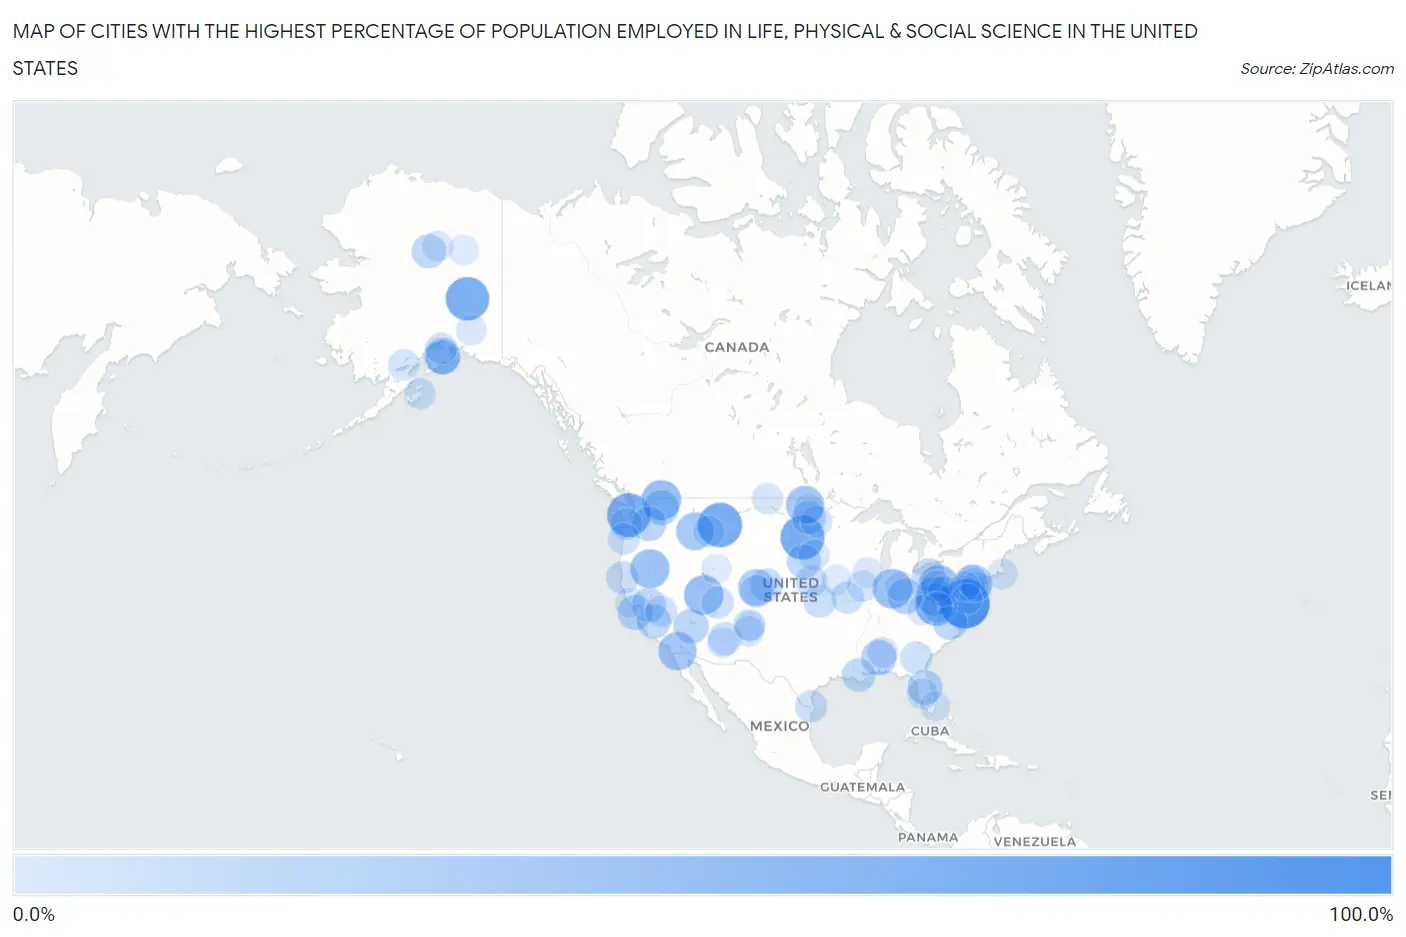
Map of Cities with the Highest Percentage of Population Employed in Life, Physical & Social Science in the United States
0.0%
100.0%
Cities with the Highest Percentage of Population Employed in Life, Physical & Social Science in the United States
| City | % Employed | vs State | vs National | |
| 1. | Wheeler | 100.0% | 1.3%(+98.7)#1 | 1.1%(+98.9)#1 |
| 2. | Elliott | 100.0% | 2.2%(+97.8)#1 | 1.1%(+98.9)#2 |
| 3. | Martinsdale | 76.7% | 1.5%(+75.2)#1 | 1.1%(+75.6)#3 |
| 4. | Chelsea | 75.7% | 1.2%(+74.5)#1 | 1.1%(+74.6)#4 |
| 5. | Whitestone | 73.7% | 2.0%(+71.6)#1 | 1.1%(+72.6)#5 |
| 6. | Hoodsport | 73.0% | 1.3%(+71.7)#2 | 1.1%(+71.9)#6 |
| 7. | Huntersville | 63.6% | 0.95%(+62.7)#1 | 1.1%(+62.5)#7 |
| 8. | Harrison City | 57.1% | 1.2%(+55.9)#1 | 1.1%(+56.1)#8 |
| 9. | Malo | 57.1% | 1.3%(+55.8)#3 | 1.1%(+56.1)#9 |
| 10. | North Crows Nest | 55.8% | 0.83%(+55.0)#1 | 1.1%(+54.7)#10 |
| 11. | Oasis | 55.0% | 1.0%(+54.0)#1 | 1.1%(+53.9)#11 |
| 12. | New Pine Creek | 54.3% | 1.3%(+53.0)#1 | 1.1%(+53.2)#12 |
| 13. | Century | 54.2% | 0.95%(+53.2)#2 | 1.1%(+53.1)#13 |
| 14. | Bolivar | 54.2% | 0.76%(+53.4)#1 | 1.1%(+53.1)#14 |
| 15. | Mentor | 53.8% | 0.94%(+52.9)#1 | 1.1%(+52.8)#15 |
| 16. | Mount Laguna | 50.0% | 1.3%(+48.7)#1 | 1.1%(+48.9)#16 |
| 17. | Lawton | 50.0% | 0.93%(+49.1)#1 | 1.1%(+48.9)#17 |
| 18. | Sula | 47.8% | 1.5%(+46.3)#2 | 1.1%(+46.7)#18 |
| 19. | Harperville | 47.6% | 0.76%(+46.9)#2 | 1.1%(+46.5)#19 |
| 20. | Blawenburg | 47.5% | 1.3%(+46.2)#1 | 1.1%(+46.4)#20 |
| 21. | Winterville | 44.4% | 0.76%(+43.7)#3 | 1.1%(+43.4)#21 |
| 22. | Fort Klamath | 43.8% | 1.3%(+42.5)#2 | 1.1%(+42.7)#22 |
| 23. | New Boston | 42.9% | 1.1%(+41.7)#1 | 1.1%(+41.8)#23 |
| 24. | Glendale | 42.9% | 1.3%(+41.5)#1 | 1.1%(+41.8)#24 |
| 25. | Crown Point | 42.9% | 2.0%(+40.8)#2 | 1.1%(+41.8)#25 |
| 26. | Plainville | 39.3% | 0.90%(+38.4)#1 | 1.1%(+38.2)#26 |
| 27. | Nanafalia | 38.5% | 0.74%(+37.7)#1 | 1.1%(+37.4)#27 |
| 28. | Keller | 38.0% | 1.3%(+36.7)#4 | 1.1%(+36.9)#28 |
| 29. | White Hills | 36.6% | 0.83%(+35.8)#1 | 1.1%(+35.5)#29 |
| 30. | Loma Mar | 35.9% | 1.3%(+34.6)#2 | 1.1%(+34.8)#30 |
| 31. | Bay Lake | 35.9% | 0.67%(+35.2)#1 | 1.1%(+34.8)#31 |
| 32. | Parker | 35.5% | 1.3%(+34.2)#5 | 1.1%(+34.4)#32 |
| 33. | Centerville | 34.5% | 1.1%(+33.5)#1 | 1.1%(+33.5)#33 |
| 34. | Haines Falls | 33.3% | 1.1%(+32.3)#1 | 1.1%(+32.2)#34 |
| 35. | Bristow | 33.3% | 1.1%(+32.3)#1 | 1.1%(+32.2)#35 |
| 36. | Evansville | 33.3% | 2.0%(+31.3)#3 | 1.1%(+32.2)#36 |
| 37. | Sibley | 33.3% | 0.93%(+32.4)#2 | 1.1%(+32.2)#37 |
| 38. | Avery | 33.0% | 1.3%(+31.7)#3 | 1.1%(+31.9)#38 |
| 39. | Grangeville | 32.9% | 1.3%(+31.6)#4 | 1.1%(+31.9)#39 |
| 40. | Primrose | 32.4% | 2.0%(+30.3)#4 | 1.1%(+31.3)#40 |
| 41. | Princeton | 31.6% | 1.1%(+30.5)#2 | 1.1%(+30.5)#41 |
| 42. | Gilchrist | 31.5% | 1.3%(+30.2)#3 | 1.1%(+30.4)#42 |
| 43. | Moonshine | 30.6% | 0.98%(+29.6)#1 | 1.1%(+29.5)#43 |
| 44. | Grayson | 30.6% | 0.98%(+29.6)#1 | 1.1%(+29.5)#44 |
| 45. | Parkman | 30.0% | 0.90%(+29.1)#2 | 1.1%(+28.9)#45 |
| 46. | Blue Sky | 28.6% | 1.3%(+27.3)#2 | 1.1%(+27.5)#46 |
| 47. | Vernon | 28.2% | 0.83%(+27.3)#2 | 1.1%(+27.1)#47 |
| 48. | Mount Judea | 27.6% | 0.65%(+26.9)#1 | 1.1%(+26.5)#48 |
| 49. | Dunlap | 27.6% | 0.94%(+26.6)#2 | 1.1%(+26.5)#49 |
| 50. | Big Lagoon | 27.3% | 1.3%(+26.0)#5 | 1.1%(+26.2)#50 |
| 51. | Idledale | 27.0% | 1.3%(+25.7)#3 | 1.1%(+25.9)#51 |
| 52. | Hanksville | 25.3% | 1.0%(+24.2)#2 | 1.1%(+24.2)#52 |
| 53. | Scotland | 25.0% | 0.91%(+24.1)#1 | 1.1%(+23.9)#53 |
| 54. | Maverick Mountain | 25.0% | 1.5%(+23.5)#3 | 1.1%(+23.9)#54 |
| 55. | Wooldridge | 25.0% | 0.98%(+24.0)#2 | 1.1%(+23.9)#55 |
| 56. | Arroyo Colorado Estates | 24.3% | 0.84%(+23.5)#1 | 1.1%(+23.2)#56 |
| 57. | Mccool Junction | 24.2% | 1.1%(+23.2)#3 | 1.1%(+23.1)#57 |
| 58. | Lebam | 23.5% | 1.3%(+22.2)#6 | 1.1%(+22.4)#58 |
| 59. | Swall Meadows | 23.3% | 1.3%(+22.0)#6 | 1.1%(+22.2)#59 |
| 60. | Van Voorhis | 23.1% | 1.2%(+21.9)#2 | 1.1%(+22.0)#60 |
| 61. | Neskowin | 23.0% | 1.3%(+21.7)#4 | 1.1%(+21.9)#61 |
| 62. | Hope | 22.9% | 2.0%(+20.9)#5 | 1.1%(+21.8)#62 |
| 63. | Groverton | 22.2% | 0.83%(+21.4)#2 | 1.1%(+21.1)#63 |
| 64. | Cardwell | 22.2% | 1.5%(+20.7)#4 | 1.1%(+21.1)#64 |
| 65. | Los Alamos | 21.7% | 1.7%(+20.0)#1 | 1.1%(+20.6)#65 |
| 66. | Skillman | 21.5% | 1.3%(+20.3)#2 | 1.1%(+20.5)#66 |
| 67. | Grahamtown | 21.5% | 2.2%(+19.3)#2 | 1.1%(+20.4)#67 |
| 68. | Prairie Rose | 21.4% | 0.93%(+20.5)#3 | 1.1%(+20.3)#68 |
| 69. | Iliamna | 21.4% | 2.0%(+19.4)#6 | 1.1%(+20.3)#69 |
| 70. | Browning | 20.9% | 0.98%(+20.0)#1 | 1.1%(+19.8)#70 |
| 71. | Fortuna | 20.8% | 0.93%(+19.9)#4 | 1.1%(+19.7)#71 |
| 72. | Womens Bay | 20.6% | 2.0%(+18.5)#7 | 1.1%(+19.5)#72 |
| 73. | White Branch | 20.3% | 0.98%(+19.3)#3 | 1.1%(+19.2)#73 |
| 74. | Bridgeville | 20.3% | 1.3%(+19.0)#3 | 1.1%(+19.2)#74 |
| 75. | Greensboro | 20.2% | 0.74%(+19.5)#2 | 1.1%(+19.1)#75 |
| 76. | Fort Green | 20.0% | 0.67%(+19.3)#2 | 1.1%(+18.9)#76 |
| 77. | Oahe Acres | 19.7% | 1.2%(+18.6)#2 | 1.1%(+18.6)#77 |
| 78. | Low Moor | 19.7% | 1.3%(+18.4)#1 | 1.1%(+18.6)#78 |
| 79. | Monroe | 19.1% | 1.2%(+17.9)#3 | 1.1%(+18.0)#79 |
| 80. | Sandia Park | 19.0% | 1.7%(+17.3)#2 | 1.1%(+18.0)#80 |
| 81. | Coldfoot | 18.5% | 2.0%(+16.5)#8 | 1.1%(+17.4)#81 |
| 82. | Deer Grove | 18.5% | 0.98%(+17.5)#2 | 1.1%(+17.4)#82 |
| 83. | Pawlet | 18.5% | 1.2%(+17.3)#1 | 1.1%(+17.4)#83 |
| 84. | New Market | 18.4% | 0.98%(+17.4)#4 | 1.1%(+17.3)#84 |
| 85. | Gulkana | 18.2% | 2.0%(+16.1)#9 | 1.1%(+17.1)#85 |
| 86. | White Rock | 18.2% | 1.7%(+16.5)#3 | 1.1%(+17.1)#86 |
| 87. | Woods Hole | 18.1% | 2.4%(+15.7)#1 | 1.1%(+17.0)#87 |
| 88. | Rainbow City | 17.7% | 0.83%(+16.9)#3 | 1.1%(+16.7)#88 |
| 89. | Niagara | 17.6% | 0.93%(+16.7)#5 | 1.1%(+16.6)#89 |
| 90. | Henderson | 17.5% | 0.65%(+16.8)#2 | 1.1%(+16.4)#90 |
| 91. | Justice | 17.5% | 0.95%(+16.6)#3 | 1.1%(+16.4)#91 |
| 92. | Vista Center | 17.5% | 1.3%(+16.2)#4 | 1.1%(+16.4)#92 |
| 93. | Goodville | 17.3% | 1.2%(+16.1)#3 | 1.1%(+16.2)#93 |
| 94. | Boulevard Gardens | 17.2% | 0.67%(+16.5)#3 | 1.1%(+16.1)#94 |
| 95. | Venetie | 17.1% | 2.0%(+15.0)#10 | 1.1%(+16.0)#95 |
| 96. | Farmland | 17.1% | 0.83%(+16.2)#3 | 1.1%(+16.0)#96 |
| 97. | Farmington | 17.0% | 1.5%(+15.5)#1 | 1.1%(+16.0)#97 |
| 98. | Taylor | 16.9% | 1.4%(+15.5)#1 | 1.1%(+15.8)#98 |
| 99. | Ellston | 16.7% | 0.95%(+15.7)#1 | 1.1%(+15.6)#99 |
| 100. | Bodega | 16.5% | 1.3%(+15.2)#7 | 1.1%(+15.4)#100 |
Common Questions
What are the Top 10 Cities with the Highest Percentage of Population Employed in Life, Physical & Social Science in the United States?
Top 10 Cities with the Highest Percentage of Population Employed in Life, Physical & Social Science in the United States are:
#1
100.0%
#2
76.7%
#3
75.7%
#4
73.7%
#5
73.0%
#6
63.6%
#7
57.1%
#8
57.1%
#9
55.8%
#10
55.0%
What city has the Highest Percentage of Population Employed in Life, Physical & Social Science in the United States?
Elliott has the Highest Percentage of Population Employed in Life, Physical & Social Science in the United States with 100.0%.
What is the Percentage of Population Employed in Life, Physical & Social Science in the United States?
Percentage of Population Employed in Life, Physical & Social Science in the United States is 1.1%.