Cities with the Highest Percentage of Population Employed in Life, Physical & Social Science in Georgia
RELATED REPORTS & OPTIONS
Life, Physical & Social Science
Georgia
Compare Cities
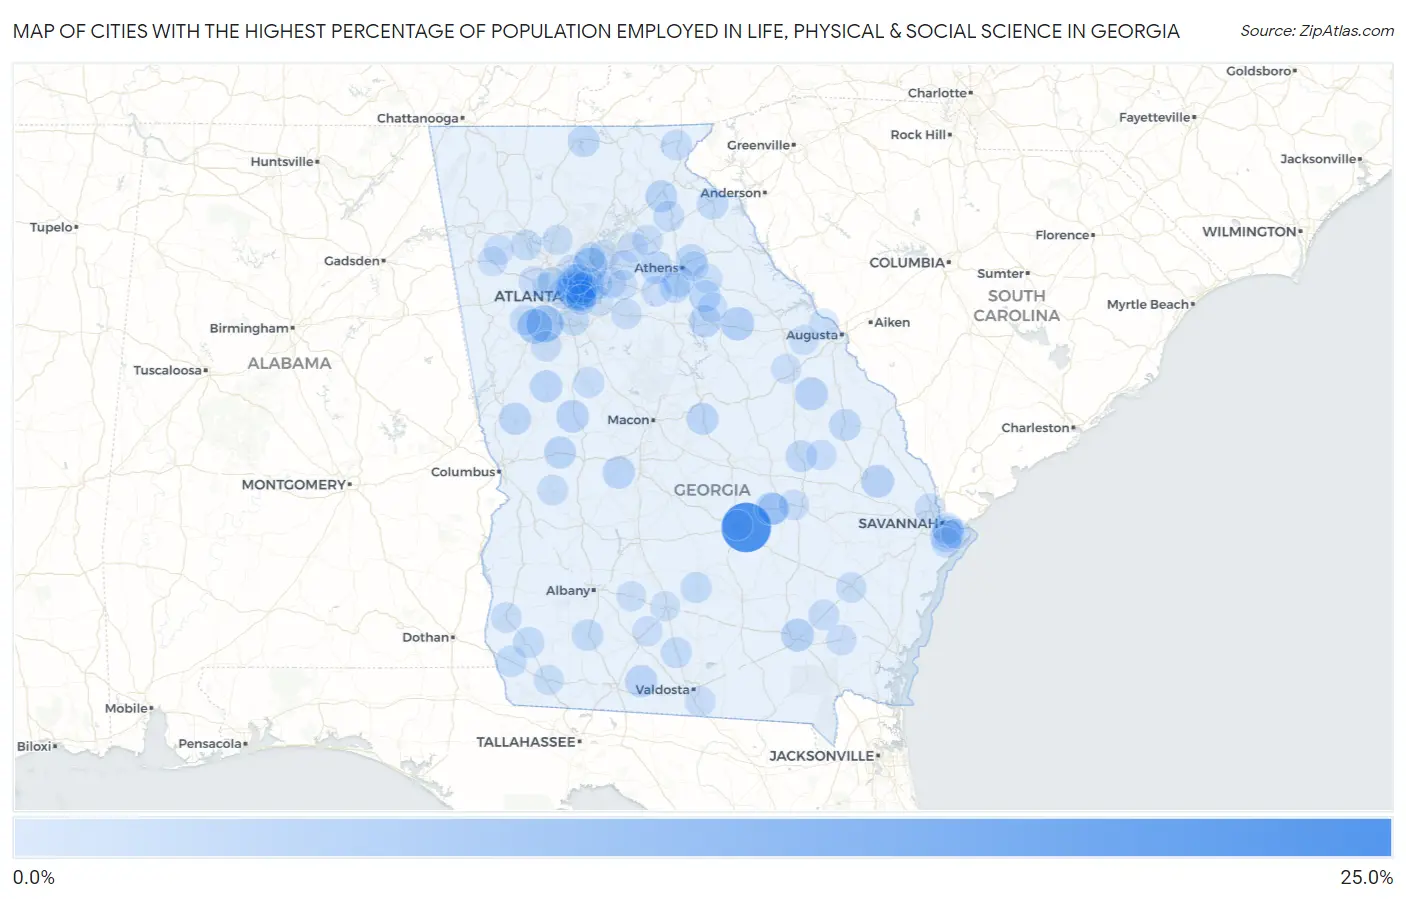
Map of Cities with the Highest Percentage of Population Employed in Life, Physical & Social Science in Georgia
0.0%
25.0%
Cities with the Highest Percentage of Population Employed in Life, Physical & Social Science in Georgia
| City | % Employed | vs State | vs National | |
| 1. | Scotland | 25.0% | 0.91%(+24.1)#1 | 1.1%(+23.9)#53 |
| 2. | Fairburn | 9.2% | 0.91%(+8.33)#2 | 1.1%(+8.15)#270 |
| 3. | Jekyll Island | 7.8% | 0.91%(+6.91)#3 | 1.1%(+6.73)#355 |
| 4. | Palmetto | 6.6% | 0.91%(+5.73)#4 | 1.1%(+5.56)#479 |
| 5. | Berkeley Lake | 6.5% | 0.91%(+5.63)#5 | 1.1%(+5.46)#495 |
| 6. | Druid Hills | 6.4% | 0.91%(+5.52)#6 | 1.1%(+5.34)#509 |
| 7. | North Decatur | 6.4% | 0.91%(+5.48)#7 | 1.1%(+5.31)#515 |
| 8. | Decatur | 6.1% | 0.91%(+5.14)#8 | 1.1%(+4.96)#576 |
| 9. | Crawfordville | 5.2% | 0.91%(+4.30)#9 | 1.1%(+4.13)#740 |
| 10. | North Druid Hills | 5.1% | 0.91%(+4.20)#10 | 1.1%(+4.02)#764 |
| 11. | Deenwood | 4.7% | 0.91%(+3.76)#11 | 1.1%(+3.58)#882 |
| 12. | Vidette | 4.5% | 0.91%(+3.63)#12 | 1.1%(+3.45)#931 |
| 13. | Mount Vernon | 4.5% | 0.91%(+3.60)#13 | 1.1%(+3.42)#947 |
| 14. | Brooklet | 4.5% | 0.91%(+3.59)#14 | 1.1%(+3.42)#950 |
| 15. | Lincoln Park | 4.4% | 0.91%(+3.50)#15 | 1.1%(+3.32)#992 |
| 16. | Marshallville | 4.1% | 0.91%(+3.21)#16 | 1.1%(+3.03)#1,109 |
| 17. | Barwick | 4.0% | 0.91%(+3.09)#17 | 1.1%(+2.91)#1,167 |
| 18. | Statham | 4.0% | 0.91%(+3.06)#18 | 1.1%(+2.88)#1,188 |
| 19. | Isle Of Hope | 3.8% | 0.91%(+2.91)#19 | 1.1%(+2.73)#1,264 |
| 20. | Pine Mountain | 3.7% | 0.91%(+2.80)#20 | 1.1%(+2.63)#1,314 |
| 21. | Gay | 3.7% | 0.91%(+2.79)#21 | 1.1%(+2.61)#1,329 |
| 22. | Baldwin | 3.6% | 0.91%(+2.66)#22 | 1.1%(+2.48)#1,414 |
| 23. | Junction City | 3.6% | 0.91%(+2.66)#23 | 1.1%(+2.48)#1,418 |
| 24. | Godfrey | 3.6% | 0.91%(+2.66)#24 | 1.1%(+2.48)#1,423 |
| 25. | Avondale Estates | 3.6% | 0.91%(+2.64)#25 | 1.1%(+2.46)#1,435 |
| 26. | Dutch Island | 3.6% | 0.91%(+2.64)#26 | 1.1%(+2.46)#1,436 |
| 27. | Mcintyre | 3.5% | 0.91%(+2.60)#27 | 1.1%(+2.42)#1,467 |
| 28. | Greensboro | 3.5% | 0.91%(+2.57)#28 | 1.1%(+2.39)#1,497 |
| 29. | Millen | 3.3% | 0.91%(+2.43)#29 | 1.1%(+2.25)#1,578 |
| 30. | Athens-Clarke County Unified Government (Balance) | 3.3% | 0.91%(+2.42)#30 | 1.1%(+2.24)#1,592 |
| 31. | Swainsboro | 3.3% | 0.91%(+2.34)#31 | 1.1%(+2.16)#1,654 |
| 32. | Morganton | 3.2% | 0.91%(+2.29)#32 | 1.1%(+2.11)#1,698 |
| 33. | Maxeys | 3.1% | 0.91%(+2.23)#33 | 1.1%(+2.05)#1,750 |
| 34. | Hull | 3.1% | 0.91%(+2.21)#34 | 1.1%(+2.03)#1,767 |
| 35. | Pine Lake | 3.1% | 0.91%(+2.15)#35 | 1.1%(+1.98)#1,827 |
| 36. | Camilla | 3.1% | 0.91%(+2.14)#36 | 1.1%(+1.96)#1,844 |
| 37. | Watkinsville | 2.9% | 0.91%(+2.01)#37 | 1.1%(+1.83)#1,948 |
| 38. | Lavonia | 2.8% | 0.91%(+1.91)#38 | 1.1%(+1.73)#2,039 |
| 39. | Ailey | 2.8% | 0.91%(+1.90)#39 | 1.1%(+1.73)#2,056 |
| 40. | Scottdale | 2.8% | 0.91%(+1.89)#40 | 1.1%(+1.71)#2,084 |
| 41. | Mountain Park | 2.8% | 0.91%(+1.88)#41 | 1.1%(+1.70)#2,092 |
| 42. | Donalsonville | 2.6% | 0.91%(+1.73)#42 | 1.1%(+1.56)#2,290 |
| 43. | Thunderbolt | 2.6% | 0.91%(+1.71)#43 | 1.1%(+1.53)#2,324 |
| 44. | Colquitt | 2.6% | 0.91%(+1.67)#44 | 1.1%(+1.49)#2,377 |
| 45. | Morrow | 2.5% | 0.91%(+1.59)#45 | 1.1%(+1.41)#2,517 |
| 46. | Ocilla | 2.5% | 0.91%(+1.58)#46 | 1.1%(+1.40)#2,528 |
| 47. | Adel | 2.3% | 0.91%(+1.42)#47 | 1.1%(+1.24)#2,811 |
| 48. | Brookhaven | 2.3% | 0.91%(+1.37)#48 | 1.1%(+1.20)#2,868 |
| 49. | Bishop | 2.3% | 0.91%(+1.36)#49 | 1.1%(+1.18)#2,899 |
| 50. | Tucker | 2.3% | 0.91%(+1.36)#50 | 1.1%(+1.18)#2,907 |
| 51. | Homer | 2.3% | 0.91%(+1.35)#51 | 1.1%(+1.18)#2,913 |
| 52. | Tiger | 2.2% | 0.91%(+1.33)#52 | 1.1%(+1.16)#2,951 |
| 53. | Emerson | 2.2% | 0.91%(+1.33)#53 | 1.1%(+1.15)#2,959 |
| 54. | Milner | 2.2% | 0.91%(+1.27)#54 | 1.1%(+1.09)#3,070 |
| 55. | Clarkston | 2.2% | 0.91%(+1.25)#55 | 1.1%(+1.07)#3,113 |
| 56. | Belvedere Park | 2.1% | 0.91%(+1.18)#56 | 1.1%(+1.01)#3,234 |
| 57. | Chattahoochee Hills | 2.1% | 0.91%(+1.14)#57 | 1.1%(+0.960)#3,318 |
| 58. | Patterson | 2.0% | 0.91%(+1.13)#58 | 1.1%(+0.950)#3,339 |
| 59. | Blakely | 2.0% | 0.91%(+1.11)#59 | 1.1%(+0.932)#3,379 |
| 60. | Buena Vista | 2.0% | 0.91%(+1.06)#60 | 1.1%(+0.886)#3,481 |
| 61. | Port Wentworth | 2.0% | 0.91%(+1.05)#61 | 1.1%(+0.867)#3,526 |
| 62. | Pendergrass | 1.9% | 0.91%(+1.01)#62 | 1.1%(+0.832)#3,597 |
| 63. | Jesup | 1.9% | 0.91%(+0.994)#63 | 1.1%(+0.816)#3,632 |
| 64. | Atlanta | 1.9% | 0.91%(+0.967)#64 | 1.1%(+0.789)#3,717 |
| 65. | Good Hope | 1.9% | 0.91%(+0.951)#65 | 1.1%(+0.772)#3,761 |
| 66. | Nahunta | 1.8% | 0.91%(+0.936)#66 | 1.1%(+0.758)#3,803 |
| 67. | Dasher | 1.8% | 0.91%(+0.913)#67 | 1.1%(+0.735)#3,860 |
| 68. | Powder Springs | 1.8% | 0.91%(+0.888)#68 | 1.1%(+0.710)#3,921 |
| 69. | Oxford | 1.8% | 0.91%(+0.885)#69 | 1.1%(+0.707)#3,930 |
| 70. | Twin City | 1.8% | 0.91%(+0.864)#70 | 1.1%(+0.686)#3,987 |
| 71. | Snellville | 1.8% | 0.91%(+0.849)#71 | 1.1%(+0.671)#4,036 |
| 72. | Vidalia | 1.7% | 0.91%(+0.823)#72 | 1.1%(+0.645)#4,108 |
| 73. | Peachtree City | 1.7% | 0.91%(+0.783)#73 | 1.1%(+0.605)#4,227 |
| 74. | Taylorsville | 1.7% | 0.91%(+0.782)#74 | 1.1%(+0.604)#4,235 |
| 75. | Norman Park | 1.7% | 0.91%(+0.754)#75 | 1.1%(+0.576)#4,306 |
| 76. | Holly Springs | 1.6% | 0.91%(+0.733)#76 | 1.1%(+0.555)#4,368 |
| 77. | Suwanee | 1.6% | 0.91%(+0.688)#77 | 1.1%(+0.510)#4,492 |
| 78. | Braselton | 1.6% | 0.91%(+0.662)#78 | 1.1%(+0.484)#4,579 |
| 79. | Sandy Springs | 1.6% | 0.91%(+0.659)#79 | 1.1%(+0.481)#4,586 |
| 80. | Mcrae Helena | 1.5% | 0.91%(+0.626)#80 | 1.1%(+0.448)#4,689 |
| 81. | Skidaway Island | 1.5% | 0.91%(+0.619)#81 | 1.1%(+0.441)#4,722 |
| 82. | Bainbridge | 1.5% | 0.91%(+0.606)#82 | 1.1%(+0.428)#4,774 |
| 83. | Sylvester | 1.5% | 0.91%(+0.563)#83 | 1.1%(+0.385)#4,949 |
| 84. | Evans | 1.5% | 0.91%(+0.558)#84 | 1.1%(+0.380)#4,969 |
| 85. | Chamblee | 1.5% | 0.91%(+0.557)#85 | 1.1%(+0.379)#4,977 |
| 86. | Lithonia | 1.5% | 0.91%(+0.543)#86 | 1.1%(+0.365)#5,035 |
| 87. | Crawford | 1.4% | 0.91%(+0.486)#87 | 1.1%(+0.308)#5,246 |
| 88. | Harlem | 1.4% | 0.91%(+0.470)#88 | 1.1%(+0.292)#5,297 |
| 89. | Mableton | 1.4% | 0.91%(+0.444)#89 | 1.1%(+0.266)#5,413 |
| 90. | Rockmart | 1.3% | 0.91%(+0.432)#90 | 1.1%(+0.254)#5,469 |
| 91. | Stapleton | 1.3% | 0.91%(+0.421)#91 | 1.1%(+0.242)#5,513 |
| 92. | Dacula | 1.3% | 0.91%(+0.419)#92 | 1.1%(+0.241)#5,528 |
| 93. | Smyrna | 1.3% | 0.91%(+0.409)#93 | 1.1%(+0.231)#5,569 |
| 94. | Tifton | 1.3% | 0.91%(+0.399)#94 | 1.1%(+0.221)#5,618 |
| 95. | Winterville | 1.3% | 0.91%(+0.391)#95 | 1.1%(+0.213)#5,655 |
| 96. | Wilmington Island | 1.3% | 0.91%(+0.388)#96 | 1.1%(+0.210)#5,671 |
| 97. | Candler Mcafee | 1.3% | 0.91%(+0.387)#97 | 1.1%(+0.209)#5,672 |
| 98. | Loganville | 1.3% | 0.91%(+0.377)#98 | 1.1%(+0.199)#5,724 |
| 99. | Johns Creek | 1.3% | 0.91%(+0.375)#99 | 1.1%(+0.197)#5,731 |
| 100. | Woodville | 1.3% | 0.91%(+0.369)#100 | 1.1%(+0.191)#5,760 |
Common Questions
What are the Top 10 Cities with the Highest Percentage of Population Employed in Life, Physical & Social Science in Georgia?
Top 10 Cities with the Highest Percentage of Population Employed in Life, Physical & Social Science in Georgia are:
#1
25.0%
#2
9.2%
#3
6.6%
#4
6.5%
#5
6.4%
#6
6.4%
#7
6.1%
#8
5.2%
#9
5.1%
#10
4.7%
What city has the Highest Percentage of Population Employed in Life, Physical & Social Science in Georgia?
Scotland has the Highest Percentage of Population Employed in Life, Physical & Social Science in Georgia with 25.0%.
What is the Percentage of Population Employed in Life, Physical & Social Science in the State of Georgia?
Percentage of Population Employed in Life, Physical & Social Science in Georgia is 0.91%.
What is the Percentage of Population Employed in Life, Physical & Social Science in the United States?
Percentage of Population Employed in Life, Physical & Social Science in the United States is 1.1%.