Cities with the Highest Percentage of Population Employed in Life, Physical & Social Science in Nebraska
RELATED REPORTS & OPTIONS
Life, Physical & Social Science
Nebraska
Compare Cities
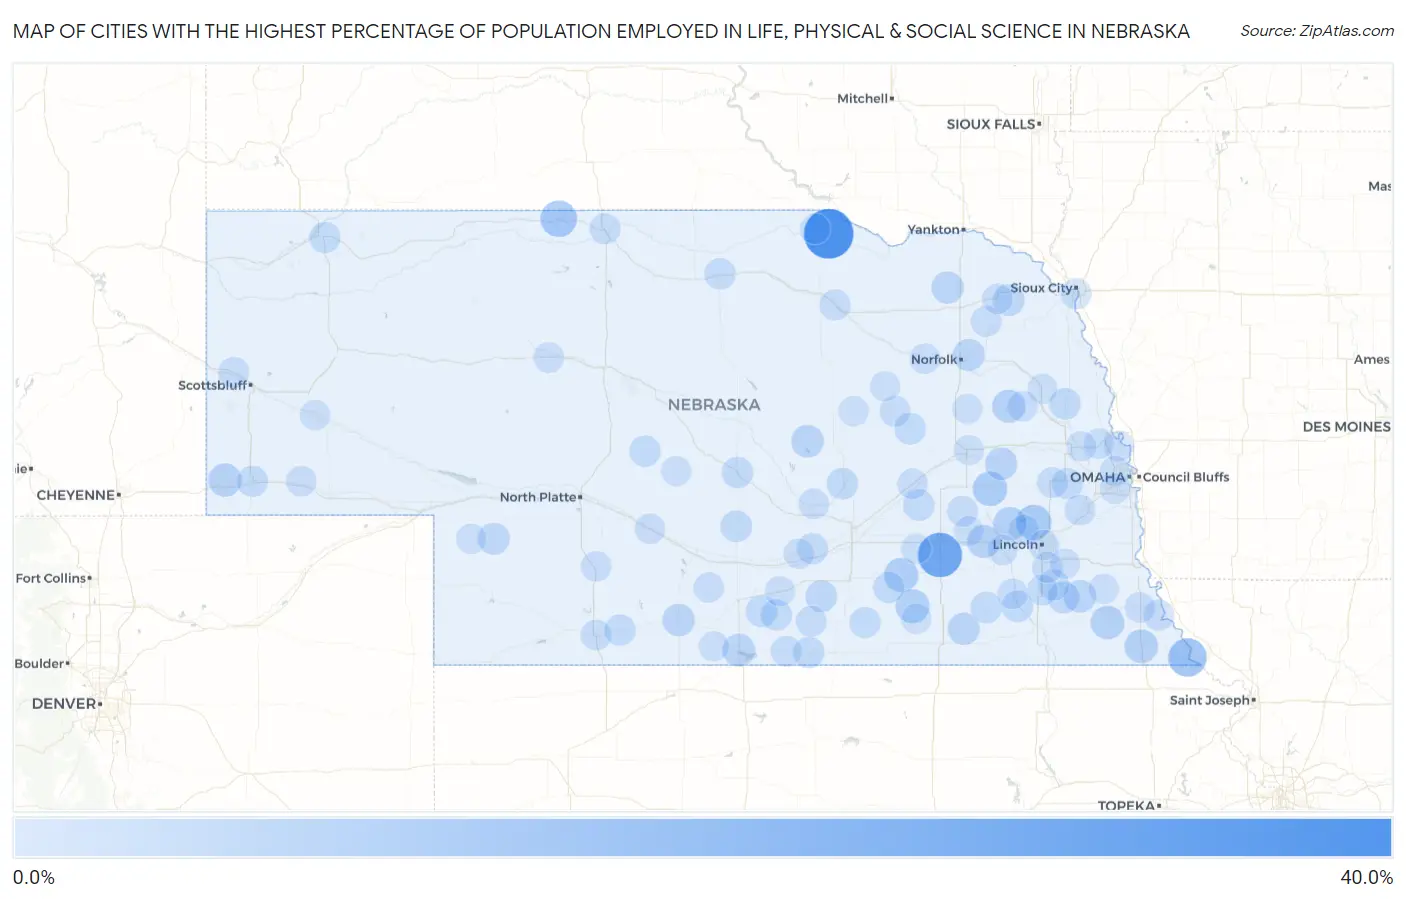
Map of Cities with the Highest Percentage of Population Employed in Life, Physical & Social Science in Nebraska
0.0%
40.0%
Cities with the Highest Percentage of Population Employed in Life, Physical & Social Science in Nebraska
| City | % Employed | vs State | vs National | |
| 1. | Bristow | 33.3% | 1.1%(+32.3)#1 | 1.1%(+32.2)#35 |
| 2. | Princeton | 31.6% | 1.1%(+30.5)#2 | 1.1%(+30.5)#41 |
| 3. | Mccool Junction | 24.2% | 1.1%(+23.2)#3 | 1.1%(+23.1)#57 |
| 4. | Rulo | 14.1% | 1.1%(+13.0)#4 | 1.1%(+13.0)#140 |
| 5. | Kilgore | 11.1% | 1.1%(+10.1)#5 | 1.1%(+10.0)#196 |
| 6. | Raymond | 9.5% | 1.1%(+8.43)#6 | 1.1%(+8.39)#256 |
| 7. | Garrison | 8.0% | 1.1%(+6.95)#7 | 1.1%(+6.91)#345 |
| 8. | Saronville | 7.7% | 1.1%(+6.64)#8 | 1.1%(+6.60)#369 |
| 9. | Ong | 7.1% | 1.1%(+6.09)#9 | 1.1%(+6.05)#418 |
| 10. | Elk Creek | 6.6% | 1.1%(+5.50)#10 | 1.1%(+5.47)#492 |
| 11. | Dawson | 6.5% | 1.1%(+5.44)#11 | 1.1%(+5.40)#506 |
| 12. | Garland | 6.3% | 1.1%(+5.25)#12 | 1.1%(+5.21)#530 |
| 13. | Bushnell | 6.2% | 1.1%(+5.20)#13 | 1.1%(+5.16)#545 |
| 14. | Howells | 6.0% | 1.1%(+4.98)#14 | 1.1%(+4.94)#578 |
| 15. | Goehner | 5.8% | 1.1%(+4.78)#15 | 1.1%(+4.74)#612 |
| 16. | North Loup | 5.1% | 1.1%(+4.08)#16 | 1.1%(+4.04)#762 |
| 17. | Alma | 5.1% | 1.1%(+4.03)#17 | 1.1%(+3.99)#770 |
| 18. | Sterling | 5.0% | 1.1%(+3.98)#18 | 1.1%(+3.94)#781 |
| 19. | Arapahoe | 4.8% | 1.1%(+3.70)#19 | 1.1%(+3.66)#862 |
| 20. | Octavia | 4.6% | 1.1%(+3.55)#20 | 1.1%(+3.51)#913 |
| 21. | Wausa | 4.5% | 1.1%(+3.43)#21 | 1.1%(+3.39)#963 |
| 22. | Woodland Park | 4.3% | 1.1%(+3.29)#22 | 1.1%(+3.25)#1,026 |
| 23. | Alexandria | 4.3% | 1.1%(+3.20)#23 | 1.1%(+3.16)#1,059 |
| 24. | Madrid | 3.9% | 1.1%(+2.83)#24 | 1.1%(+2.79)#1,235 |
| 25. | Dixon | 3.8% | 1.1%(+2.79)#25 | 1.1%(+2.76)#1,253 |
| 26. | Adams | 3.8% | 1.1%(+2.78)#26 | 1.1%(+2.74)#1,260 |
| 27. | Holstein | 3.6% | 1.1%(+2.58)#27 | 1.1%(+2.55)#1,383 |
| 28. | St Edward | 3.5% | 1.1%(+2.49)#28 | 1.1%(+2.46)#1,441 |
| 29. | Miller | 3.4% | 1.1%(+2.40)#29 | 1.1%(+2.36)#1,519 |
| 30. | Wilcox | 3.4% | 1.1%(+2.36)#30 | 1.1%(+2.32)#1,541 |
| 31. | Western | 3.4% | 1.1%(+2.32)#31 | 1.1%(+2.28)#1,567 |
| 32. | Uehling | 3.3% | 1.1%(+2.20)#32 | 1.1%(+2.16)#1,653 |
| 33. | St Paul | 3.2% | 1.1%(+2.15)#33 | 1.1%(+2.11)#1,693 |
| 34. | Polk | 3.2% | 1.1%(+2.11)#34 | 1.1%(+2.07)#1,730 |
| 35. | Hildreth | 3.1% | 1.1%(+2.09)#35 | 1.1%(+2.05)#1,747 |
| 36. | De Witt | 3.1% | 1.1%(+2.08)#36 | 1.1%(+2.04)#1,754 |
| 37. | Riverton | 3.1% | 1.1%(+2.07)#37 | 1.1%(+2.03)#1,771 |
| 38. | Ansley | 3.1% | 1.1%(+2.05)#38 | 1.1%(+2.01)#1,795 |
| 39. | Arnold | 3.1% | 1.1%(+2.03)#39 | 1.1%(+1.99)#1,817 |
| 40. | Chadron | 3.0% | 1.1%(+1.97)#40 | 1.1%(+1.93)#1,874 |
| 41. | Bassett | 2.9% | 1.1%(+1.86)#41 | 1.1%(+1.82)#1,955 |
| 42. | Clay Center | 2.8% | 1.1%(+1.77)#42 | 1.1%(+1.73)#2,044 |
| 43. | Shelton | 2.8% | 1.1%(+1.71)#43 | 1.1%(+1.67)#2,138 |
| 44. | Mead | 2.6% | 1.1%(+1.59)#44 | 1.1%(+1.56)#2,289 |
| 45. | Indianola | 2.6% | 1.1%(+1.56)#45 | 1.1%(+1.52)#2,345 |
| 46. | Kimball | 2.6% | 1.1%(+1.54)#46 | 1.1%(+1.50)#2,368 |
| 47. | Lawrence | 2.6% | 1.1%(+1.51)#47 | 1.1%(+1.47)#2,407 |
| 48. | Valentine | 2.5% | 1.1%(+1.49)#48 | 1.1%(+1.46)#2,443 |
| 49. | Firth | 2.5% | 1.1%(+1.42)#49 | 1.1%(+1.38)#2,563 |
| 50. | Albion | 2.5% | 1.1%(+1.41)#50 | 1.1%(+1.37)#2,592 |
| 51. | Inman | 2.4% | 1.1%(+1.39)#51 | 1.1%(+1.35)#2,624 |
| 52. | Campbell | 2.4% | 1.1%(+1.37)#52 | 1.1%(+1.33)#2,646 |
| 53. | South Sioux City | 2.4% | 1.1%(+1.31)#53 | 1.1%(+1.27)#2,752 |
| 54. | Carroll | 2.4% | 1.1%(+1.31)#54 | 1.1%(+1.27)#2,755 |
| 55. | Wahoo | 2.4% | 1.1%(+1.30)#55 | 1.1%(+1.26)#2,767 |
| 56. | Gresham | 2.3% | 1.1%(+1.24)#56 | 1.1%(+1.20)#2,865 |
| 57. | Cortland | 2.3% | 1.1%(+1.23)#57 | 1.1%(+1.19)#2,878 |
| 58. | Mitchell | 2.3% | 1.1%(+1.22)#58 | 1.1%(+1.18)#2,895 |
| 59. | Nemaha | 2.3% | 1.1%(+1.22)#59 | 1.1%(+1.18)#2,905 |
| 60. | Ashland | 2.3% | 1.1%(+1.22)#60 | 1.1%(+1.18)#2,906 |
| 61. | Franklin | 2.2% | 1.1%(+1.15)#61 | 1.1%(+1.11)#3,041 |
| 62. | Roca | 2.2% | 1.1%(+1.12)#62 | 1.1%(+1.08)#3,089 |
| 63. | Mccook | 2.0% | 1.1%(+0.992)#63 | 1.1%(+0.954)#3,331 |
| 64. | Malcolm | 2.0% | 1.1%(+0.988)#64 | 1.1%(+0.950)#3,342 |
| 65. | Howard City Boelus | 1.9% | 1.1%(+0.871)#65 | 1.1%(+0.832)#3,602 |
| 66. | Clarks | 1.9% | 1.1%(+0.852)#66 | 1.1%(+0.814)#3,638 |
| 67. | Wilber | 1.9% | 1.1%(+0.805)#67 | 1.1%(+0.766)#3,775 |
| 68. | Gothenburg | 1.8% | 1.1%(+0.782)#68 | 1.1%(+0.744)#3,832 |
| 69. | Potter | 1.8% | 1.1%(+0.777)#69 | 1.1%(+0.738)#3,851 |
| 70. | Spencer | 1.8% | 1.1%(+0.766)#70 | 1.1%(+0.727)#3,877 |
| 71. | Bertrand | 1.8% | 1.1%(+0.728)#71 | 1.1%(+0.690)#3,979 |
| 72. | Gibbon | 1.8% | 1.1%(+0.698)#72 | 1.1%(+0.659)#4,070 |
| 73. | Dodge | 1.7% | 1.1%(+0.672)#73 | 1.1%(+0.633)#4,142 |
| 74. | Maywood | 1.7% | 1.1%(+0.672)#74 | 1.1%(+0.633)#4,145 |
| 75. | Fort Calhoun | 1.7% | 1.1%(+0.652)#75 | 1.1%(+0.614)#4,203 |
| 76. | Laurel | 1.7% | 1.1%(+0.646)#76 | 1.1%(+0.607)#4,221 |
| 77. | Mullen | 1.7% | 1.1%(+0.642)#77 | 1.1%(+0.604)#4,233 |
| 78. | Auburn | 1.6% | 1.1%(+0.576)#78 | 1.1%(+0.538)#4,411 |
| 79. | Meadow Grove | 1.6% | 1.1%(+0.535)#79 | 1.1%(+0.496)#4,536 |
| 80. | Henderson | 1.6% | 1.1%(+0.526)#80 | 1.1%(+0.488)#4,568 |
| 81. | Milford | 1.5% | 1.1%(+0.479)#81 | 1.1%(+0.441)#4,725 |
| 82. | Lincoln | 1.5% | 1.1%(+0.459)#82 | 1.1%(+0.420)#4,798 |
| 83. | Kennard | 1.5% | 1.1%(+0.446)#83 | 1.1%(+0.407)#4,849 |
| 84. | Utica | 1.5% | 1.1%(+0.423)#84 | 1.1%(+0.384)#4,951 |
| 85. | Bridgeport | 1.4% | 1.1%(+0.392)#85 | 1.1%(+0.354)#5,075 |
| 86. | Callaway | 1.4% | 1.1%(+0.386)#86 | 1.1%(+0.348)#5,100 |
| 87. | Davenport | 1.4% | 1.1%(+0.386)#87 | 1.1%(+0.348)#5,101 |
| 88. | Spalding | 1.4% | 1.1%(+0.376)#88 | 1.1%(+0.338)#5,153 |
| 89. | Stamford | 1.4% | 1.1%(+0.376)#89 | 1.1%(+0.338)#5,155 |
| 90. | Columbus | 1.4% | 1.1%(+0.306)#90 | 1.1%(+0.268)#5,402 |
| 91. | Petersburg | 1.4% | 1.1%(+0.305)#91 | 1.1%(+0.267)#5,411 |
| 92. | Grant | 1.3% | 1.1%(+0.265)#92 | 1.1%(+0.227)#5,594 |
| 93. | La Vista | 1.3% | 1.1%(+0.262)#93 | 1.1%(+0.224)#5,605 |
| 94. | Creston | 1.3% | 1.1%(+0.246)#94 | 1.1%(+0.208)#5,686 |
| 95. | Minden | 1.3% | 1.1%(+0.242)#95 | 1.1%(+0.204)#5,701 |
| 96. | Bennet | 1.3% | 1.1%(+0.207)#96 | 1.1%(+0.169)#5,865 |
| 97. | West Point | 1.2% | 1.1%(+0.195)#97 | 1.1%(+0.157)#5,907 |
| 98. | Omaha | 1.2% | 1.1%(+0.177)#98 | 1.1%(+0.138)#5,993 |
| 99. | Arlington | 1.2% | 1.1%(+0.176)#99 | 1.1%(+0.138)#5,996 |
| 100. | Cook | 1.2% | 1.1%(+0.167)#100 | 1.1%(+0.129)#6,035 |
Common Questions
What are the Top 10 Cities with the Highest Percentage of Population Employed in Life, Physical & Social Science in Nebraska?
Top 10 Cities with the Highest Percentage of Population Employed in Life, Physical & Social Science in Nebraska are:
#1
33.3%
#2
24.2%
#3
14.1%
#4
11.1%
#5
9.5%
#6
8.0%
#7
7.7%
#8
7.1%
#9
6.6%
#10
6.5%
What city has the Highest Percentage of Population Employed in Life, Physical & Social Science in Nebraska?
Bristow has the Highest Percentage of Population Employed in Life, Physical & Social Science in Nebraska with 33.3%.
What is the Percentage of Population Employed in Life, Physical & Social Science in the State of Nebraska?
Percentage of Population Employed in Life, Physical & Social Science in Nebraska is 1.1%.
What is the Percentage of Population Employed in Life, Physical & Social Science in the United States?
Percentage of Population Employed in Life, Physical & Social Science in the United States is 1.1%.