Cities with the Highest Percentage of Population Employed in Life, Physical & Social Science in North Carolina
RELATED REPORTS & OPTIONS
Life, Physical & Social Science
North Carolina
Compare Cities
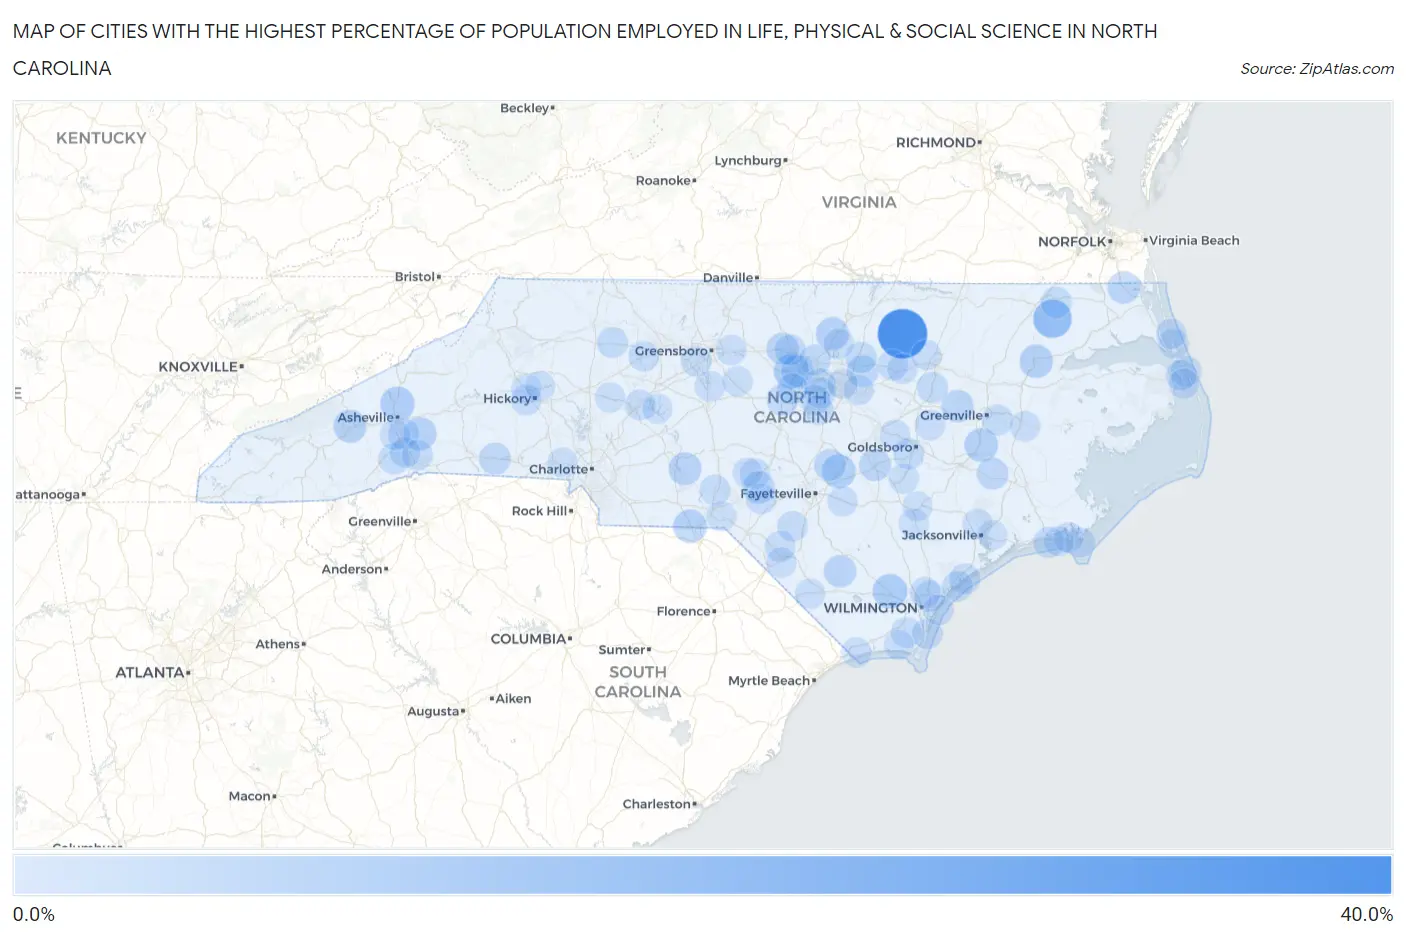
Map of Cities with the Highest Percentage of Population Employed in Life, Physical & Social Science in North Carolina
0.0%
40.0%
Cities with the Highest Percentage of Population Employed in Life, Physical & Social Science in North Carolina
| City | % Employed | vs State | vs National | |
| 1. | Centerville | 34.5% | 1.1%(+33.5)#1 | 1.1%(+33.5)#33 |
| 2. | Harrellsville | 15.3% | 1.1%(+14.2)#2 | 1.1%(+14.2)#112 |
| 3. | Carrboro | 9.3% | 1.1%(+8.22)#3 | 1.1%(+8.19)#266 |
| 4. | Riegelwood | 9.0% | 1.1%(+7.91)#4 | 1.1%(+7.88)#282 |
| 5. | Weaverville | 8.5% | 1.1%(+7.39)#5 | 1.1%(+7.36)#315 |
| 6. | Godwin | 7.8% | 1.1%(+6.75)#6 | 1.1%(+6.72)#356 |
| 7. | Grifton | 7.2% | 1.1%(+6.14)#7 | 1.1%(+6.11)#406 |
| 8. | Windsor | 7.1% | 1.1%(+5.99)#8 | 1.1%(+5.96)#427 |
| 9. | Mcfarlan | 7.0% | 1.1%(+5.91)#9 | 1.1%(+5.89)#438 |
| 10. | Stem | 6.8% | 1.1%(+5.73)#10 | 1.1%(+5.70)#459 |
| 11. | Gerton | 6.6% | 1.1%(+5.53)#11 | 1.1%(+5.50)#486 |
| 12. | Lake Junaluska | 6.3% | 1.1%(+5.28)#12 | 1.1%(+5.25)#524 |
| 13. | Mount Gilead | 5.9% | 1.1%(+4.87)#13 | 1.1%(+4.84)#594 |
| 14. | Clarkton | 5.7% | 1.1%(+4.68)#14 | 1.1%(+4.65)#623 |
| 15. | Chapel Hill | 5.5% | 1.1%(+4.44)#15 | 1.1%(+4.42)#665 |
| 16. | Moyock | 5.4% | 1.1%(+4.37)#16 | 1.1%(+4.35)#683 |
| 17. | Ashley Heights | 5.3% | 1.1%(+4.26)#17 | 1.1%(+4.23)#716 |
| 18. | Governors | 5.3% | 1.1%(+4.26)#18 | 1.1%(+4.23)#718 |
| 19. | Fountain | 5.1% | 1.1%(+4.06)#19 | 1.1%(+4.04)#761 |
| 20. | Newton Grove | 5.0% | 1.1%(+3.91)#20 | 1.1%(+3.88)#799 |
| 21. | Efland | 4.9% | 1.1%(+3.84)#21 | 1.1%(+3.82)#815 |
| 22. | Mooresboro | 4.7% | 1.1%(+3.59)#22 | 1.1%(+3.56)#890 |
| 23. | Linden | 4.4% | 1.1%(+3.38)#23 | 1.1%(+3.35)#974 |
| 24. | Cove City | 4.4% | 1.1%(+3.35)#24 | 1.1%(+3.33)#986 |
| 25. | Rolesville | 4.4% | 1.1%(+3.30)#25 | 1.1%(+3.27)#1,013 |
| 26. | Pittsboro | 3.9% | 1.1%(+2.84)#26 | 1.1%(+2.82)#1,221 |
| 27. | Youngsville | 3.6% | 1.1%(+2.54)#27 | 1.1%(+2.51)#1,399 |
| 28. | Durham | 3.6% | 1.1%(+2.52)#28 | 1.1%(+2.50)#1,407 |
| 29. | Gatesville | 3.5% | 1.1%(+2.48)#29 | 1.1%(+2.45)#1,445 |
| 30. | Yadkinville | 3.5% | 1.1%(+2.44)#30 | 1.1%(+2.41)#1,483 |
| 31. | Mar Mac | 3.4% | 1.1%(+2.37)#31 | 1.1%(+2.34)#1,527 |
| 32. | Morrisville | 3.4% | 1.1%(+2.35)#32 | 1.1%(+2.32)#1,540 |
| 33. | Cary | 3.4% | 1.1%(+2.34)#33 | 1.1%(+2.31)#1,549 |
| 34. | Etowah | 3.3% | 1.1%(+2.23)#34 | 1.1%(+2.20)#1,623 |
| 35. | Elm City | 3.2% | 1.1%(+2.17)#35 | 1.1%(+2.14)#1,670 |
| 36. | Hillsborough | 3.2% | 1.1%(+2.17)#36 | 1.1%(+2.14)#1,671 |
| 37. | Simpson | 3.2% | 1.1%(+2.12)#37 | 1.1%(+2.09)#1,708 |
| 38. | Pine Knoll Shores | 3.2% | 1.1%(+2.09)#38 | 1.1%(+2.06)#1,736 |
| 39. | Pembroke | 3.0% | 1.1%(+1.94)#39 | 1.1%(+1.91)#1,879 |
| 40. | Northchase | 3.0% | 1.1%(+1.90)#40 | 1.1%(+1.87)#1,915 |
| 41. | Nags Head | 3.0% | 1.1%(+1.89)#41 | 1.1%(+1.86)#1,923 |
| 42. | Royal Pines | 2.9% | 1.1%(+1.82)#42 | 1.1%(+1.80)#1,980 |
| 43. | Ellerbe | 2.8% | 1.1%(+1.71)#43 | 1.1%(+1.68)#2,126 |
| 44. | Fearrington Village | 2.8% | 1.1%(+1.70)#44 | 1.1%(+1.68)#2,128 |
| 45. | Lake Royale | 2.8% | 1.1%(+1.70)#45 | 1.1%(+1.67)#2,134 |
| 46. | East Spencer | 2.7% | 1.1%(+1.68)#46 | 1.1%(+1.65)#2,164 |
| 47. | Skippers Corner | 2.7% | 1.1%(+1.66)#47 | 1.1%(+1.63)#2,196 |
| 48. | Surf City | 2.7% | 1.1%(+1.65)#48 | 1.1%(+1.63)#2,203 |
| 49. | Clemmons | 2.7% | 1.1%(+1.60)#49 | 1.1%(+1.57)#2,269 |
| 50. | Manteo | 2.6% | 1.1%(+1.57)#50 | 1.1%(+1.54)#2,300 |
| 51. | Carolina Beach | 2.6% | 1.1%(+1.55)#51 | 1.1%(+1.52)#2,339 |
| 52. | Topsail Beach | 2.6% | 1.1%(+1.54)#52 | 1.1%(+1.51)#2,353 |
| 53. | Boiling Spring Lakes | 2.6% | 1.1%(+1.52)#53 | 1.1%(+1.49)#2,381 |
| 54. | Jamestown | 2.6% | 1.1%(+1.52)#54 | 1.1%(+1.49)#2,388 |
| 55. | Dana | 2.6% | 1.1%(+1.49)#55 | 1.1%(+1.46)#2,432 |
| 56. | Hildebran | 2.5% | 1.1%(+1.48)#56 | 1.1%(+1.45)#2,456 |
| 57. | Balfour | 2.5% | 1.1%(+1.46)#57 | 1.1%(+1.43)#2,486 |
| 58. | Rennert | 2.5% | 1.1%(+1.46)#58 | 1.1%(+1.43)#2,492 |
| 59. | Apex | 2.5% | 1.1%(+1.42)#59 | 1.1%(+1.40)#2,539 |
| 60. | Five Points | 2.5% | 1.1%(+1.39)#60 | 1.1%(+1.36)#2,602 |
| 61. | Cherry Branch | 2.4% | 1.1%(+1.38)#61 | 1.1%(+1.35)#2,621 |
| 62. | Sedalia | 2.4% | 1.1%(+1.33)#62 | 1.1%(+1.30)#2,696 |
| 63. | Spring Hope | 2.4% | 1.1%(+1.32)#63 | 1.1%(+1.29)#2,704 |
| 64. | Princeton | 2.4% | 1.1%(+1.32)#64 | 1.1%(+1.29)#2,713 |
| 65. | Red Oak | 2.3% | 1.1%(+1.28)#65 | 1.1%(+1.25)#2,785 |
| 66. | Southern Shores | 2.3% | 1.1%(+1.26)#66 | 1.1%(+1.24)#2,813 |
| 67. | Knightdale | 2.3% | 1.1%(+1.20)#67 | 1.1%(+1.17)#2,926 |
| 68. | Wrightsville Beach | 2.3% | 1.1%(+1.19)#68 | 1.1%(+1.16)#2,940 |
| 69. | Avery Creek | 2.2% | 1.1%(+1.18)#69 | 1.1%(+1.15)#2,967 |
| 70. | Mcdonald | 2.2% | 1.1%(+1.16)#70 | 1.1%(+1.13)#3,003 |
| 71. | Washington Park | 2.2% | 1.1%(+1.15)#71 | 1.1%(+1.12)#3,020 |
| 72. | Southern Pines | 2.2% | 1.1%(+1.13)#72 | 1.1%(+1.10)#3,055 |
| 73. | Autryville | 2.2% | 1.1%(+1.11)#73 | 1.1%(+1.08)#3,091 |
| 74. | Randleman | 2.2% | 1.1%(+1.10)#74 | 1.1%(+1.08)#3,108 |
| 75. | Sunset Beach | 2.1% | 1.1%(+1.07)#75 | 1.1%(+1.04)#3,160 |
| 76. | Eureka | 2.1% | 1.1%(+1.06)#76 | 1.1%(+1.04)#3,174 |
| 77. | Wanchese | 2.1% | 1.1%(+1.05)#77 | 1.1%(+1.02)#3,194 |
| 78. | Duck | 2.1% | 1.1%(+1.05)#78 | 1.1%(+1.02)#3,200 |
| 79. | Cerro Gordo | 2.1% | 1.1%(+1.03)#79 | 1.1%(+1.01)#3,229 |
| 80. | Creedmoor | 2.1% | 1.1%(+1.02)#80 | 1.1%(+0.993)#3,255 |
| 81. | Spout Springs | 2.1% | 1.1%(+1.02)#81 | 1.1%(+0.988)#3,269 |
| 82. | Harkers Island | 2.1% | 1.1%(+1.01)#82 | 1.1%(+0.983)#3,275 |
| 83. | Calypso | 2.0% | 1.1%(+0.921)#83 | 1.1%(+0.893)#3,459 |
| 84. | Liberty | 2.0% | 1.1%(+0.917)#84 | 1.1%(+0.890)#3,466 |
| 85. | Holly Springs | 2.0% | 1.1%(+0.913)#85 | 1.1%(+0.886)#3,480 |
| 86. | Granite Falls | 1.9% | 1.1%(+0.830)#86 | 1.1%(+0.803)#3,673 |
| 87. | Beaufort | 1.9% | 1.1%(+0.826)#87 | 1.1%(+0.799)#3,688 |
| 88. | Southmont | 1.9% | 1.1%(+0.820)#88 | 1.1%(+0.792)#3,709 |
| 89. | Atlantic Beach | 1.9% | 1.1%(+0.791)#89 | 1.1%(+0.764)#3,781 |
| 90. | Hamlet | 1.9% | 1.1%(+0.788)#90 | 1.1%(+0.761)#3,787 |
| 91. | Piney Green | 1.8% | 1.1%(+0.735)#91 | 1.1%(+0.708)#3,928 |
| 92. | Half Moon | 1.8% | 1.1%(+0.719)#92 | 1.1%(+0.692)#3,974 |
| 93. | Raleigh | 1.8% | 1.1%(+0.719)#93 | 1.1%(+0.691)#3,975 |
| 94. | Rose Hill | 1.8% | 1.1%(+0.709)#94 | 1.1%(+0.681)#4,008 |
| 95. | Kenansville | 1.7% | 1.1%(+0.685)#95 | 1.1%(+0.657)#4,077 |
| 96. | Cleveland | 1.7% | 1.1%(+0.681)#96 | 1.1%(+0.653)#4,089 |
| 97. | Bethlehem | 1.7% | 1.1%(+0.667)#97 | 1.1%(+0.640)#4,119 |
| 98. | Lowell | 1.7% | 1.1%(+0.661)#98 | 1.1%(+0.633)#4,136 |
| 99. | Pinehurst | 1.7% | 1.1%(+0.640)#99 | 1.1%(+0.612)#4,209 |
| 100. | Oak Island | 1.6% | 1.1%(+0.586)#100 | 1.1%(+0.558)#4,352 |
Common Questions
What are the Top 10 Cities with the Highest Percentage of Population Employed in Life, Physical & Social Science in North Carolina?
Top 10 Cities with the Highest Percentage of Population Employed in Life, Physical & Social Science in North Carolina are:
#1
34.5%
#2
15.3%
#3
9.3%
#4
9.0%
#5
8.5%
#6
7.8%
#7
7.2%
#8
7.1%
#9
7.0%
#10
6.8%
What city has the Highest Percentage of Population Employed in Life, Physical & Social Science in North Carolina?
Centerville has the Highest Percentage of Population Employed in Life, Physical & Social Science in North Carolina with 34.5%.
What is the Percentage of Population Employed in Life, Physical & Social Science in the State of North Carolina?
Percentage of Population Employed in Life, Physical & Social Science in North Carolina is 1.1%.
What is the Percentage of Population Employed in Life, Physical & Social Science in the United States?
Percentage of Population Employed in Life, Physical & Social Science in the United States is 1.1%.