Cities with the Highest Percentage of Population Employed in Life, Physical & Social Science in Massachusetts
RELATED REPORTS & OPTIONS
Life, Physical & Social Science
Massachusetts
Compare Cities
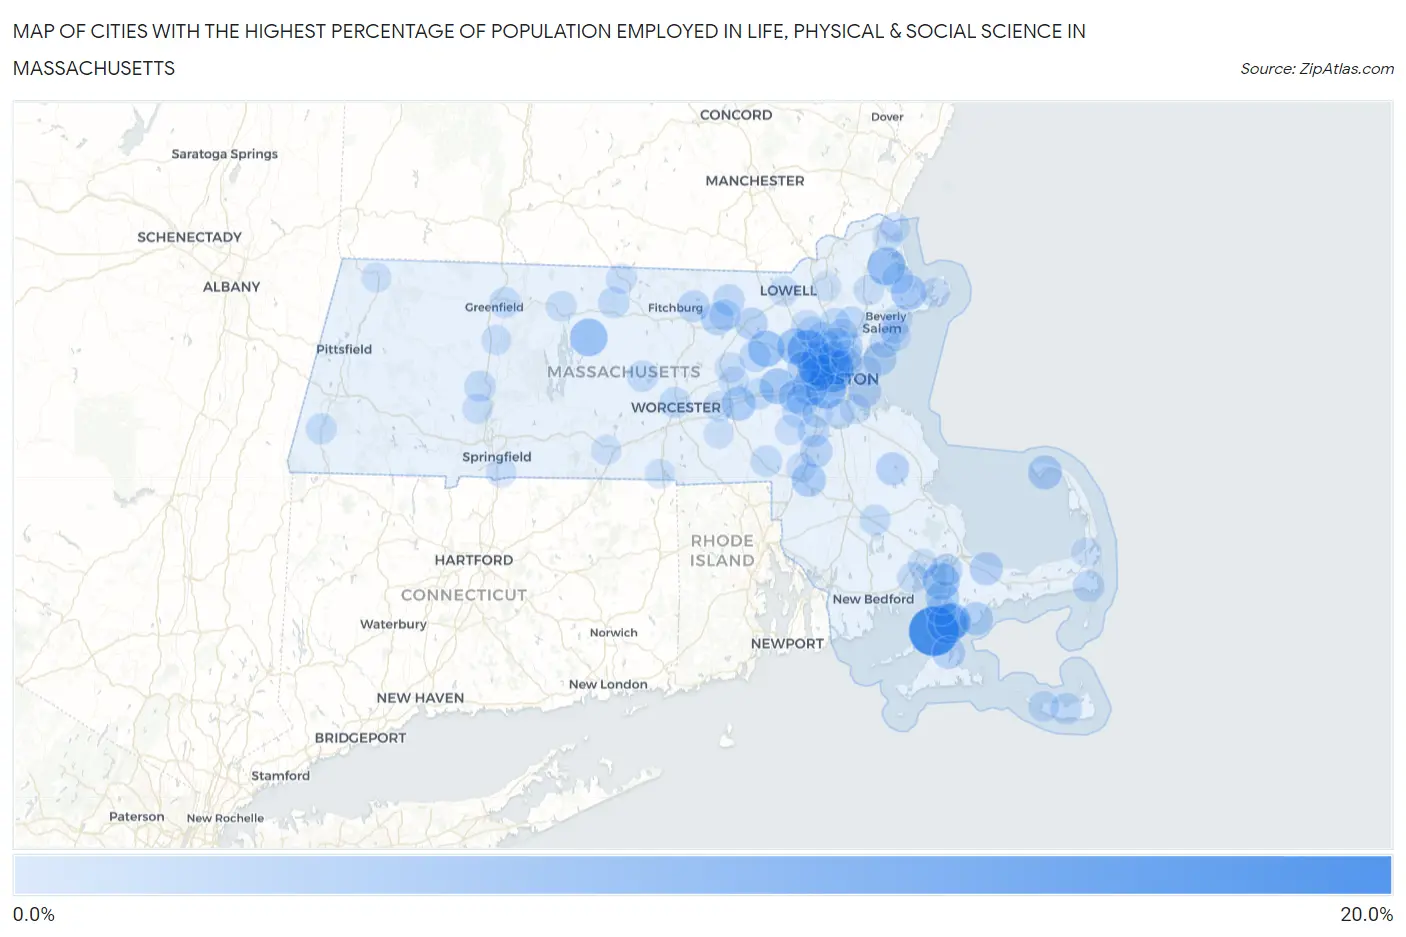
Map of Cities with the Highest Percentage of Population Employed in Life, Physical & Social Science in Massachusetts
0.0%
20.0%
Cities with the Highest Percentage of Population Employed in Life, Physical & Social Science in Massachusetts
| City | % Employed | vs State | vs National | |
| 1. | Woods Hole | 18.1% | 2.4%(+15.7)#1 | 1.1%(+17.0)#87 |
| 2. | Cambridge | 11.3% | 2.4%(+8.94)#2 | 1.1%(+10.2)#193 |
| 3. | Falmouth | 9.7% | 2.4%(+7.31)#3 | 1.1%(+8.59)#242 |
| 4. | Lexington | 9.7% | 2.4%(+7.29)#4 | 1.1%(+8.57)#247 |
| 5. | Brookline | 9.6% | 2.4%(+7.26)#5 | 1.1%(+8.53)#249 |
| 6. | Belmont | 9.1% | 2.4%(+6.70)#6 | 1.1%(+7.97)#278 |
| 7. | Rowley | 7.9% | 2.4%(+5.50)#7 | 1.1%(+6.77)#353 |
| 8. | Petersham | 7.6% | 2.4%(+5.22)#8 | 1.1%(+6.50)#373 |
| 9. | Somerville | 7.2% | 2.4%(+4.83)#9 | 1.1%(+6.10)#408 |
| 10. | Arlington | 7.2% | 2.4%(+4.79)#10 | 1.1%(+6.06)#414 |
| 11. | Pocasset | 6.9% | 2.4%(+4.50)#11 | 1.1%(+5.78)#449 |
| 12. | Teaticket | 6.8% | 2.4%(+4.47)#12 | 1.1%(+5.74)#453 |
| 13. | West Concord | 6.6% | 2.4%(+4.26)#13 | 1.1%(+5.53)#482 |
| 14. | Cochituate | 6.1% | 2.4%(+3.71)#14 | 1.1%(+4.98)#567 |
| 15. | Newton | 6.1% | 2.4%(+3.71)#15 | 1.1%(+4.98)#568 |
| 16. | Watertown Town | 6.1% | 2.4%(+3.69)#16 | 1.1%(+4.97)#575 |
| 17. | Hanscom Afb | 6.0% | 2.4%(+3.60)#17 | 1.1%(+4.87)#589 |
| 18. | Essex | 5.8% | 2.4%(+3.48)#18 | 1.1%(+4.75)#609 |
| 19. | Provincetown | 4.8% | 2.4%(+2.42)#19 | 1.1%(+3.69)#851 |
| 20. | Winchester | 4.8% | 2.4%(+2.40)#20 | 1.1%(+3.67)#855 |
| 21. | Cordaville | 4.7% | 2.4%(+2.37)#21 | 1.1%(+3.64)#868 |
| 22. | Mansfield Center | 4.7% | 2.4%(+2.31)#22 | 1.1%(+3.58)#881 |
| 23. | North Falmouth | 4.3% | 2.4%(+1.93)#23 | 1.1%(+3.20)#1,039 |
| 24. | New Seabury | 4.3% | 2.4%(+1.93)#24 | 1.1%(+3.20)#1,040 |
| 25. | Nahant | 4.1% | 2.4%(+1.77)#25 | 1.1%(+3.04)#1,104 |
| 26. | East Sandwich | 4.0% | 2.4%(+1.62)#26 | 1.1%(+2.89)#1,180 |
| 27. | Devens | 3.9% | 2.4%(+1.56)#27 | 1.1%(+2.83)#1,210 |
| 28. | Wellesley | 3.8% | 2.4%(+1.45)#28 | 1.1%(+2.72)#1,270 |
| 29. | Melrose | 3.8% | 2.4%(+1.45)#29 | 1.1%(+2.72)#1,272 |
| 30. | Vineyard Haven | 3.7% | 2.4%(+1.37)#30 | 1.1%(+2.64)#1,302 |
| 31. | Hanson | 3.7% | 2.4%(+1.33)#31 | 1.1%(+2.60)#1,337 |
| 32. | Littleton Common | 3.7% | 2.4%(+1.32)#32 | 1.1%(+2.59)#1,350 |
| 33. | Boston | 3.6% | 2.4%(+1.24)#33 | 1.1%(+2.52)#1,398 |
| 34. | Waltham | 3.6% | 2.4%(+1.23)#34 | 1.1%(+2.51)#1,401 |
| 35. | Sharon | 3.6% | 2.4%(+1.21)#35 | 1.1%(+2.49)#1,411 |
| 36. | Needham | 3.4% | 2.4%(+1.08)#36 | 1.1%(+2.36)#1,523 |
| 37. | Bourne | 3.3% | 2.4%(+0.928)#37 | 1.1%(+2.20)#1,620 |
| 38. | Medford | 3.3% | 2.4%(+0.892)#38 | 1.1%(+2.17)#1,651 |
| 39. | Lunenburg | 3.2% | 2.4%(+0.806)#39 | 1.1%(+2.08)#1,719 |
| 40. | Groton | 2.9% | 2.4%(+0.531)#40 | 1.1%(+1.80)#1,975 |
| 41. | Lynnfield | 2.8% | 2.4%(+0.485)#41 | 1.1%(+1.76)#2,017 |
| 42. | Norwood | 2.8% | 2.4%(+0.471)#42 | 1.1%(+1.74)#2,031 |
| 43. | Malden | 2.8% | 2.4%(+0.452)#43 | 1.1%(+1.72)#2,064 |
| 44. | West Chatham | 2.8% | 2.4%(+0.418)#44 | 1.1%(+1.69)#2,111 |
| 45. | Maynard | 2.7% | 2.4%(+0.372)#45 | 1.1%(+1.64)#2,183 |
| 46. | Nantucket | 2.7% | 2.4%(+0.369)#46 | 1.1%(+1.64)#2,185 |
| 47. | Burlington | 2.7% | 2.4%(+0.360)#47 | 1.1%(+1.63)#2,198 |
| 48. | Ayer | 2.6% | 2.4%(+0.235)#48 | 1.1%(+1.51)#2,361 |
| 49. | Franklin Town | 2.6% | 2.4%(+0.195)#49 | 1.1%(+1.47)#2,422 |
| 50. | Woburn | 2.5% | 2.4%(+0.185)#50 | 1.1%(+1.46)#2,438 |
| 51. | Baldwinville | 2.5% | 2.4%(+0.182)#51 | 1.1%(+1.46)#2,444 |
| 52. | Reading | 2.5% | 2.4%(+0.160)#52 | 1.1%(+1.43)#2,489 |
| 53. | Northampton | 2.5% | 2.4%(+0.146)#53 | 1.1%(+1.42)#2,506 |
| 54. | Ipswich | 2.5% | 2.4%(+0.118)#54 | 1.1%(+1.39)#2,551 |
| 55. | Framingham | 2.4% | 2.4%(+0.081)#55 | 1.1%(+1.35)#2,615 |
| 56. | Worcester | 2.4% | 2.4%(+0.071)#56 | 1.1%(+1.34)#2,627 |
| 57. | Rutland | 2.4% | 2.4%(+0.026)#57 | 1.1%(+1.30)#2,698 |
| 58. | Turners Falls | 2.3% | 2.4%(-0.027)#58 | 1.1%(+1.25)#2,800 |
| 59. | Everett | 2.3% | 2.4%(-0.097)#59 | 1.1%(+1.18)#2,911 |
| 60. | Great Barrington | 2.2% | 2.4%(-0.174)#60 | 1.1%(+1.10)#3,057 |
| 61. | Swampscott | 2.2% | 2.4%(-0.207)#61 | 1.1%(+1.07)#3,122 |
| 62. | West Falmouth | 2.1% | 2.4%(-0.236)#62 | 1.1%(+1.04)#3,170 |
| 63. | Middleborough Center | 2.1% | 2.4%(-0.249)#63 | 1.1%(+1.02)#3,193 |
| 64. | Amherst | 2.1% | 2.4%(-0.268)#64 | 1.1%(+1.00)#3,235 |
| 65. | Madaket | 2.1% | 2.4%(-0.280)#65 | 1.1%(+0.992)#3,259 |
| 66. | Orange | 2.0% | 2.4%(-0.353)#66 | 1.1%(+0.919)#3,403 |
| 67. | Dover | 2.0% | 2.4%(-0.367)#67 | 1.1%(+0.905)#3,434 |
| 68. | Hudson | 2.0% | 2.4%(-0.373)#68 | 1.1%(+0.899)#3,446 |
| 69. | Wakefield | 2.0% | 2.4%(-0.390)#69 | 1.1%(+0.882)#3,489 |
| 70. | Quincy | 2.0% | 2.4%(-0.406)#70 | 1.1%(+0.867)#3,529 |
| 71. | Westborough | 1.9% | 2.4%(-0.446)#71 | 1.1%(+0.827)#3,612 |
| 72. | Dedham | 1.9% | 2.4%(-0.459)#72 | 1.1%(+0.813)#3,644 |
| 73. | Winthrop Town | 1.9% | 2.4%(-0.500)#73 | 1.1%(+0.773)#3,760 |
| 74. | Milton | 1.8% | 2.4%(-0.522)#74 | 1.1%(+0.750)#3,823 |
| 75. | Marion Center | 1.8% | 2.4%(-0.559)#75 | 1.1%(+0.713)#3,911 |
| 76. | Topsfield | 1.8% | 2.4%(-0.578)#76 | 1.1%(+0.695)#3,960 |
| 77. | Longmeadow | 1.8% | 2.4%(-0.582)#77 | 1.1%(+0.690)#3,977 |
| 78. | Pinehurst | 1.8% | 2.4%(-0.594)#78 | 1.1%(+0.678)#4,017 |
| 79. | Easthampton Town | 1.8% | 2.4%(-0.596)#79 | 1.1%(+0.677)#4,020 |
| 80. | Winchendon | 1.8% | 2.4%(-0.611)#80 | 1.1%(+0.662)#4,061 |
| 81. | Foxborough | 1.7% | 2.4%(-0.619)#81 | 1.1%(+0.654)#4,088 |
| 82. | Beverly | 1.7% | 2.4%(-0.666)#82 | 1.1%(+0.607)#4,223 |
| 83. | Cedar Crest | 1.7% | 2.4%(-0.699)#83 | 1.1%(+0.573)#4,315 |
| 84. | Salisbury | 1.6% | 2.4%(-0.743)#84 | 1.1%(+0.530)#4,433 |
| 85. | Medfield | 1.6% | 2.4%(-0.744)#85 | 1.1%(+0.529)#4,437 |
| 86. | Gloucester | 1.6% | 2.4%(-0.767)#86 | 1.1%(+0.506)#4,500 |
| 87. | Lowell | 1.6% | 2.4%(-0.791)#87 | 1.1%(+0.481)#4,584 |
| 88. | Marlborough | 1.5% | 2.4%(-0.820)#88 | 1.1%(+0.453)#4,668 |
| 89. | Marblehead | 1.5% | 2.4%(-0.825)#89 | 1.1%(+0.448)#4,687 |
| 90. | Wareham Center | 1.5% | 2.4%(-0.825)#90 | 1.1%(+0.448)#4,690 |
| 91. | Newburyport | 1.5% | 2.4%(-0.830)#91 | 1.1%(+0.443)#4,715 |
| 92. | South Deerfield | 1.5% | 2.4%(-0.837)#92 | 1.1%(+0.436)#4,745 |
| 93. | Fiskdale | 1.5% | 2.4%(-0.880)#93 | 1.1%(+0.392)#4,916 |
| 94. | Andover | 1.5% | 2.4%(-0.892)#94 | 1.1%(+0.380)#4,968 |
| 95. | Stoneham | 1.5% | 2.4%(-0.897)#95 | 1.1%(+0.375)#4,990 |
| 96. | North Adams | 1.5% | 2.4%(-0.908)#96 | 1.1%(+0.365)#5,036 |
| 97. | Orleans | 1.4% | 2.4%(-0.929)#97 | 1.1%(+0.343)#5,122 |
| 98. | Upton | 1.4% | 2.4%(-0.975)#98 | 1.1%(+0.298)#5,278 |
| 99. | Webster | 1.4% | 2.4%(-0.995)#99 | 1.1%(+0.278)#5,354 |
| 100. | Salem | 1.4% | 2.4%(-0.996)#100 | 1.1%(+0.277)#5,357 |
Common Questions
What are the Top 10 Cities with the Highest Percentage of Population Employed in Life, Physical & Social Science in Massachusetts?
Top 10 Cities with the Highest Percentage of Population Employed in Life, Physical & Social Science in Massachusetts are:
#1
18.1%
#2
11.3%
#3
9.7%
#4
9.7%
#5
9.6%
#6
9.1%
#7
7.9%
#8
7.6%
#9
7.2%
#10
7.2%
What city has the Highest Percentage of Population Employed in Life, Physical & Social Science in Massachusetts?
Woods Hole has the Highest Percentage of Population Employed in Life, Physical & Social Science in Massachusetts with 18.1%.
What is the Percentage of Population Employed in Life, Physical & Social Science in the State of Massachusetts?
Percentage of Population Employed in Life, Physical & Social Science in Massachusetts is 2.4%.
What is the Percentage of Population Employed in Life, Physical & Social Science in the United States?
Percentage of Population Employed in Life, Physical & Social Science in the United States is 1.1%.