Cities with the Highest Percentage of Population Employed in Life, Physical & Social Science in West Virginia
RELATED REPORTS & OPTIONS
Life, Physical & Social Science
West Virginia
Compare Cities
Map of Cities with the Highest Percentage of Population Employed in Life, Physical & Social Science in West Virginia
0.0%
80.0%
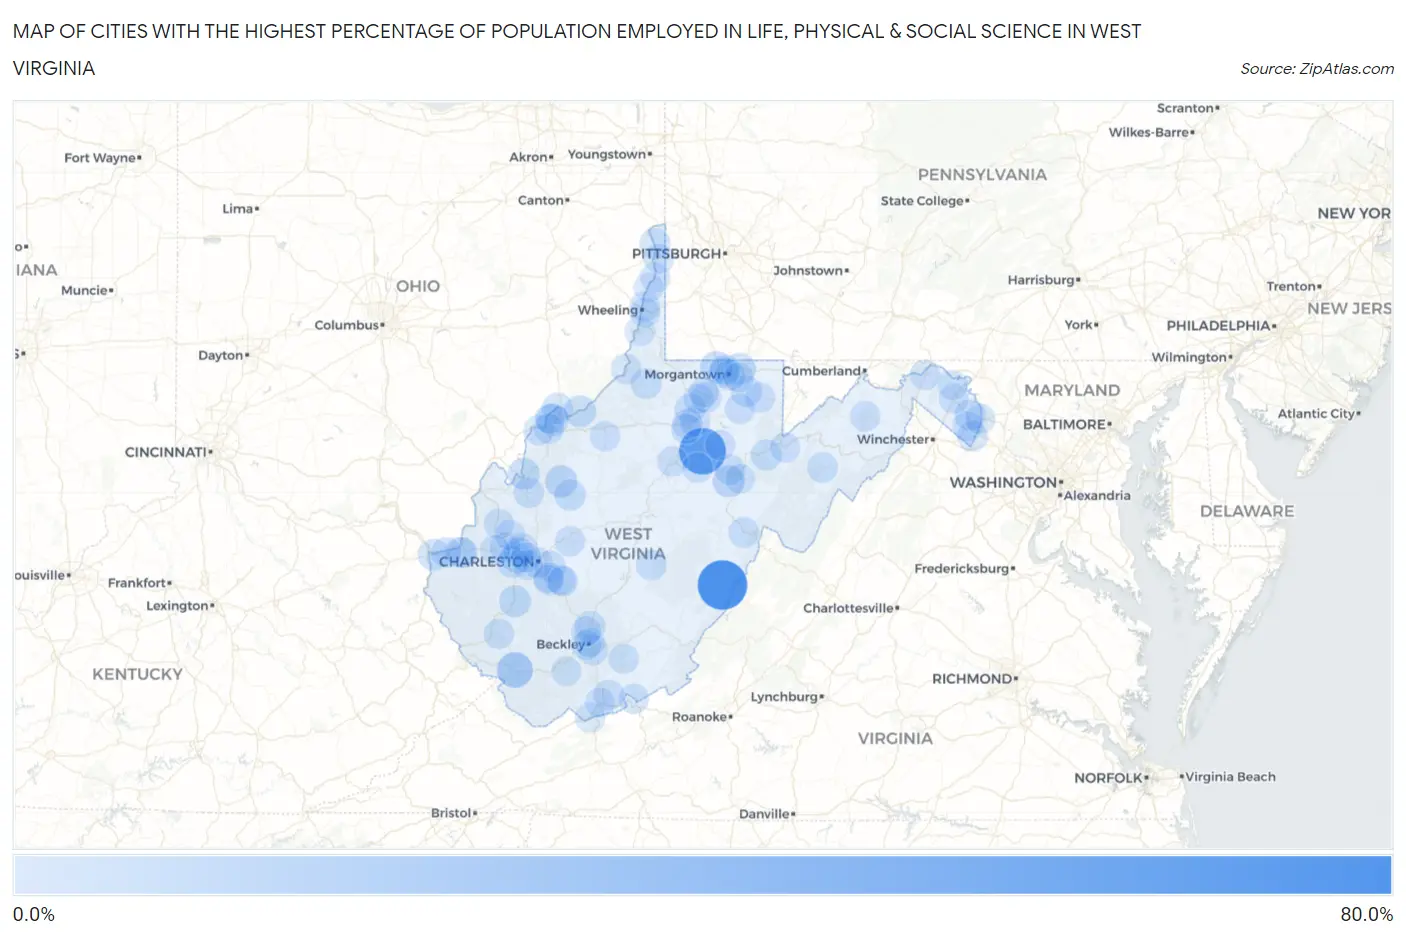
Cities with the Highest Percentage of Population Employed in Life, Physical & Social Science in West Virginia
| City | % Employed | vs State | vs National | |
| 1. | Huntersville | 63.6% | 0.95%(+62.7)#1 | 1.1%(+62.5)#7 |
| 2. | Century | 54.2% | 0.95%(+53.2)#2 | 1.1%(+53.1)#13 |
| 3. | Justice | 17.5% | 0.95%(+16.6)#3 | 1.1%(+16.4)#91 |
| 4. | Cassville | 7.1% | 0.95%(+6.13)#4 | 1.1%(+5.98)#423 |
| 5. | Womelsdorf Coalton | 6.6% | 0.95%(+5.61)#5 | 1.1%(+5.47)#490 |
| 6. | Reedy | 6.1% | 0.95%(+5.11)#6 | 1.1%(+4.97)#572 |
| 7. | North Hills | 6.0% | 0.95%(+5.01)#7 | 1.1%(+4.87)#590 |
| 8. | Ravenswood | 5.6% | 0.95%(+4.63)#8 | 1.1%(+4.49)#650 |
| 9. | Danville | 5.5% | 0.95%(+4.55)#9 | 1.1%(+4.40)#669 |
| 10. | Belmont | 5.1% | 0.95%(+4.12)#10 | 1.1%(+3.98)#772 |
| 11. | Cheat Lake | 4.7% | 0.95%(+3.77)#11 | 1.1%(+3.62)#872 |
| 12. | Ceredo | 4.6% | 0.95%(+3.63)#12 | 1.1%(+3.49)#918 |
| 13. | Spencer | 4.0% | 0.95%(+3.05)#13 | 1.1%(+2.91)#1,159 |
| 14. | Tornado | 3.7% | 0.95%(+2.75)#14 | 1.1%(+2.60)#1,334 |
| 15. | Williamstown | 3.6% | 0.95%(+2.68)#15 | 1.1%(+2.54)#1,391 |
| 16. | Hendricks | 3.4% | 0.95%(+2.46)#16 | 1.1%(+2.32)#1,542 |
| 17. | Shenandoah Junction | 3.3% | 0.95%(+2.36)#17 | 1.1%(+2.22)#1,607 |
| 18. | Reedsville | 3.3% | 0.95%(+2.35)#18 | 1.1%(+2.21)#1,614 |
| 19. | Pea Ridge | 3.2% | 0.95%(+2.29)#19 | 1.1%(+2.15)#1,661 |
| 20. | Institute | 3.0% | 0.95%(+2.08)#20 | 1.1%(+1.94)#1,864 |
| 21. | New Cumberland | 2.8% | 0.95%(+1.84)#21 | 1.1%(+1.70)#2,094 |
| 22. | St Albans | 2.8% | 0.95%(+1.83)#22 | 1.1%(+1.69)#2,115 |
| 23. | Pine Grove | 2.5% | 0.95%(+1.58)#23 | 1.1%(+1.44)#2,475 |
| 24. | Beaver | 2.4% | 0.95%(+1.46)#24 | 1.1%(+1.31)#2,676 |
| 25. | Coal Fork | 2.4% | 0.95%(+1.45)#25 | 1.1%(+1.30)#2,688 |
| 26. | Durbin | 2.3% | 0.95%(+1.34)#26 | 1.1%(+1.20)#2,864 |
| 27. | Shannondale | 2.3% | 0.95%(+1.32)#27 | 1.1%(+1.17)#2,916 |
| 28. | Athens | 2.2% | 0.95%(+1.27)#28 | 1.1%(+1.13)#2,996 |
| 29. | Morgantown | 2.2% | 0.95%(+1.23)#29 | 1.1%(+1.08)#3,083 |
| 30. | Bridgeport | 2.1% | 0.95%(+1.12)#30 | 1.1%(+0.980)#3,278 |
| 31. | Petersburg | 1.9% | 0.95%(+0.968)#31 | 1.1%(+0.825)#3,616 |
| 32. | Shinnston | 1.9% | 0.95%(+0.948)#32 | 1.1%(+0.805)#3,664 |
| 33. | Mount Hope | 1.9% | 0.95%(+0.933)#33 | 1.1%(+0.790)#3,714 |
| 34. | Ripley | 1.8% | 0.95%(+0.894)#34 | 1.1%(+0.751)#3,822 |
| 35. | Westover | 1.8% | 0.95%(+0.837)#35 | 1.1%(+0.694)#3,969 |
| 36. | Craigsville | 1.8% | 0.95%(+0.804)#36 | 1.1%(+0.661)#4,065 |
| 37. | Cross Lanes | 1.7% | 0.95%(+0.792)#37 | 1.1%(+0.649)#4,098 |
| 38. | Fairmont | 1.7% | 0.95%(+0.741)#38 | 1.1%(+0.598)#4,251 |
| 39. | New Martinsville | 1.6% | 0.95%(+0.627)#39 | 1.1%(+0.484)#4,574 |
| 40. | Cedar Grove | 1.5% | 0.95%(+0.598)#40 | 1.1%(+0.455)#4,661 |
| 41. | Charleston | 1.5% | 0.95%(+0.587)#41 | 1.1%(+0.444)#4,712 |
| 42. | Star City | 1.5% | 0.95%(+0.545)#42 | 1.1%(+0.402)#4,875 |
| 43. | Chesapeake | 1.5% | 0.95%(+0.523)#43 | 1.1%(+0.380)#4,971 |
| 44. | Barboursville | 1.5% | 0.95%(+0.514)#44 | 1.1%(+0.371)#5,005 |
| 45. | Teays Valley | 1.5% | 0.95%(+0.502)#45 | 1.1%(+0.359)#5,054 |
| 46. | Nitro | 1.4% | 0.95%(+0.464)#46 | 1.1%(+0.321)#5,203 |
| 47. | Belle | 1.4% | 0.95%(+0.463)#47 | 1.1%(+0.320)#5,206 |
| 48. | Kingwood | 1.4% | 0.95%(+0.454)#48 | 1.1%(+0.311)#5,236 |
| 49. | Weston | 1.4% | 0.95%(+0.450)#49 | 1.1%(+0.307)#5,252 |
| 50. | Clarksburg | 1.3% | 0.95%(+0.377)#50 | 1.1%(+0.234)#5,555 |
| 51. | Romney | 1.3% | 0.95%(+0.370)#51 | 1.1%(+0.227)#5,590 |
| 52. | Charles Town | 1.3% | 0.95%(+0.317)#52 | 1.1%(+0.175)#5,842 |
| 53. | Junior | 1.2% | 0.95%(+0.215)#53 | 1.1%(+0.072)#6,314 |
| 54. | Glasgow | 1.1% | 0.95%(+0.201)#54 | 1.1%(+0.059)#6,370 |
| 55. | South Charleston | 1.1% | 0.95%(+0.185)#55 | 1.1%(+0.042)#6,453 |
| 56. | Clendenin | 1.1% | 0.95%(+0.119)#56 | 1.1%(-0.024)#6,812 |
| 57. | Winfield | 1.1% | 0.95%(+0.112)#57 | 1.1%(-0.031)#6,845 |
| 58. | Buckhannon | 1.0% | 0.95%(+0.058)#58 | 1.1%(-0.085)#7,137 |
| 59. | Logan | 1.0% | 0.95%(+0.053)#59 | 1.1%(-0.090)#7,163 |
| 60. | Bath Berkeley Springs | 0.95% | 0.95%(+0.004)#60 | 1.1%(-0.139)#7,484 |
| 61. | Blennerhassett | 0.92% | 0.95%(-0.032)#61 | 1.1%(-0.175)#7,723 |
| 62. | Buffalo | 0.90% | 0.95%(-0.047)#62 | 1.1%(-0.190)#7,814 |
| 63. | Huntington | 0.89% | 0.95%(-0.054)#63 | 1.1%(-0.197)#7,858 |
| 64. | Parkersburg | 0.89% | 0.95%(-0.056)#64 | 1.1%(-0.199)#7,872 |
| 65. | Philippi | 0.88% | 0.95%(-0.065)#65 | 1.1%(-0.208)#7,923 |
| 66. | Newburg | 0.88% | 0.95%(-0.071)#66 | 1.1%(-0.214)#7,972 |
| 67. | Martinsburg | 0.85% | 0.95%(-0.096)#67 | 1.1%(-0.239)#8,123 |
| 68. | Wheeling | 0.83% | 0.95%(-0.117)#68 | 1.1%(-0.260)#8,281 |
| 69. | Wellsburg | 0.83% | 0.95%(-0.121)#69 | 1.1%(-0.263)#8,304 |
| 70. | Davis | 0.79% | 0.95%(-0.163)#70 | 1.1%(-0.306)#8,569 |
| 71. | Peterstown | 0.76% | 0.95%(-0.190)#71 | 1.1%(-0.333)#8,756 |
| 72. | Hinton | 0.76% | 0.95%(-0.193)#72 | 1.1%(-0.336)#8,781 |
| 73. | Monongah | 0.75% | 0.95%(-0.195)#73 | 1.1%(-0.338)#8,804 |
| 74. | Dunbar | 0.73% | 0.95%(-0.213)#74 | 1.1%(-0.356)#8,927 |
| 75. | Nutter Fort | 0.72% | 0.95%(-0.224)#75 | 1.1%(-0.367)#9,019 |
| 76. | Harrisville | 0.72% | 0.95%(-0.231)#76 | 1.1%(-0.374)#9,064 |
| 77. | Barrackville | 0.70% | 0.95%(-0.249)#77 | 1.1%(-0.392)#9,203 |
| 78. | Moundsville | 0.63% | 0.95%(-0.321)#78 | 1.1%(-0.464)#9,743 |
| 79. | Hedgesville | 0.58% | 0.95%(-0.363)#79 | 1.1%(-0.506)#10,103 |
| 80. | Ranson Corporation | 0.54% | 0.95%(-0.405)#80 | 1.1%(-0.548)#10,442 |
| 81. | Mabscott | 0.52% | 0.95%(-0.428)#81 | 1.1%(-0.571)#10,626 |
| 82. | Beckley | 0.48% | 0.95%(-0.469)#82 | 1.1%(-0.612)#10,940 |
| 83. | Weirton | 0.48% | 0.95%(-0.472)#83 | 1.1%(-0.615)#10,956 |
| 84. | Bolivar | 0.39% | 0.95%(-0.559)#84 | 1.1%(-0.702)#11,599 |
| 85. | Brookhaven | 0.37% | 0.95%(-0.578)#85 | 1.1%(-0.721)#11,754 |
| 86. | Beech Bottom | 0.34% | 0.95%(-0.605)#86 | 1.1%(-0.748)#11,965 |
| 87. | Bradley | 0.33% | 0.95%(-0.619)#87 | 1.1%(-0.762)#12,057 |
| 88. | Bethlehem | 0.32% | 0.95%(-0.629)#88 | 1.1%(-0.772)#12,133 |
| 89. | Hurricane | 0.25% | 0.95%(-0.693)#89 | 1.1%(-0.836)#12,509 |
| 90. | Vienna | 0.25% | 0.95%(-0.701)#90 | 1.1%(-0.844)#12,557 |
| 91. | Bluefield | 0.24% | 0.95%(-0.708)#91 | 1.1%(-0.851)#12,590 |
| 92. | Princeton | 0.21% | 0.95%(-0.740)#92 | 1.1%(-0.883)#12,729 |
| 93. | Mullens | 0.18% | 0.95%(-0.764)#93 | 1.1%(-0.907)#12,829 |
| 94. | Elkins | 0.099% | 0.95%(-0.849)#94 | 1.1%(-0.992)#13,074 |
Common Questions
What are the Top 10 Cities with the Highest Percentage of Population Employed in Life, Physical & Social Science in West Virginia?
Top 10 Cities with the Highest Percentage of Population Employed in Life, Physical & Social Science in West Virginia are:
#1
63.6%
#2
54.2%
#3
17.5%
#4
7.1%
#5
6.6%
#6
6.1%
#7
6.0%
#8
5.6%
#9
5.5%
#10
5.1%
What city has the Highest Percentage of Population Employed in Life, Physical & Social Science in West Virginia?
Huntersville has the Highest Percentage of Population Employed in Life, Physical & Social Science in West Virginia with 63.6%.
What is the Percentage of Population Employed in Life, Physical & Social Science in the State of West Virginia?
Percentage of Population Employed in Life, Physical & Social Science in West Virginia is 0.95%.
What is the Percentage of Population Employed in Life, Physical & Social Science in the United States?
Percentage of Population Employed in Life, Physical & Social Science in the United States is 1.1%.