Zip Codes with the Highest Percentage of Population Employed in Life, Physical & Social Science in Whittier, CA
RELATED REPORTS & OPTIONS
Life, Physical & Social Science
Whittier
Compare Zip Codes
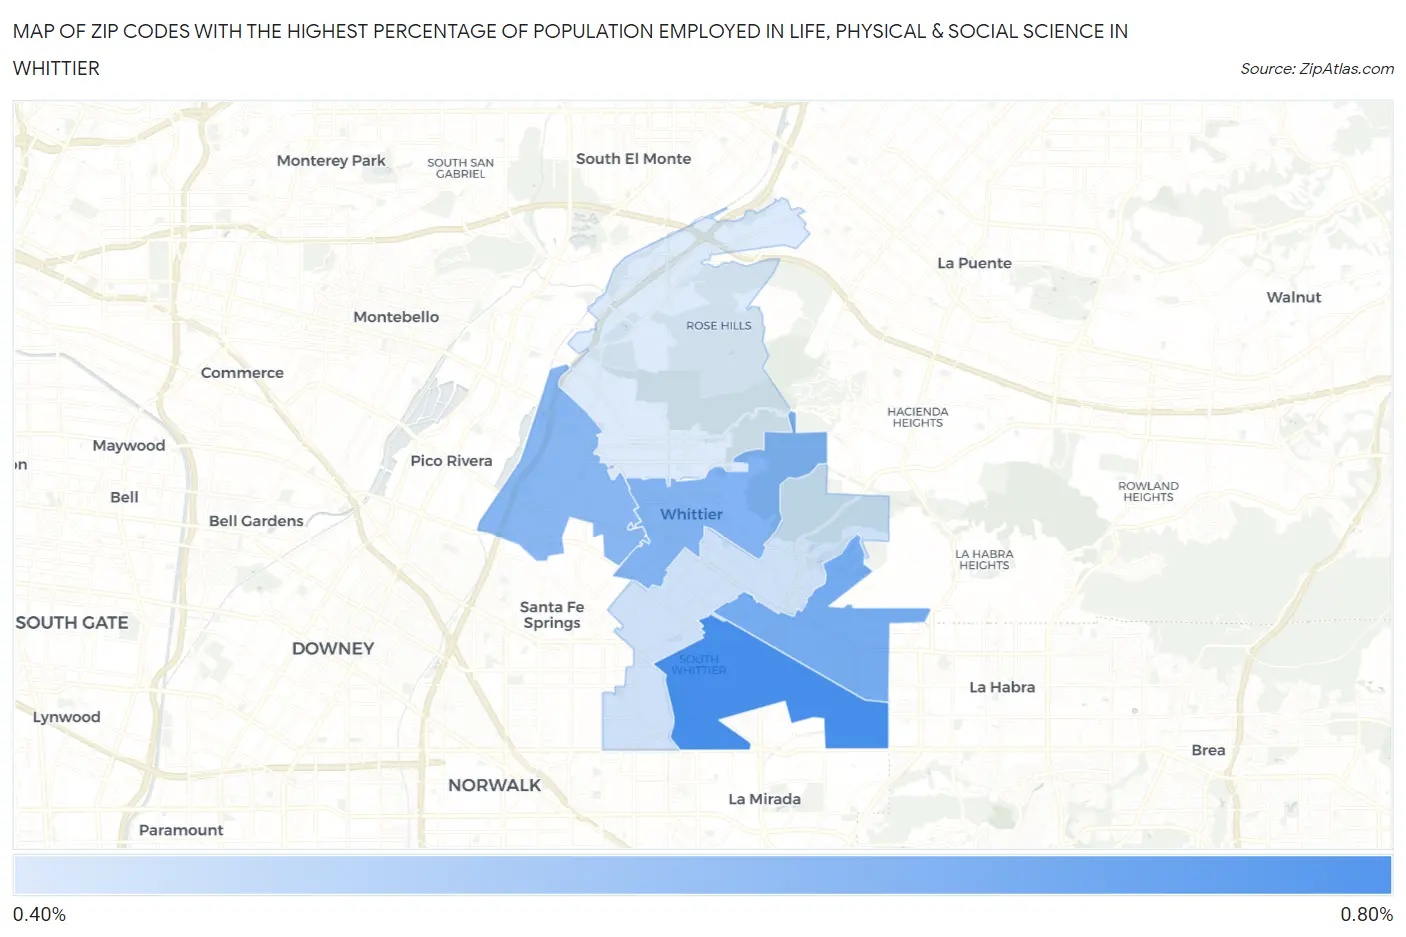
Map of Zip Codes with the Highest Percentage of Population Employed in Life, Physical & Social Science in Whittier
0.47%
0.77%
Zip Codes with the Highest Percentage of Population Employed in Life, Physical & Social Science in Whittier, CA
| Zip Code | % Employed | vs State | vs National | |
| 1. | 90604 | 0.77% | 1.3%(-0.536)#896 | 1.1%(-0.319)#11,279 |
| 2. | 90603 | 0.68% | 1.3%(-0.627)#955 | 1.1%(-0.410)#12,283 |
| 3. | 90602 | 0.65% | 1.3%(-0.653)#973 | 1.1%(-0.436)#12,598 |
| 4. | 90606 | 0.64% | 1.3%(-0.667)#980 | 1.1%(-0.450)#12,763 |
| 5. | 90605 | 0.50% | 1.3%(-0.812)#1,077 | 1.1%(-0.595)#14,551 |
| 6. | 90601 | 0.47% | 1.3%(-0.839)#1,098 | 1.1%(-0.622)#14,912 |
1
Common Questions
What are the Top 5 Zip Codes with the Highest Percentage of Population Employed in Life, Physical & Social Science in Whittier, CA?
Top 5 Zip Codes with the Highest Percentage of Population Employed in Life, Physical & Social Science in Whittier, CA are:
What zip code has the Highest Percentage of Population Employed in Life, Physical & Social Science in Whittier, CA?
90604 has the Highest Percentage of Population Employed in Life, Physical & Social Science in Whittier, CA with 0.77%.
What is the Percentage of Population Employed in Life, Physical & Social Science in Whittier, CA?
Percentage of Population Employed in Life, Physical & Social Science in Whittier is 0.68%.
What is the Percentage of Population Employed in Life, Physical & Social Science in California?
Percentage of Population Employed in Life, Physical & Social Science in California is 1.3%.
What is the Percentage of Population Employed in Life, Physical & Social Science in the United States?
Percentage of Population Employed in Life, Physical & Social Science in the United States is 1.1%.