Cities with the Highest Percentage of Population Employed in Life, Physical & Social Science in Tennessee
RELATED REPORTS & OPTIONS
Life, Physical & Social Science
Tennessee
Compare Cities
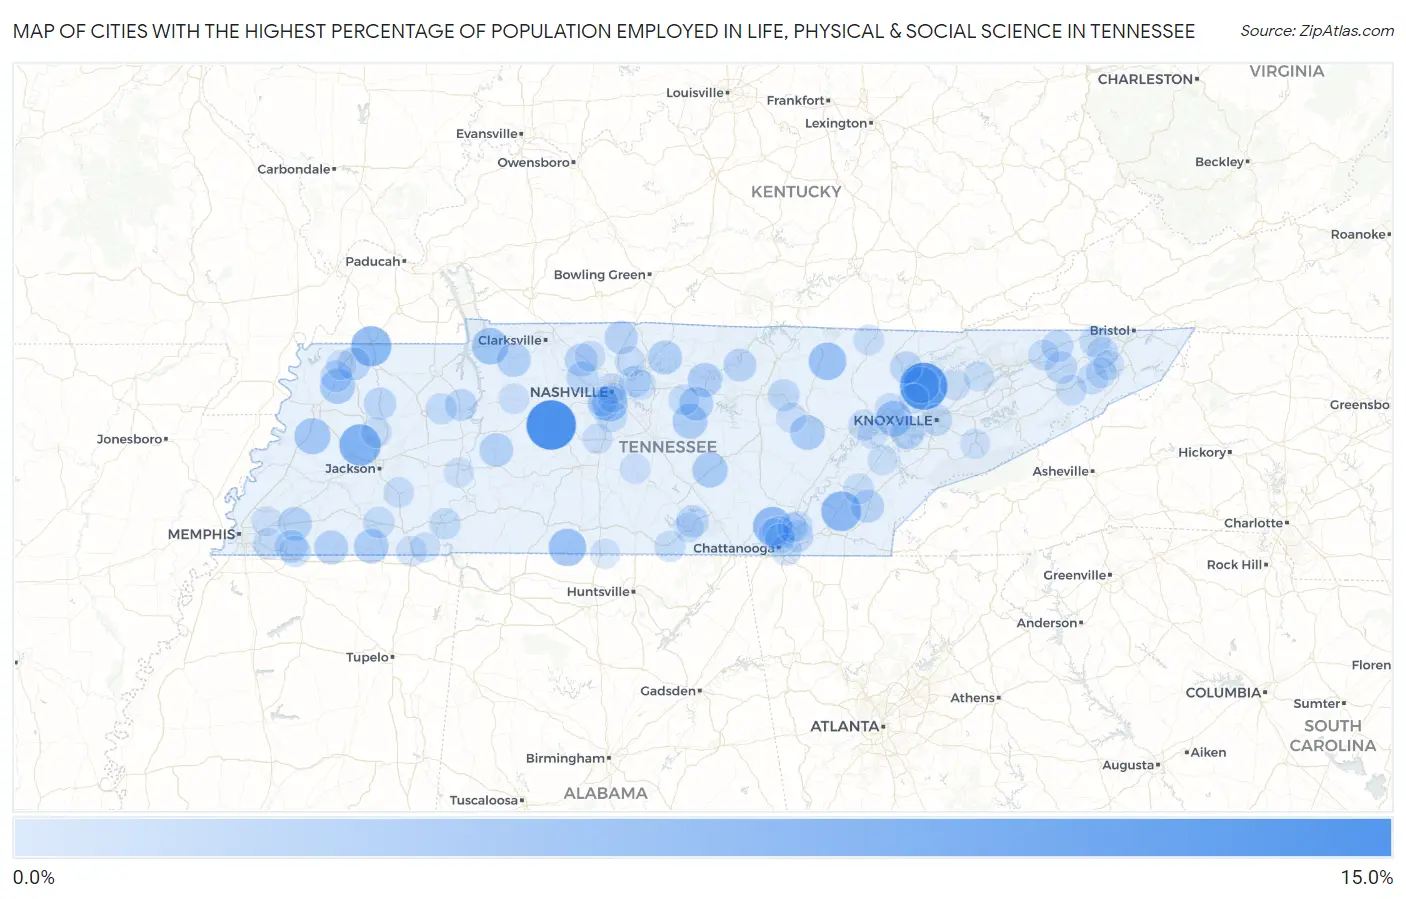
Map of Cities with the Highest Percentage of Population Employed in Life, Physical & Social Science in Tennessee
0.0%
15.0%
Cities with the Highest Percentage of Population Employed in Life, Physical & Social Science in Tennessee
| City | % Employed | vs State | vs National | |
| 1. | Bon Aqua Junction | 11.4% | 0.83%(+10.6)#1 | 1.1%(+10.3)#189 |
| 2. | Andersonville | 10.2% | 0.83%(+9.33)#2 | 1.1%(+9.07)#220 |
| 3. | Randolph | 9.6% | 0.83%(+8.78)#3 | 1.1%(+8.52)#250 |
| 4. | Palmersville | 8.0% | 0.83%(+7.17)#4 | 1.1%(+6.91)#342 |
| 5. | Gadsden | 6.9% | 0.83%(+6.07)#5 | 1.1%(+5.81)#442 |
| 6. | South Fulton | 6.2% | 0.83%(+5.40)#6 | 1.1%(+5.14)#548 |
| 7. | Calhoun | 6.0% | 0.83%(+5.18)#7 | 1.1%(+4.92)#583 |
| 8. | Lone Oak | 5.4% | 0.83%(+4.61)#8 | 1.1%(+4.35)#682 |
| 9. | Allardt | 4.8% | 0.83%(+3.99)#9 | 1.1%(+3.73)#837 |
| 10. | Minor Hill | 4.7% | 0.83%(+3.87)#10 | 1.1%(+3.61)#878 |
| 11. | Norris | 4.3% | 0.83%(+3.52)#11 | 1.1%(+3.26)#1,018 |
| 12. | Dover | 4.2% | 0.83%(+3.40)#12 | 1.1%(+3.14)#1,064 |
| 13. | Gates | 4.0% | 0.83%(+3.20)#13 | 1.1%(+2.94)#1,145 |
| 14. | Oak Ridge | 3.8% | 0.83%(+2.96)#14 | 1.1%(+2.70)#1,279 |
| 15. | Oak Hill | 3.8% | 0.83%(+2.92)#15 | 1.1%(+2.66)#1,296 |
| 16. | Morrison | 3.5% | 0.83%(+2.70)#16 | 1.1%(+2.44)#1,451 |
| 17. | Trimble | 3.5% | 0.83%(+2.64)#17 | 1.1%(+2.38)#1,503 |
| 18. | Auburntown | 3.4% | 0.83%(+2.54)#18 | 1.1%(+2.28)#1,566 |
| 19. | Lake Tansi | 3.3% | 0.83%(+2.45)#19 | 1.1%(+2.19)#1,634 |
| 20. | Middleton | 3.2% | 0.83%(+2.35)#20 | 1.1%(+2.09)#1,706 |
| 21. | South Carthage | 3.1% | 0.83%(+2.23)#21 | 1.1%(+1.97)#1,830 |
| 22. | Alexandria | 2.9% | 0.83%(+2.10)#22 | 1.1%(+1.84)#1,937 |
| 23. | Castalian Springs | 2.9% | 0.83%(+2.06)#23 | 1.1%(+1.80)#1,978 |
| 24. | Cumberland City | 2.9% | 0.83%(+2.05)#24 | 1.1%(+1.79)#1,982 |
| 25. | La Grange | 2.9% | 0.83%(+2.03)#25 | 1.1%(+1.77)#2,012 |
| 26. | Oakland | 2.8% | 0.83%(+1.98)#26 | 1.1%(+1.72)#2,065 |
| 27. | Lobelville | 2.8% | 0.83%(+1.98)#27 | 1.1%(+1.72)#2,072 |
| 28. | Farragut | 2.8% | 0.83%(+1.97)#28 | 1.1%(+1.71)#2,086 |
| 29. | Cross Plains | 2.6% | 0.83%(+1.73)#29 | 1.1%(+1.47)#2,421 |
| 30. | Etowah | 2.5% | 0.83%(+1.66)#30 | 1.1%(+1.40)#2,533 |
| 31. | Walden | 2.4% | 0.83%(+1.61)#31 | 1.1%(+1.35)#2,612 |
| 32. | Gainesboro | 2.4% | 0.83%(+1.53)#32 | 1.1%(+1.27)#2,759 |
| 33. | Rives | 2.4% | 0.83%(+1.52)#33 | 1.1%(+1.26)#2,774 |
| 34. | Pleasant View | 2.3% | 0.83%(+1.47)#34 | 1.1%(+1.21)#2,853 |
| 35. | Bradford | 2.2% | 0.83%(+1.36)#35 | 1.1%(+1.10)#3,064 |
| 36. | Decherd | 2.2% | 0.83%(+1.33)#36 | 1.1%(+1.07)#3,114 |
| 37. | Lynchburg | 2.1% | 0.83%(+1.29)#37 | 1.1%(+1.03)#3,180 |
| 38. | Piperton | 2.1% | 0.83%(+1.27)#38 | 1.1%(+1.01)#3,227 |
| 39. | Jacksboro | 2.1% | 0.83%(+1.22)#39 | 1.1%(+0.961)#3,317 |
| 40. | Baileyton | 2.0% | 0.83%(+1.14)#40 | 1.1%(+0.880)#3,495 |
| 41. | Ashland City | 1.9% | 0.83%(+1.11)#41 | 1.1%(+0.855)#3,551 |
| 42. | Camden | 1.9% | 0.83%(+1.04)#42 | 1.1%(+0.781)#3,740 |
| 43. | Monterey | 1.9% | 0.83%(+1.02)#43 | 1.1%(+0.759)#3,800 |
| 44. | Surgoinsville | 1.8% | 0.83%(+0.971)#44 | 1.1%(+0.711)#3,915 |
| 45. | Knoxville | 1.8% | 0.83%(+0.945)#45 | 1.1%(+0.685)#3,992 |
| 46. | Obion | 1.7% | 0.83%(+0.897)#46 | 1.1%(+0.637)#4,126 |
| 47. | Harrison | 1.7% | 0.83%(+0.866)#47 | 1.1%(+0.606)#4,225 |
| 48. | Brentwood | 1.7% | 0.83%(+0.857)#48 | 1.1%(+0.597)#4,253 |
| 49. | Hornsby | 1.6% | 0.83%(+0.808)#49 | 1.1%(+0.548)#4,378 |
| 50. | Green Hill | 1.6% | 0.83%(+0.742)#50 | 1.1%(+0.482)#4,581 |
| 51. | Forest Hills | 1.6% | 0.83%(+0.736)#51 | 1.1%(+0.476)#4,603 |
| 52. | Savannah | 1.6% | 0.83%(+0.723)#52 | 1.1%(+0.463)#4,639 |
| 53. | Rossville | 1.5% | 0.83%(+0.712)#53 | 1.1%(+0.452)#4,671 |
| 54. | Hollow Rock | 1.5% | 0.83%(+0.712)#54 | 1.1%(+0.452)#4,672 |
| 55. | Germantown | 1.5% | 0.83%(+0.683)#55 | 1.1%(+0.424)#4,789 |
| 56. | Kingsport | 1.5% | 0.83%(+0.633)#56 | 1.1%(+0.373)#4,998 |
| 57. | Telford | 1.5% | 0.83%(+0.625)#57 | 1.1%(+0.365)#5,030 |
| 58. | Huntland | 1.4% | 0.83%(+0.612)#58 | 1.1%(+0.352)#5,084 |
| 59. | Harriman | 1.4% | 0.83%(+0.607)#59 | 1.1%(+0.347)#5,104 |
| 60. | Ridgeside | 1.4% | 0.83%(+0.581)#60 | 1.1%(+0.321)#5,204 |
| 61. | Rogersville | 1.4% | 0.83%(+0.566)#61 | 1.1%(+0.306)#5,253 |
| 62. | Spurgeon | 1.4% | 0.83%(+0.566)#62 | 1.1%(+0.306)#5,257 |
| 63. | Watertown | 1.4% | 0.83%(+0.520)#63 | 1.1%(+0.260)#5,439 |
| 64. | Gibson | 1.3% | 0.83%(+0.496)#64 | 1.1%(+0.237)#5,543 |
| 65. | Tusculum | 1.3% | 0.83%(+0.489)#65 | 1.1%(+0.229)#5,582 |
| 66. | Jonesborough | 1.3% | 0.83%(+0.483)#66 | 1.1%(+0.223)#5,609 |
| 67. | Oliver Springs | 1.3% | 0.83%(+0.479)#67 | 1.1%(+0.219)#5,625 |
| 68. | Nashville | 1.3% | 0.83%(+0.475)#68 | 1.1%(+0.215)#5,647 |
| 69. | Athens | 1.3% | 0.83%(+0.441)#69 | 1.1%(+0.182)#5,802 |
| 70. | Powell | 1.2% | 0.83%(+0.414)#70 | 1.1%(+0.154)#5,919 |
| 71. | Signal Mountain | 1.2% | 0.83%(+0.399)#71 | 1.1%(+0.139)#5,990 |
| 72. | Shackle Island | 1.2% | 0.83%(+0.398)#72 | 1.1%(+0.138)#5,994 |
| 73. | Oneida | 1.2% | 0.83%(+0.389)#73 | 1.1%(+0.130)#6,028 |
| 74. | Guys | 1.2% | 0.83%(+0.388)#74 | 1.1%(+0.129)#6,037 |
| 75. | Henderson | 1.2% | 0.83%(+0.360)#75 | 1.1%(+0.101)#6,171 |
| 76. | Coopertown | 1.2% | 0.83%(+0.355)#76 | 1.1%(+0.095)#6,196 |
| 77. | Mcewen | 1.2% | 0.83%(+0.327)#77 | 1.1%(+0.067)#6,331 |
| 78. | Belle Meade | 1.1% | 0.83%(+0.289)#78 | 1.1%(+0.029)#6,513 |
| 79. | Luttrell | 1.1% | 0.83%(+0.280)#79 | 1.1%(+0.020)#6,571 |
| 80. | Thompson S Station | 1.1% | 0.83%(+0.263)#80 | 1.1%(+0.003)#6,677 |
| 81. | Lakesite | 1.1% | 0.83%(+0.251)#81 | 1.1%(-0.008)#6,742 |
| 82. | Unionville | 1.1% | 0.83%(+0.236)#82 | 1.1%(-0.024)#6,809 |
| 83. | Pleasant Hill | 1.1% | 0.83%(+0.221)#83 | 1.1%(-0.038)#6,871 |
| 84. | Johnson City | 1.0% | 0.83%(+0.204)#84 | 1.1%(-0.056)#6,960 |
| 85. | Philadelphia | 1.0% | 0.83%(+0.192)#85 | 1.1%(-0.068)#7,032 |
| 86. | Troy | 1.0% | 0.83%(+0.185)#86 | 1.1%(-0.075)#7,073 |
| 87. | Rutledge | 1.0% | 0.83%(+0.182)#87 | 1.1%(-0.077)#7,086 |
| 88. | Berry Hill | 0.99% | 0.83%(+0.160)#88 | 1.1%(-0.100)#7,229 |
| 89. | Pigeon Forge | 0.98% | 0.83%(+0.149)#89 | 1.1%(-0.111)#7,308 |
| 90. | Mount Juliet | 0.96% | 0.83%(+0.131)#90 | 1.1%(-0.129)#7,426 |
| 91. | Middle Valley | 0.95% | 0.83%(+0.118)#91 | 1.1%(-0.142)#7,507 |
| 92. | Decaturville | 0.94% | 0.83%(+0.112)#92 | 1.1%(-0.148)#7,531 |
| 93. | Kingston | 0.94% | 0.83%(+0.105)#93 | 1.1%(-0.155)#7,570 |
| 94. | Ardmore | 0.93% | 0.83%(+0.103)#94 | 1.1%(-0.156)#7,578 |
| 95. | Winchester | 0.92% | 0.83%(+0.090)#95 | 1.1%(-0.169)#7,687 |
| 96. | Red Bank | 0.91% | 0.83%(+0.081)#96 | 1.1%(-0.179)#7,742 |
| 97. | Clinton | 0.91% | 0.83%(+0.079)#97 | 1.1%(-0.181)#7,751 |
| 98. | Michie | 0.91% | 0.83%(+0.078)#98 | 1.1%(-0.182)#7,763 |
| 99. | Karns | 0.90% | 0.83%(+0.073)#99 | 1.1%(-0.187)#7,791 |
| 100. | Bartlett | 0.90% | 0.83%(+0.068)#100 | 1.1%(-0.192)#7,830 |
Common Questions
What are the Top 10 Cities with the Highest Percentage of Population Employed in Life, Physical & Social Science in Tennessee?
Top 10 Cities with the Highest Percentage of Population Employed in Life, Physical & Social Science in Tennessee are:
#1
11.4%
#2
10.2%
#3
6.9%
#4
6.2%
#5
6.0%
#6
5.4%
#7
4.8%
#8
4.7%
#9
4.3%
#10
4.2%
What city has the Highest Percentage of Population Employed in Life, Physical & Social Science in Tennessee?
Bon Aqua Junction has the Highest Percentage of Population Employed in Life, Physical & Social Science in Tennessee with 11.4%.
What is the Percentage of Population Employed in Life, Physical & Social Science in the State of Tennessee?
Percentage of Population Employed in Life, Physical & Social Science in Tennessee is 0.83%.
What is the Percentage of Population Employed in Life, Physical & Social Science in the United States?
Percentage of Population Employed in Life, Physical & Social Science in the United States is 1.1%.