Cities with the Highest Percentage of Population Employed in Life, Physical & Social Science in Pennsylvania
RELATED REPORTS & OPTIONS
Life, Physical & Social Science
Pennsylvania
Compare Cities
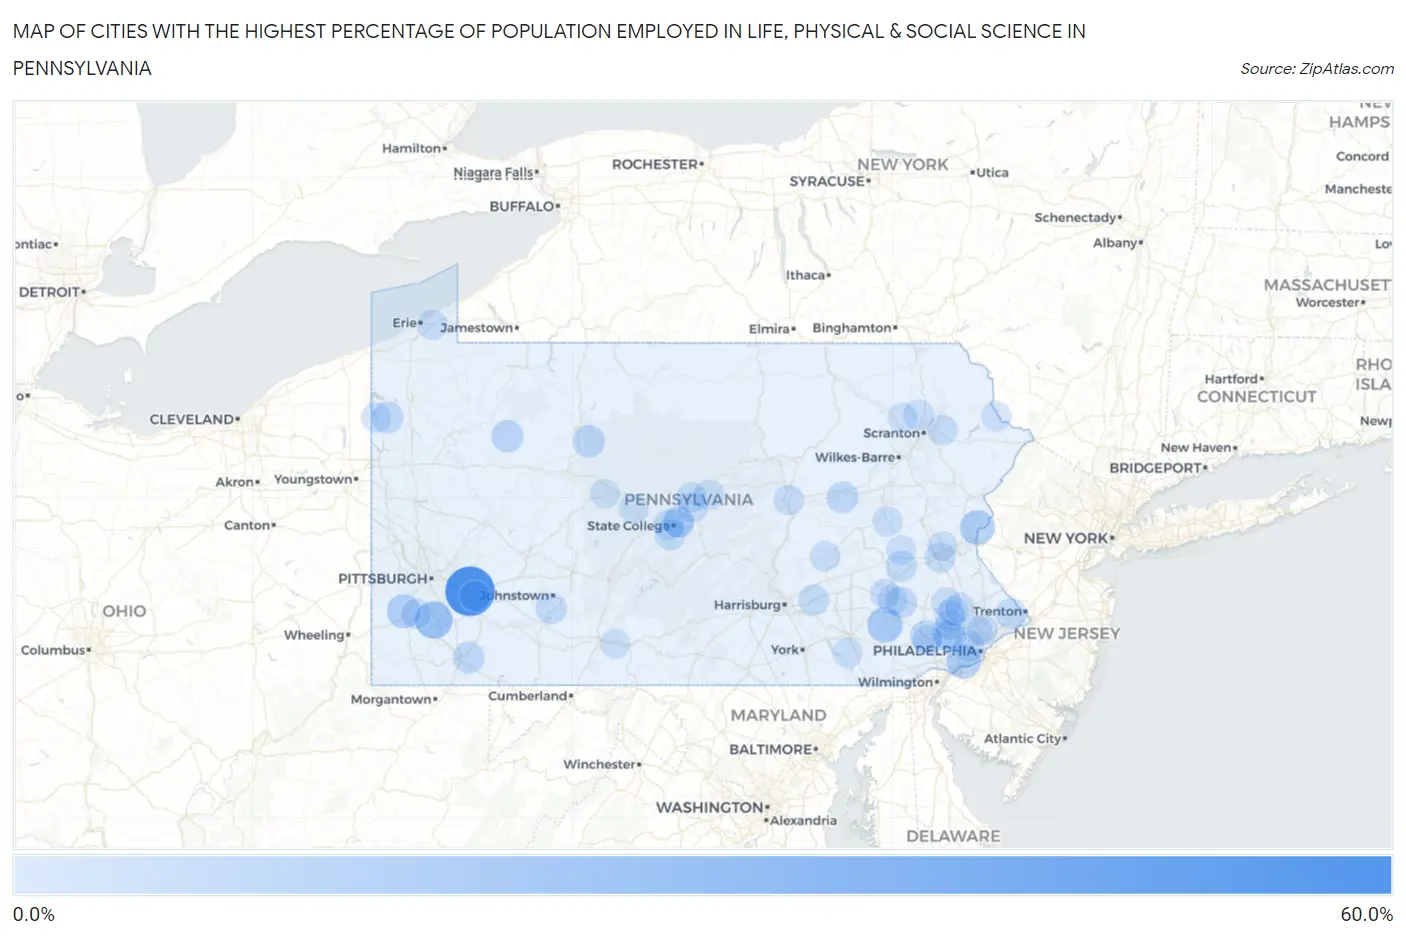
Map of Cities with the Highest Percentage of Population Employed in Life, Physical & Social Science in Pennsylvania
0.0%
60.0%
Cities with the Highest Percentage of Population Employed in Life, Physical & Social Science in Pennsylvania
| City | % Employed | vs State | vs National | |
| 1. | Harrison City | 57.1% | 1.2%(+55.9)#1 | 1.1%(+56.1)#8 |
| 2. | Van Voorhis | 23.1% | 1.2%(+21.9)#2 | 1.1%(+22.0)#60 |
| 3. | Goodville | 17.3% | 1.2%(+16.1)#3 | 1.1%(+16.2)#93 |
| 4. | Alverda | 16.2% | 1.2%(+15.0)#4 | 1.1%(+15.1)#103 |
| 5. | Martins Creek | 15.7% | 1.2%(+14.5)#5 | 1.1%(+14.6)#106 |
| 6. | Prospect Park | 15.6% | 1.2%(+14.4)#6 | 1.1%(+14.5)#107 |
| 7. | Clintondale | 15.4% | 1.2%(+14.2)#7 | 1.1%(+14.3)#110 |
| 8. | Meadowlands | 14.5% | 1.2%(+13.3)#8 | 1.1%(+13.5)#126 |
| 9. | St. Clair | 11.8% | 1.2%(+10.5)#9 | 1.1%(+10.7)#180 |
| 10. | Holters Crossing | 10.1% | 1.2%(+8.90)#10 | 1.1%(+9.04)#222 |
| 11. | Tylersburg | 9.7% | 1.2%(+8.45)#11 | 1.1%(+8.59)#244 |
| 12. | Lionville | 9.7% | 1.2%(+8.45)#12 | 1.1%(+8.58)#245 |
| 13. | Kersey | 9.4% | 1.2%(+8.21)#13 | 1.1%(+8.34)#258 |
| 14. | Ulysses Borough | 8.7% | 1.2%(+7.44)#14 | 1.1%(+7.57)#296 |
| 15. | Chesterbrook | 8.4% | 1.2%(+7.17)#15 | 1.1%(+7.30)#318 |
| 16. | Mainville | 8.2% | 1.2%(+6.97)#16 | 1.1%(+7.11)#326 |
| 17. | Devon | 8.0% | 1.2%(+6.83)#17 | 1.1%(+6.96)#337 |
| 18. | Lemont Furnace | 8.0% | 1.2%(+6.80)#18 | 1.1%(+6.93)#340 |
| 19. | Adamsville | 7.9% | 1.2%(+6.67)#19 | 1.1%(+6.80)#352 |
| 20. | Continental Courts | 7.8% | 1.2%(+6.63)#20 | 1.1%(+6.76)#354 |
| 21. | Gibraltar | 7.7% | 1.2%(+6.52)#21 | 1.1%(+6.65)#361 |
| 22. | Franklintown Borough | 7.7% | 1.2%(+6.44)#22 | 1.1%(+6.57)#371 |
| 23. | Summerhill Borough | 7.5% | 1.2%(+6.24)#23 | 1.1%(+6.37)#378 |
| 24. | Jenkintown Borough | 7.4% | 1.2%(+6.13)#24 | 1.1%(+6.26)#388 |
| 25. | Swarthmore Borough | 7.3% | 1.2%(+6.12)#25 | 1.1%(+6.26)#390 |
| 26. | Burlington Borough | 7.2% | 1.2%(+6.02)#26 | 1.1%(+6.16)#402 |
| 27. | Newton Hamilton Borough | 7.1% | 1.2%(+5.92)#27 | 1.1%(+6.05)#415 |
| 28. | Port Royal Borough | 6.9% | 1.2%(+5.67)#28 | 1.1%(+5.80)#446 |
| 29. | Blawnox Borough | 6.8% | 1.2%(+5.57)#29 | 1.1%(+5.70)#460 |
| 30. | Virginville | 6.7% | 1.2%(+5.44)#30 | 1.1%(+5.58)#471 |
| 31. | Woodbourne | 6.7% | 1.2%(+5.43)#31 | 1.1%(+5.57)#475 |
| 32. | Larksville Borough | 6.7% | 1.2%(+5.43)#32 | 1.1%(+5.56)#478 |
| 33. | Davidsville | 6.6% | 1.2%(+5.40)#33 | 1.1%(+5.53)#481 |
| 34. | Pine Grove Mills | 6.4% | 1.2%(+5.15)#34 | 1.1%(+5.28)#519 |
| 35. | Penn Wynne | 6.3% | 1.2%(+5.11)#35 | 1.1%(+5.24)#525 |
| 36. | Sadsburyville | 6.3% | 1.2%(+5.07)#36 | 1.1%(+5.20)#531 |
| 37. | Lewisburg Borough | 6.3% | 1.2%(+5.07)#37 | 1.1%(+5.20)#532 |
| 38. | Houserville | 6.3% | 1.2%(+5.06)#38 | 1.1%(+5.19)#536 |
| 39. | Braddock Hills Borough | 6.2% | 1.2%(+5.03)#39 | 1.1%(+5.16)#539 |
| 40. | Park Forest Village | 6.2% | 1.2%(+5.01)#40 | 1.1%(+5.14)#546 |
| 41. | Chadds Ford | 6.1% | 1.2%(+4.84)#41 | 1.1%(+4.97)#569 |
| 42. | Palmdale | 6.0% | 1.2%(+4.80)#42 | 1.1%(+4.94)#582 |
| 43. | Lemont | 5.7% | 1.2%(+4.47)#43 | 1.1%(+4.60)#634 |
| 44. | Waverly | 5.5% | 1.2%(+4.31)#44 | 1.1%(+4.45)#660 |
| 45. | Nittany | 5.5% | 1.2%(+4.25)#45 | 1.1%(+4.38)#677 |
| 46. | Grapeville | 5.4% | 1.2%(+4.21)#46 | 1.1%(+4.34)#684 |
| 47. | Zion | 5.4% | 1.2%(+4.20)#47 | 1.1%(+4.33)#689 |
| 48. | Mount Penn Borough | 5.3% | 1.2%(+4.11)#48 | 1.1%(+4.24)#712 |
| 49. | Dorneyville | 5.3% | 1.2%(+4.03)#49 | 1.1%(+4.16)#735 |
| 50. | Bridgeport Borough | 5.3% | 1.2%(+4.03)#50 | 1.1%(+4.16)#737 |
| 51. | Mount Cobb | 5.2% | 1.2%(+3.97)#51 | 1.1%(+4.11)#744 |
| 52. | Penn State Erie Behrend | 5.1% | 1.2%(+3.83)#52 | 1.1%(+3.96)#777 |
| 53. | Evansburg | 4.9% | 1.2%(+3.73)#53 | 1.1%(+3.86)#803 |
| 54. | Montandon | 4.9% | 1.2%(+3.70)#54 | 1.1%(+3.83)#807 |
| 55. | Mount Eagle | 4.9% | 1.2%(+3.70)#55 | 1.1%(+3.83)#812 |
| 56. | Wyncote | 4.8% | 1.2%(+3.61)#56 | 1.1%(+3.74)#835 |
| 57. | South Renovo Borough | 4.8% | 1.2%(+3.60)#57 | 1.1%(+3.73)#839 |
| 58. | Reinerton | 4.8% | 1.2%(+3.60)#58 | 1.1%(+3.73)#840 |
| 59. | Worthington Borough | 4.8% | 1.2%(+3.59)#59 | 1.1%(+3.72)#845 |
| 60. | Sayre Borough | 4.8% | 1.2%(+3.57)#60 | 1.1%(+3.70)#848 |
| 61. | Spring Mount | 4.8% | 1.2%(+3.55)#61 | 1.1%(+3.68)#854 |
| 62. | Frisco | 4.8% | 1.2%(+3.53)#62 | 1.1%(+3.66)#863 |
| 63. | Media Borough | 4.7% | 1.2%(+3.52)#63 | 1.1%(+3.65)#867 |
| 64. | Pymatuning South | 4.6% | 1.2%(+3.42)#64 | 1.1%(+3.55)#897 |
| 65. | Clarks Summit Borough | 4.6% | 1.2%(+3.38)#65 | 1.1%(+3.51)#912 |
| 66. | Hayti | 4.6% | 1.2%(+3.36)#66 | 1.1%(+3.50)#914 |
| 67. | Callimont Borough | 4.5% | 1.2%(+3.32)#67 | 1.1%(+3.45)#938 |
| 68. | Audubon | 4.5% | 1.2%(+3.27)#68 | 1.1%(+3.40)#957 |
| 69. | Churchill Borough | 4.5% | 1.2%(+3.26)#69 | 1.1%(+3.39)#958 |
| 70. | Wylandville | 4.5% | 1.2%(+3.24)#70 | 1.1%(+3.38)#966 |
| 71. | Volant Borough | 4.4% | 1.2%(+3.22)#71 | 1.1%(+3.35)#976 |
| 72. | Grill | 4.4% | 1.2%(+3.18)#72 | 1.1%(+3.31)#994 |
| 73. | Masthope | 4.4% | 1.2%(+3.16)#73 | 1.1%(+3.30)#1,000 |
| 74. | Whitfield | 4.4% | 1.2%(+3.13)#74 | 1.1%(+3.26)#1,016 |
| 75. | Pleasantville Borough Bedford County | 4.3% | 1.2%(+3.13)#75 | 1.1%(+3.26)#1,024 |
| 76. | Hometown | 4.3% | 1.2%(+3.05)#76 | 1.1%(+3.18)#1,048 |
| 77. | Conestoga | 4.2% | 1.2%(+3.00)#77 | 1.1%(+3.13)#1,070 |
| 78. | Chalfont Borough | 4.2% | 1.2%(+2.95)#78 | 1.1%(+3.08)#1,090 |
| 79. | North Philipsburg | 4.1% | 1.2%(+2.90)#79 | 1.1%(+3.03)#1,111 |
| 80. | Howard Borough | 4.1% | 1.2%(+2.87)#80 | 1.1%(+3.00)#1,115 |
| 81. | Haysville Borough | 4.1% | 1.2%(+2.86)#81 | 1.1%(+2.99)#1,122 |
| 82. | Narberth Borough | 4.0% | 1.2%(+2.82)#82 | 1.1%(+2.95)#1,140 |
| 83. | Wyndmoor | 4.0% | 1.2%(+2.82)#83 | 1.1%(+2.95)#1,142 |
| 84. | Skippack | 4.0% | 1.2%(+2.80)#84 | 1.1%(+2.93)#1,152 |
| 85. | Earlston | 4.0% | 1.2%(+2.78)#85 | 1.1%(+2.91)#1,162 |
| 86. | Oswayo Borough | 4.0% | 1.2%(+2.78)#86 | 1.1%(+2.91)#1,170 |
| 87. | Newtown Borough | 4.0% | 1.2%(+2.77)#87 | 1.1%(+2.90)#1,175 |
| 88. | Kulpsville | 4.0% | 1.2%(+2.76)#88 | 1.1%(+2.89)#1,177 |
| 89. | Little Meadows Borough | 3.9% | 1.2%(+2.66)#89 | 1.1%(+2.79)#1,234 |
| 90. | Chestnut Hill | 3.9% | 1.2%(+2.64)#90 | 1.1%(+2.77)#1,245 |
| 91. | Hokendauqua | 3.8% | 1.2%(+2.60)#91 | 1.1%(+2.73)#1,268 |
| 92. | Modena Borough | 3.8% | 1.2%(+2.57)#92 | 1.1%(+2.70)#1,277 |
| 93. | Lake Winola | 3.8% | 1.2%(+2.54)#93 | 1.1%(+2.68)#1,288 |
| 94. | Lake City Borough | 3.7% | 1.2%(+2.50)#94 | 1.1%(+2.63)#1,307 |
| 95. | Nescopeck Borough | 3.7% | 1.2%(+2.47)#95 | 1.1%(+2.60)#1,336 |
| 96. | Harveys Lake Borough | 3.6% | 1.2%(+2.42)#96 | 1.1%(+2.55)#1,379 |
| 97. | Exton | 3.6% | 1.2%(+2.41)#97 | 1.1%(+2.54)#1,386 |
| 98. | Hyde | 3.6% | 1.2%(+2.40)#98 | 1.1%(+2.53)#1,392 |
| 99. | Philipsburg Borough | 3.6% | 1.2%(+2.37)#99 | 1.1%(+2.50)#1,405 |
| 100. | Kempton | 3.6% | 1.2%(+2.35)#100 | 1.1%(+2.48)#1,421 |
Common Questions
What are the Top 10 Cities with the Highest Percentage of Population Employed in Life, Physical & Social Science in Pennsylvania?
Top 10 Cities with the Highest Percentage of Population Employed in Life, Physical & Social Science in Pennsylvania are:
#1
57.1%
#2
23.1%
#3
17.3%
#4
15.7%
#5
15.6%
#6
14.5%
#7
9.7%
#8
9.7%
#9
9.4%
#10
8.4%
What city has the Highest Percentage of Population Employed in Life, Physical & Social Science in Pennsylvania?
Harrison City has the Highest Percentage of Population Employed in Life, Physical & Social Science in Pennsylvania with 57.1%.
What is the Percentage of Population Employed in Life, Physical & Social Science in the State of Pennsylvania?
Percentage of Population Employed in Life, Physical & Social Science in Pennsylvania is 1.2%.
What is the Percentage of Population Employed in Life, Physical & Social Science in the United States?
Percentage of Population Employed in Life, Physical & Social Science in the United States is 1.1%.