West Park, CA Map & Demographics
West Park Map
West Park Overview
$25,848
PER CAPITA INCOME
$70,625
AVG FAMILY INCOME
$71,250
AVG HOUSEHOLD INCOME
4.6%
WAGE / INCOME GAP [ % ]
95.4¢/ $1
WAGE / INCOME GAP [ $ ]
0.46
INEQUALITY / GINI INDEX
1,148
TOTAL POPULATION
632
MALE POPULATION
516
FEMALE POPULATION
122.48
MALES / 100 FEMALES
81.65
FEMALES / 100 MALES
30.9
MEDIAN AGE
5.0
AVG FAMILY SIZE
4.5
AVG HOUSEHOLD SIZE
487
LABOR FORCE [ PEOPLE ]
58.3%
PERCENT IN LABOR FORCE
14.0%
UNEMPLOYMENT RATE
Income in West Park
Income Overview in West Park
Per Capita Income in West Park is $25,848, while median incomes of families and households are $70,625 and $71,250 respectively.
| Characteristic | Number | Measure |
| Per Capita Income | 1,148 | $25,848 |
| Median Family Income | 203 | $70,625 |
| Mean Family Income | 203 | $95,398 |
| Median Household Income | 256 | $71,250 |
| Mean Household Income | 256 | $103,617 |
| Income Deficit | 203 | $0 |
| Wage / Income Gap (%) | 1,148 | 4.57% |
| Wage / Income Gap ($) | 1,148 | 95.43¢ per $1 |
| Gini / Inequality Index | 1,148 | 0.46 |
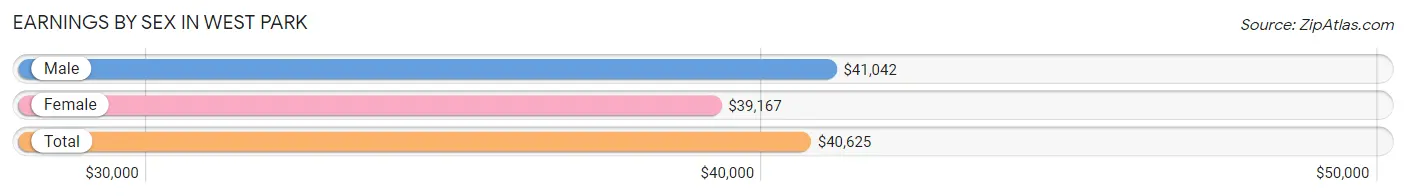
Earnings by Sex in West Park
Average Earnings in West Park are $40,625, $41,042 for men and $39,167 for women, a difference of 4.6%.
| Sex | Number | Average Earnings |
| Male | 261 (57.6%) | $41,042 |
| Female | 192 (42.4%) | $39,167 |
| Total | 453 (100.0%) | $40,625 |
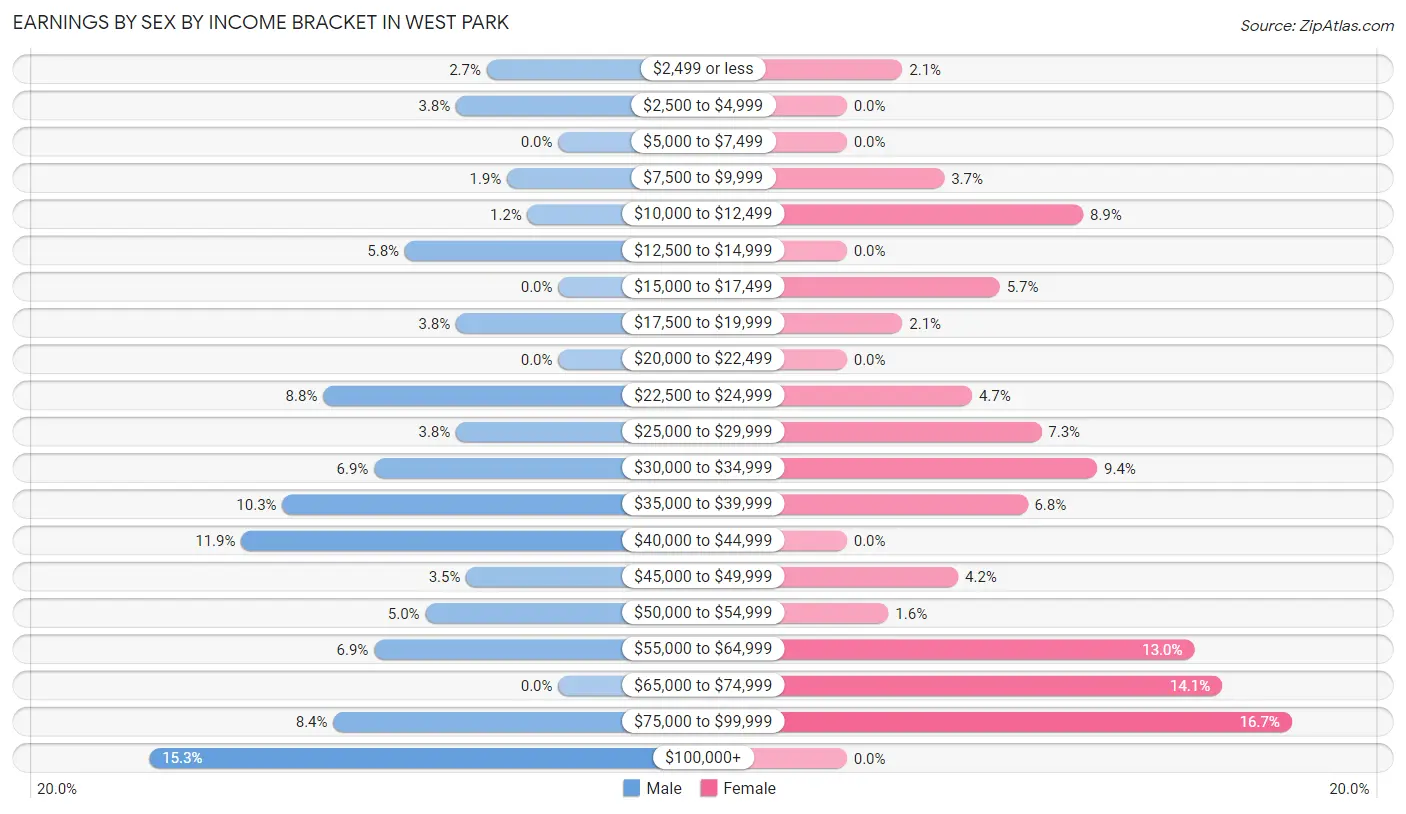
Earnings by Sex by Income Bracket in West Park
The most common earnings brackets in West Park are $100,000+ for men (40 | 15.3%) and $75,000 to $99,999 for women (32 | 16.7%).
| Income | Male | Female |
| $2,499 or less | 7 (2.7%) | 4 (2.1%) |
| $2,500 to $4,999 | 10 (3.8%) | 0 (0.0%) |
| $5,000 to $7,499 | 0 (0.0%) | 0 (0.0%) |
| $7,500 to $9,999 | 5 (1.9%) | 7 (3.6%) |
| $10,000 to $12,499 | 3 (1.1%) | 17 (8.8%) |
| $12,500 to $14,999 | 15 (5.8%) | 0 (0.0%) |
| $15,000 to $17,499 | 0 (0.0%) | 11 (5.7%) |
| $17,500 to $19,999 | 10 (3.8%) | 4 (2.1%) |
| $20,000 to $22,499 | 0 (0.0%) | 0 (0.0%) |
| $22,500 to $24,999 | 23 (8.8%) | 9 (4.7%) |
| $25,000 to $29,999 | 10 (3.8%) | 14 (7.3%) |
| $30,000 to $34,999 | 18 (6.9%) | 18 (9.4%) |
| $35,000 to $39,999 | 27 (10.3%) | 13 (6.8%) |
| $40,000 to $44,999 | 31 (11.9%) | 0 (0.0%) |
| $45,000 to $49,999 | 9 (3.5%) | 8 (4.2%) |
| $50,000 to $54,999 | 13 (5.0%) | 3 (1.6%) |
| $55,000 to $64,999 | 18 (6.9%) | 25 (13.0%) |
| $65,000 to $74,999 | 0 (0.0%) | 27 (14.1%) |
| $75,000 to $99,999 | 22 (8.4%) | 32 (16.7%) |
| $100,000+ | 40 (15.3%) | 0 (0.0%) |
| Total | 261 (100.0%) | 192 (100.0%) |
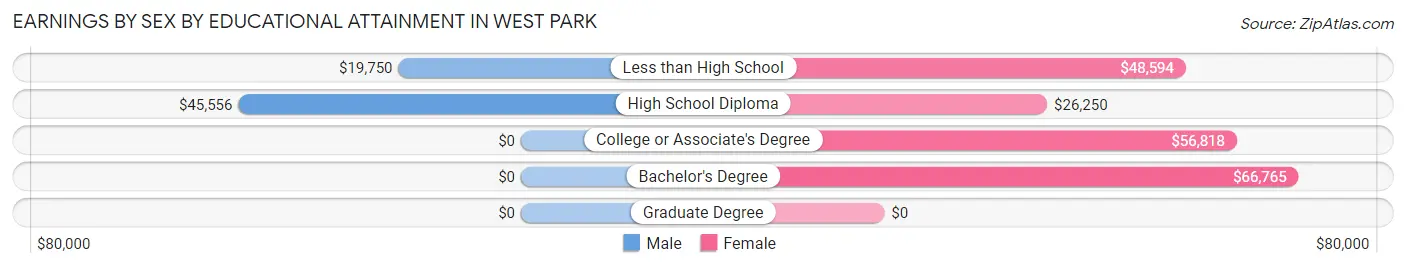
Earnings by Sex by Educational Attainment in West Park
Average earnings in West Park are $43,200 for men and $56,477 for women, a difference of 23.5%. Men with an educational attainment of high school diploma enjoy the highest average annual earnings of $45,556, while those with less than high school education earn the least with $19,750. Women with an educational attainment of bachelor's degree earn the most with the average annual earnings of $66,765, while those with high school diploma education have the smallest earnings of $26,250.
| Educational Attainment | Male Income | Female Income |
| Less than High School | $19,750 | $48,594 |
| High School Diploma | $45,556 | $26,250 |
| College or Associate's Degree | - | - |
| Bachelor's Degree | - | - |
| Graduate Degree | - | - |
| Total | $43,200 | $56,477 |
Family Income in West Park
Family Income Brackets in West Park
According to the West Park family income data, there are 52 families falling into the $100,000 to $149,999 income range, which is the most common income bracket and makes up 25.6% of all families. Conversely, the $150,000 to $199,999 income bracket is the least frequent group with only 4 families (2.0%) belonging to this category.
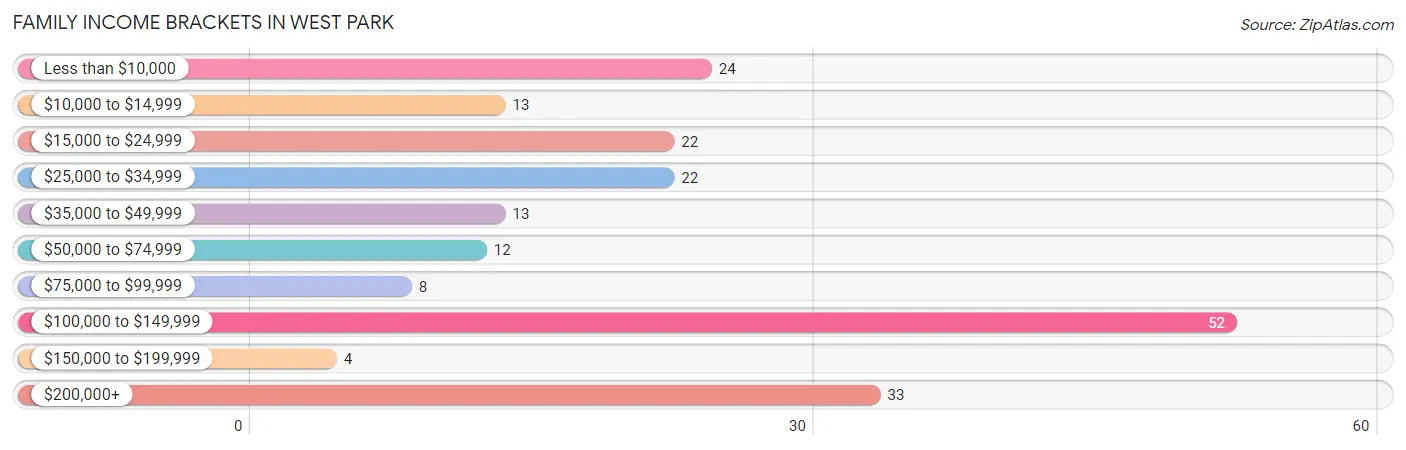
| Income Bracket | # Families | % Families |
| Less than $10,000 | 24 | 11.8% |
| $10,000 to $14,999 | 13 | 6.4% |
| $15,000 to $24,999 | 22 | 10.8% |
| $25,000 to $34,999 | 22 | 10.8% |
| $35,000 to $49,999 | 13 | 6.4% |
| $50,000 to $74,999 | 12 | 5.9% |
| $75,000 to $99,999 | 8 | 3.9% |
| $100,000 to $149,999 | 52 | 25.6% |
| $150,000 to $199,999 | 4 | 2.0% |
| $200,000+ | 33 | 16.3% |
Family Income by Famaliy Size in West Park
7+ person families (22 | 10.8%) account for the highest median family income in West Park with $176,250 per family, while 2-person families (40 | 19.7%) have the highest median income of $52,857 per family member.
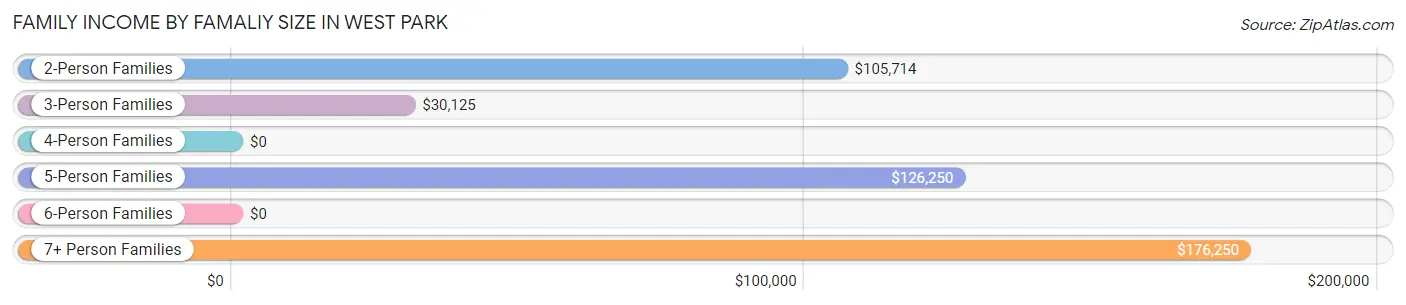
| Income Bracket | # Families | Median Income |
| 2-Person Families | 40 (19.7%) | $105,714 |
| 3-Person Families | 51 (25.1%) | $30,125 |
| 4-Person Families | 28 (13.8%) | $0 |
| 5-Person Families | 21 (10.3%) | $126,250 |
| 6-Person Families | 41 (20.2%) | $0 |
| 7+ Person Families | 22 (10.8%) | $176,250 |
| Total | 203 (100.0%) | $70,625 |
Family Income by Number of Earners in West Park
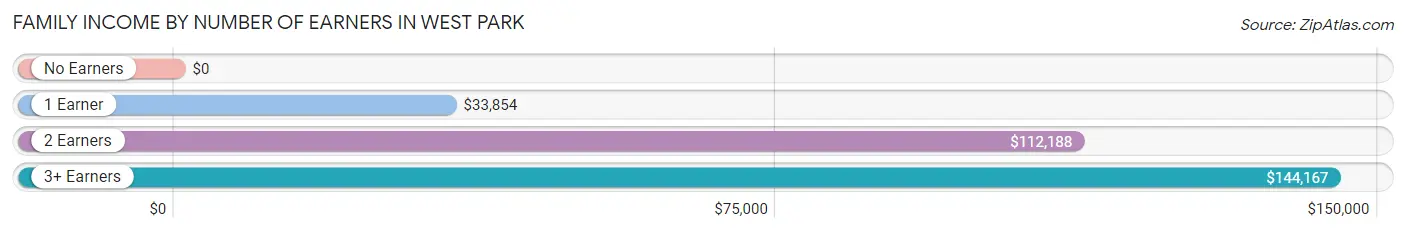
| Number of Earners | # Families | Median Income |
| No Earners | 65 (32.0%) | $0 |
| 1 Earner | 41 (20.2%) | $33,854 |
| 2 Earners | 61 (30.0%) | $112,188 |
| 3+ Earners | 36 (17.7%) | $144,167 |
| Total | 203 (100.0%) | $70,625 |
Household Income in West Park
Household Income Brackets in West Park
With 52 households falling in the category, the $100,000 to $149,999 income range is the most frequent in West Park, accounting for 20.3% of all households. In contrast, only 10 households (3.9%) fall into the $150,000 to $199,999 income bracket, making it the least populous group.
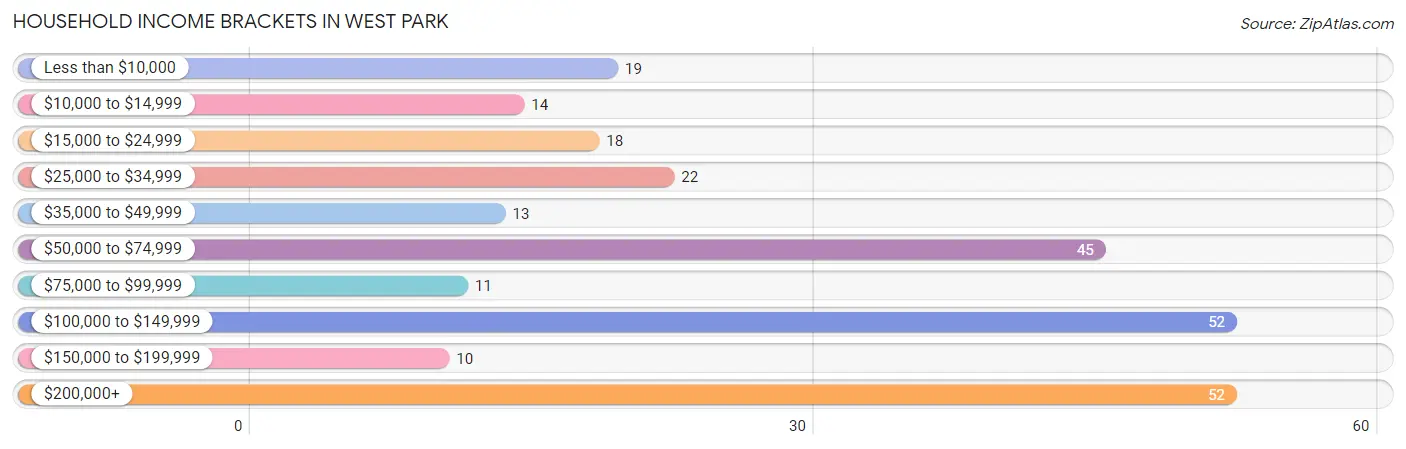
| Income Bracket | # Households | % Households |
| Less than $10,000 | 19 | 7.4% |
| $10,000 to $14,999 | 14 | 5.5% |
| $15,000 to $24,999 | 18 | 7.0% |
| $25,000 to $34,999 | 22 | 8.6% |
| $35,000 to $49,999 | 13 | 5.1% |
| $50,000 to $74,999 | 45 | 17.6% |
| $75,000 to $99,999 | 11 | 4.3% |
| $100,000 to $149,999 | 52 | 20.3% |
| $150,000 to $199,999 | 10 | 3.9% |
| $200,000+ | 52 | 20.3% |
Household Income by Householder Age in West Park
The median household income in West Park is $71,250, with the highest median household income of $107,143 found in the 45 to 64 years age bracket for the primary householder. A total of 124 households (48.4%) fall into this category. Meanwhile, the 15 to 24 years age bracket for the primary householder has the lowest median household income of $0, with 9 households (3.5%) in this group.
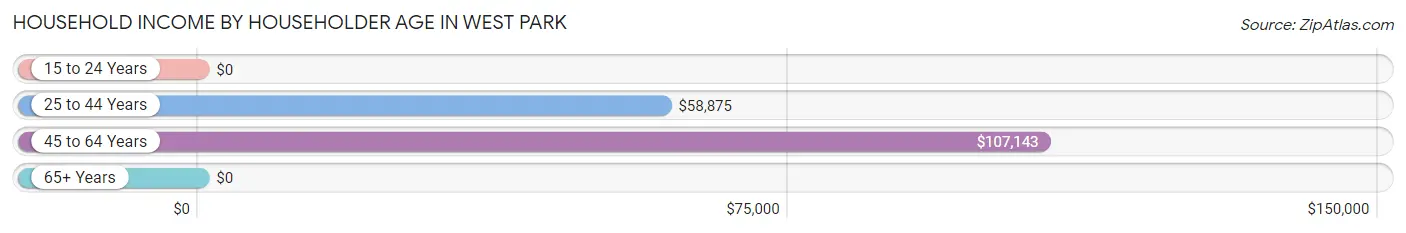
| Income Bracket | # Households | Median Income |
| 15 to 24 Years | 9 (3.5%) | $0 |
| 25 to 44 Years | 70 (27.3%) | $58,875 |
| 45 to 64 Years | 124 (48.4%) | $107,143 |
| 65+ Years | 53 (20.7%) | $0 |
| Total | 256 (100.0%) | $71,250 |
Poverty in West Park
Income Below Poverty by Sex and Age in West Park
With 28.3% poverty level for males and 27.3% for females among the residents of West Park, 18 to 24 year old males and 12 to 14 year old females are the most vulnerable to poverty, with 22 males (51.2%) and 9 females (100.0%) in their respective age groups living below the poverty level.
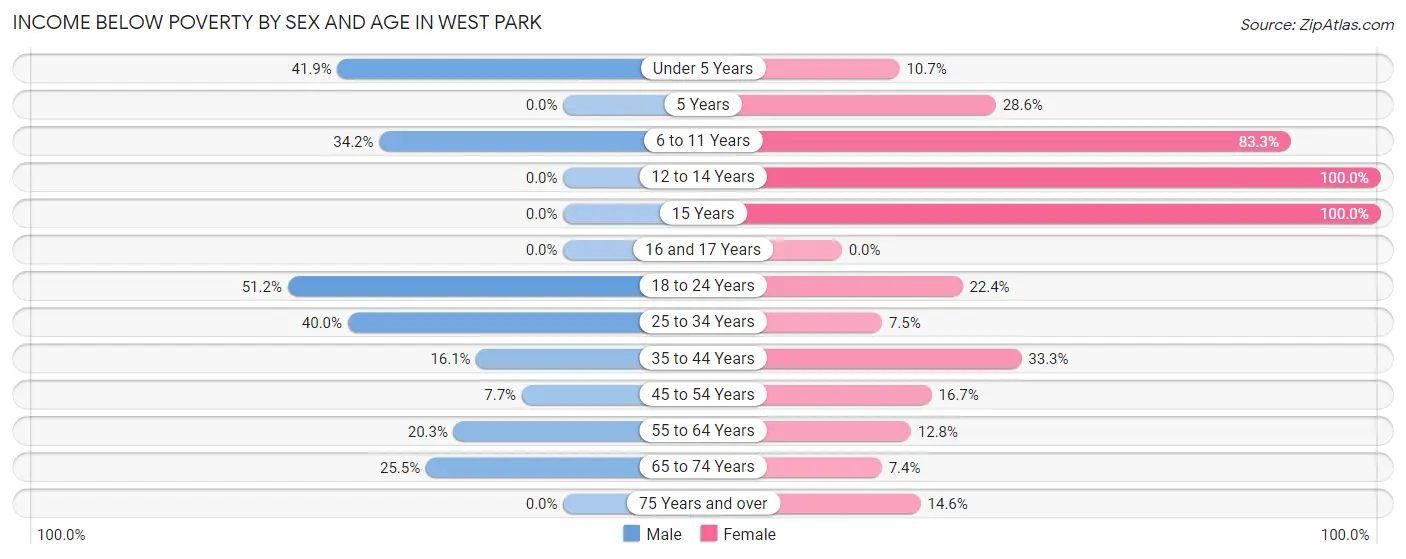
| Age Bracket | Male | Female |
| Under 5 Years | 44 (41.9%) | 6 (10.7%) |
| 5 Years | 0 (0.0%) | 6 (28.6%) |
| 6 to 11 Years | 14 (34.2%) | 50 (83.3%) |
| 12 to 14 Years | 0 (0.0%) | 9 (100.0%) |
| 15 Years | 0 (0.0%) | 14 (100.0%) |
| 16 and 17 Years | 0 (0.0%) | 0 (0.0%) |
| 18 to 24 Years | 22 (51.2%) | 15 (22.4%) |
| 25 to 34 Years | 58 (40.0%) | 5 (7.5%) |
| 35 to 44 Years | 10 (16.1%) | 12 (33.3%) |
| 45 to 54 Years | 6 (7.7%) | 6 (16.7%) |
| 55 to 64 Years | 12 (20.3%) | 10 (12.8%) |
| 65 to 74 Years | 13 (25.5%) | 2 (7.4%) |
| 75 Years and over | 0 (0.0%) | 6 (14.6%) |
| Total | 179 (28.3%) | 141 (27.3%) |
Income Above Poverty by Sex and Age in West Park
According to the poverty statistics in West Park, males aged 12 to 14 years and females aged 16 and 17 years are the age groups that are most secure financially, with 100.0% of males and 100.0% of females in these age groups living above the poverty line.
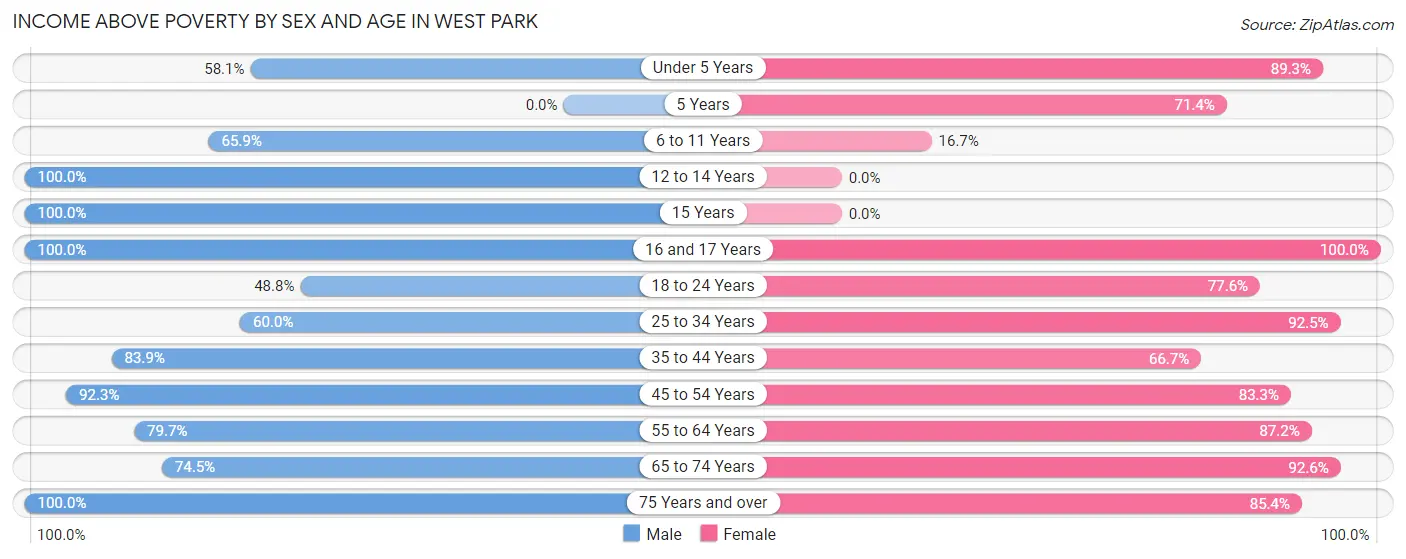
| Age Bracket | Male | Female |
| Under 5 Years | 61 (58.1%) | 50 (89.3%) |
| 5 Years | 0 (0.0%) | 15 (71.4%) |
| 6 to 11 Years | 27 (65.8%) | 10 (16.7%) |
| 12 to 14 Years | 5 (100.0%) | 0 (0.0%) |
| 15 Years | 2 (100.0%) | 0 (0.0%) |
| 16 and 17 Years | 7 (100.0%) | 4 (100.0%) |
| 18 to 24 Years | 21 (48.8%) | 52 (77.6%) |
| 25 to 34 Years | 87 (60.0%) | 62 (92.5%) |
| 35 to 44 Years | 52 (83.9%) | 24 (66.7%) |
| 45 to 54 Years | 72 (92.3%) | 30 (83.3%) |
| 55 to 64 Years | 47 (79.7%) | 68 (87.2%) |
| 65 to 74 Years | 38 (74.5%) | 25 (92.6%) |
| 75 Years and over | 34 (100.0%) | 35 (85.4%) |
| Total | 453 (71.7%) | 375 (72.7%) |
Income Below Poverty Among Married-Couple Families in West Park
The poverty statistics for married-couple families in West Park show that 20.8% or 27 of the total 130 families live below the poverty line. Families with 5 or more children have the highest poverty rate of 100.0%, comprising of 5 families. On the other hand, families with 1 or 2 children have the lowest poverty rate of 0.0%, which includes 0 families.
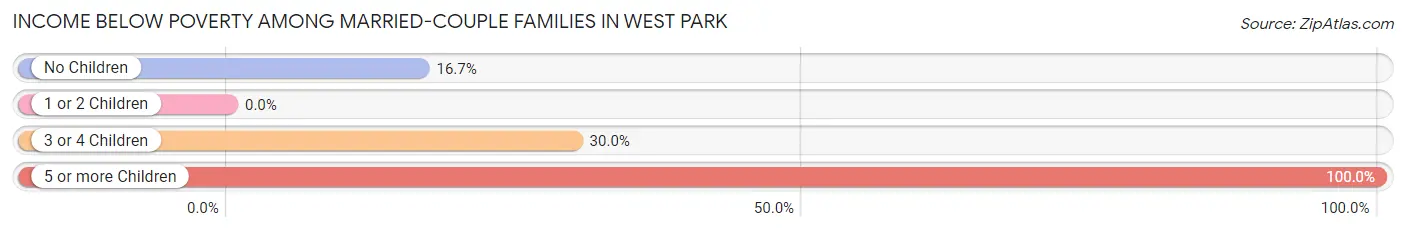
| Children | Above Poverty | Below Poverty |
| No Children | 65 (83.3%) | 13 (16.7%) |
| 1 or 2 Children | 17 (100.0%) | 0 (0.0%) |
| 3 or 4 Children | 21 (70.0%) | 9 (30.0%) |
| 5 or more Children | 0 (0.0%) | 5 (100.0%) |
| Total | 103 (79.2%) | 27 (20.8%) |
Income Below Poverty Among Single-Parent Households in West Park
According to the poverty data in West Park, 53.5% or 23 single-father households and 33.3% or 10 single-mother households are living below the poverty line. Among single-father households, those with 3 or 4 children have the highest poverty rate, with 12 households (100.0%) experiencing poverty. Likewise, among single-mother households, those with 1 or 2 children have the highest poverty rate, with 10 households (100.0%) falling below the poverty line.
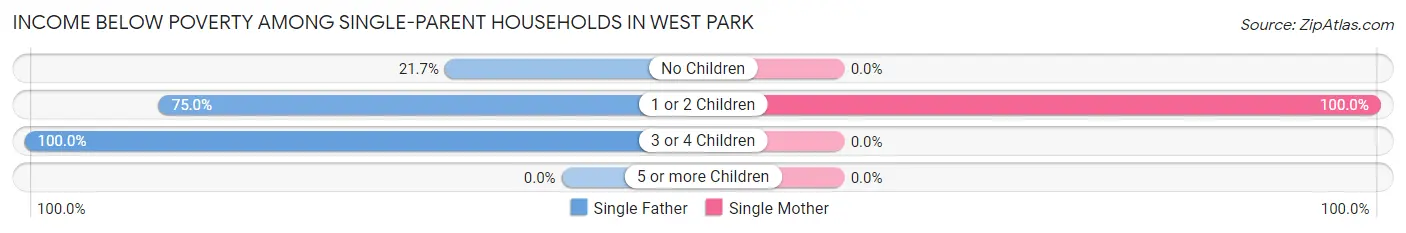
| Children | Single Father | Single Mother |
| No Children | 5 (21.7%) | 0 (0.0%) |
| 1 or 2 Children | 6 (75.0%) | 10 (100.0%) |
| 3 or 4 Children | 12 (100.0%) | 0 (0.0%) |
| 5 or more Children | 0 (0.0%) | 0 (0.0%) |
| Total | 23 (53.5%) | 10 (33.3%) |
Income Below Poverty Among Married-Couple vs Single-Parent Households in West Park
The poverty data for West Park shows that 27 of the married-couple family households (20.8%) and 33 of the single-parent households (45.2%) are living below the poverty level. Within the married-couple family households, those with 5 or more children have the highest poverty rate, with 5 households (100.0%) falling below the poverty line. Among the single-parent households, those with 1 or 2 children have the highest poverty rate, with 16 household (88.9%) living below poverty.
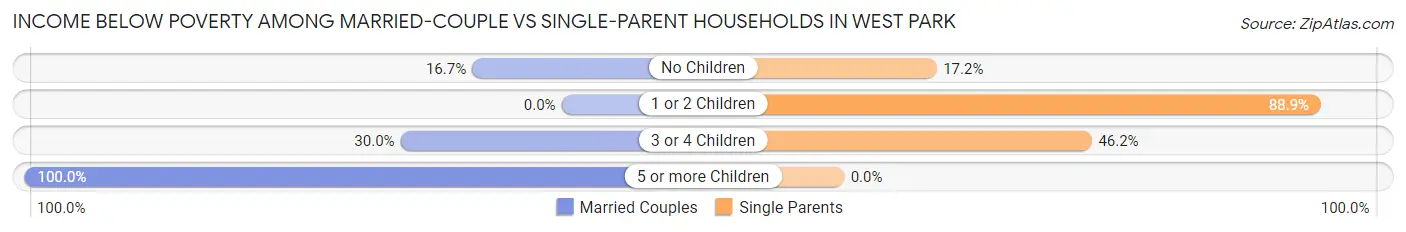
| Children | Married-Couple Families | Single-Parent Households |
| No Children | 13 (16.7%) | 5 (17.2%) |
| 1 or 2 Children | 0 (0.0%) | 16 (88.9%) |
| 3 or 4 Children | 9 (30.0%) | 12 (46.2%) |
| 5 or more Children | 5 (100.0%) | 0 (0.0%) |
| Total | 27 (20.8%) | 33 (45.2%) |
Race in West Park
The most populous races in West Park are Hispanic or Latino (830 | 72.3%), White / Caucasian (459 | 40.0%), and Asian (235 | 20.5%).
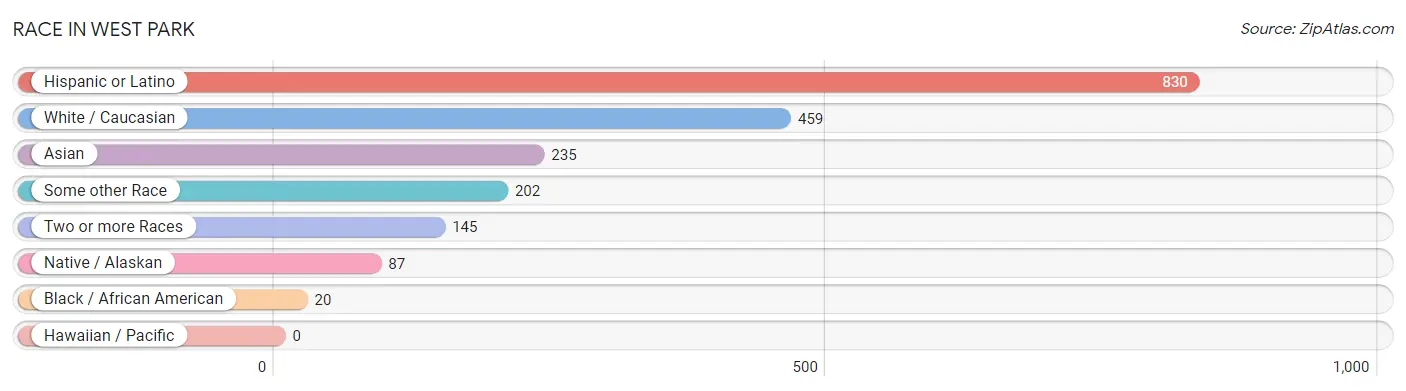
| Race | # Population | % Population |
| Asian | 235 | 20.5% |
| Black / African American | 20 | 1.7% |
| Hawaiian / Pacific | 0 | 0.0% |
| Hispanic or Latino | 830 | 72.3% |
| Native / Alaskan | 87 | 7.6% |
| White / Caucasian | 459 | 40.0% |
| Two or more Races | 145 | 12.6% |
| Some other Race | 202 | 17.6% |
| Total | 1,148 | 100.0% |
Ancestry in West Park
The most populous ancestries reported in West Park are Mexican (830 | 72.3%), Indian (Asian) (126 | 11.0%), Bangladeshi (85 | 7.4%), Bhutanese (21 | 1.8%), and Mexican American Indian (21 | 1.8%), together accounting for 94.3% of all West Park residents.
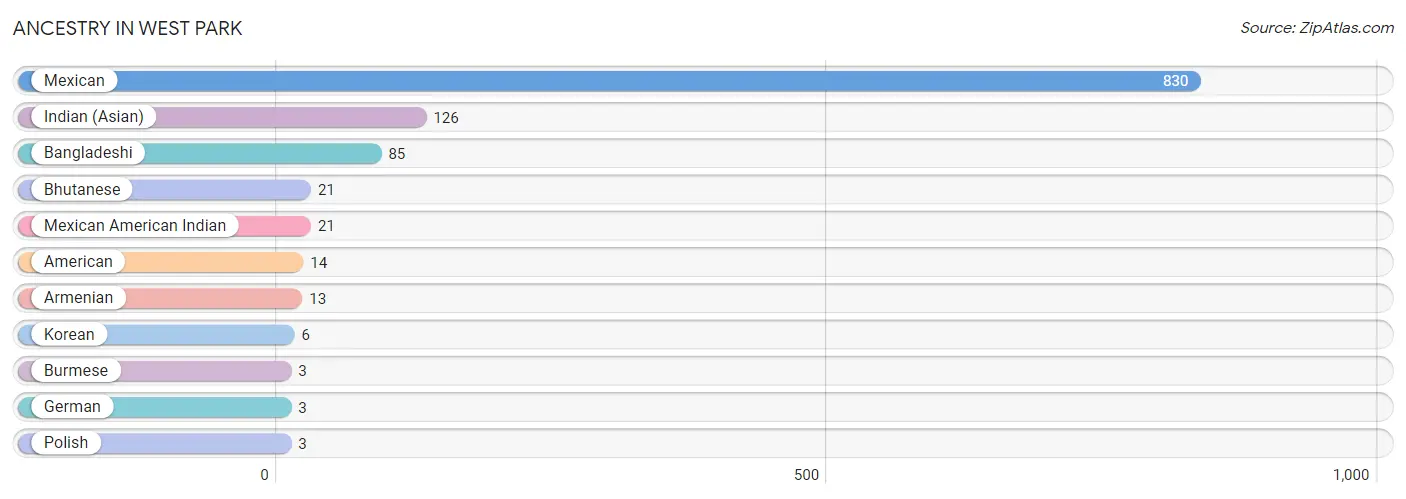
| Ancestry | # Population | % Population |
| American | 14 | 1.2% |
| Armenian | 13 | 1.1% |
| Bangladeshi | 85 | 7.4% |
| Bhutanese | 21 | 1.8% |
| Burmese | 3 | 0.3% |
| German | 3 | 0.3% |
| Indian (Asian) | 126 | 11.0% |
| Korean | 6 | 0.5% |
| Mexican | 830 | 72.3% |
| Mexican American Indian | 21 | 1.8% |
| Polish | 3 | 0.3% | View All 11 Rows |
Immigrants in West Park
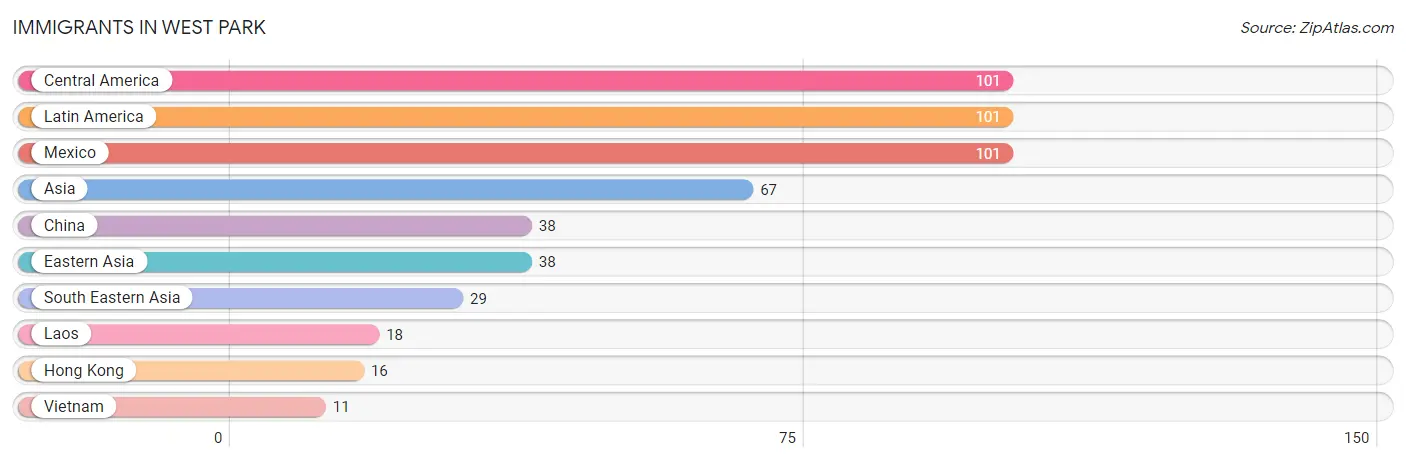
The most numerous immigrant groups reported in West Park came from Central America (101 | 8.8%), Latin America (101 | 8.8%), Mexico (101 | 8.8%), Asia (67 | 5.8%), and China (38 | 3.3%), together accounting for 35.6% of all West Park residents.
| Immigration Origin | # Population | % Population |
| Asia | 67 | 5.8% |
| Central America | 101 | 8.8% |
| China | 38 | 3.3% |
| Eastern Asia | 38 | 3.3% |
| Hong Kong | 16 | 1.4% |
| Laos | 18 | 1.6% |
| Latin America | 101 | 8.8% |
| Mexico | 101 | 8.8% |
| South Eastern Asia | 29 | 2.5% |
| Vietnam | 11 | 1.0% | View All 10 Rows |
Sex and Age in West Park
Sex and Age in West Park
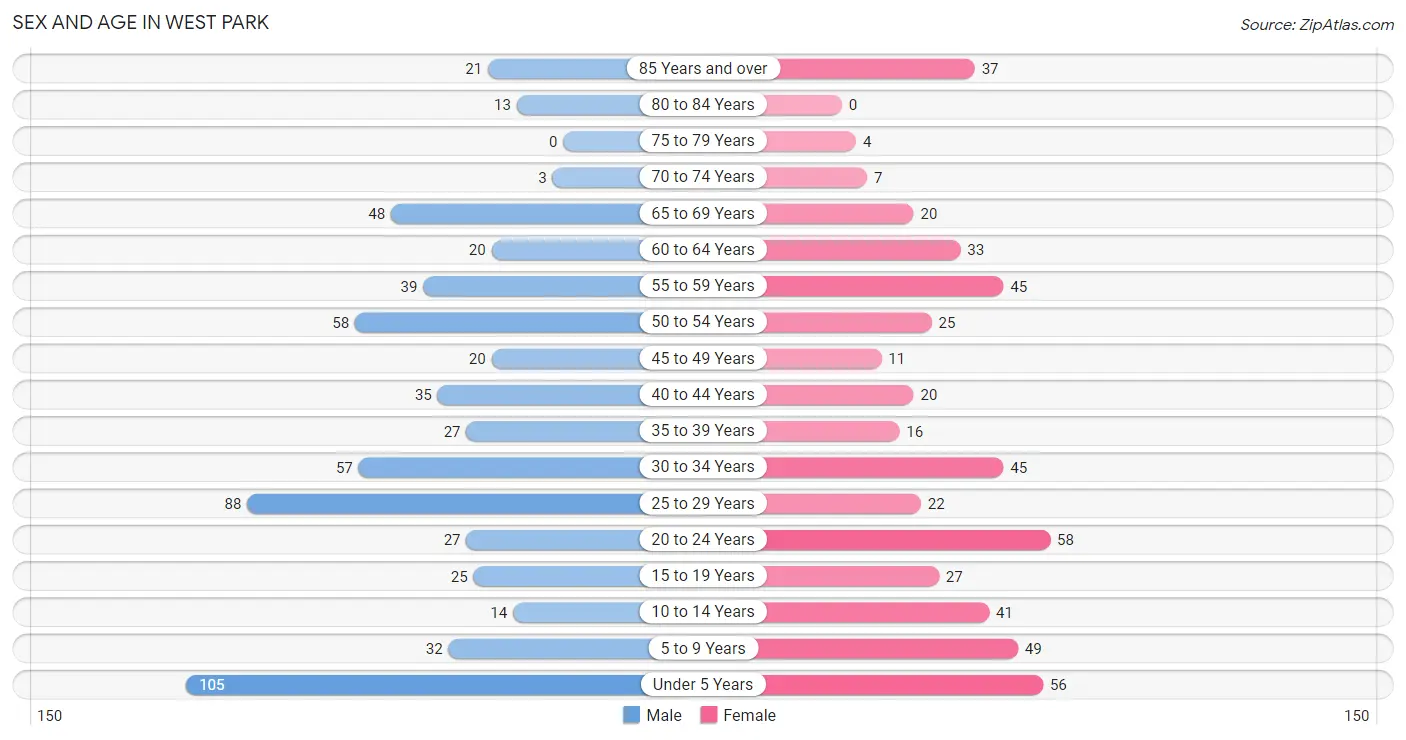
The most populous age groups in West Park are Under 5 Years (105 | 16.6%) for men and 20 to 24 Years (58 | 11.2%) for women.
| Age Bracket | Male | Female |
| Under 5 Years | 105 (16.6%) | 56 (10.8%) |
| 5 to 9 Years | 32 (5.1%) | 49 (9.5%) |
| 10 to 14 Years | 14 (2.2%) | 41 (8.0%) |
| 15 to 19 Years | 25 (4.0%) | 27 (5.2%) |
| 20 to 24 Years | 27 (4.3%) | 58 (11.2%) |
| 25 to 29 Years | 88 (13.9%) | 22 (4.3%) |
| 30 to 34 Years | 57 (9.0%) | 45 (8.7%) |
| 35 to 39 Years | 27 (4.3%) | 16 (3.1%) |
| 40 to 44 Years | 35 (5.5%) | 20 (3.9%) |
| 45 to 49 Years | 20 (3.2%) | 11 (2.1%) |
| 50 to 54 Years | 58 (9.2%) | 25 (4.8%) |
| 55 to 59 Years | 39 (6.2%) | 45 (8.7%) |
| 60 to 64 Years | 20 (3.2%) | 33 (6.4%) |
| 65 to 69 Years | 48 (7.6%) | 20 (3.9%) |
| 70 to 74 Years | 3 (0.5%) | 7 (1.4%) |
| 75 to 79 Years | 0 (0.0%) | 4 (0.8%) |
| 80 to 84 Years | 13 (2.1%) | 0 (0.0%) |
| 85 Years and over | 21 (3.3%) | 37 (7.2%) |
| Total | 632 (100.0%) | 516 (100.0%) |
Families and Households in West Park
Median Family Size in West Park
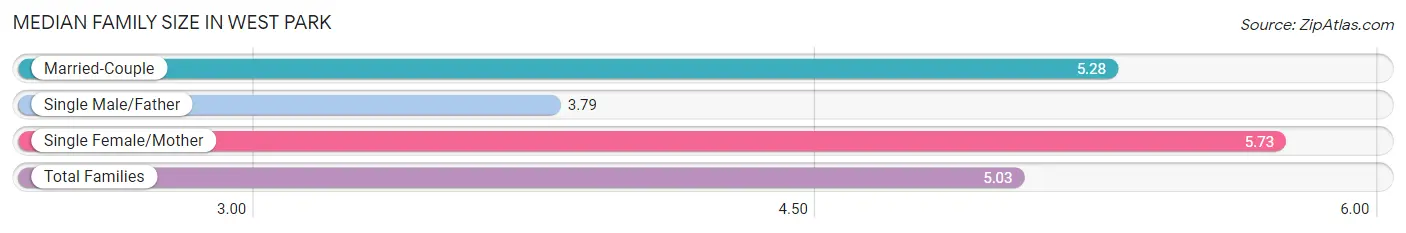
The median family size in West Park is 5.03 persons per family, with single female/mother families (30 | 14.8%) accounting for the largest median family size of 5.73 persons per family. On the other hand, single male/father families (43 | 21.2%) represent the smallest median family size with 3.79 persons per family.
| Family Type | # Families | Family Size |
| Married-Couple | 130 (64.0%) | 5.28 |
| Single Male/Father | 43 (21.2%) | 3.79 |
| Single Female/Mother | 30 (14.8%) | 5.73 |
| Total Families | 203 (100.0%) | 5.03 |
Median Household Size in West Park
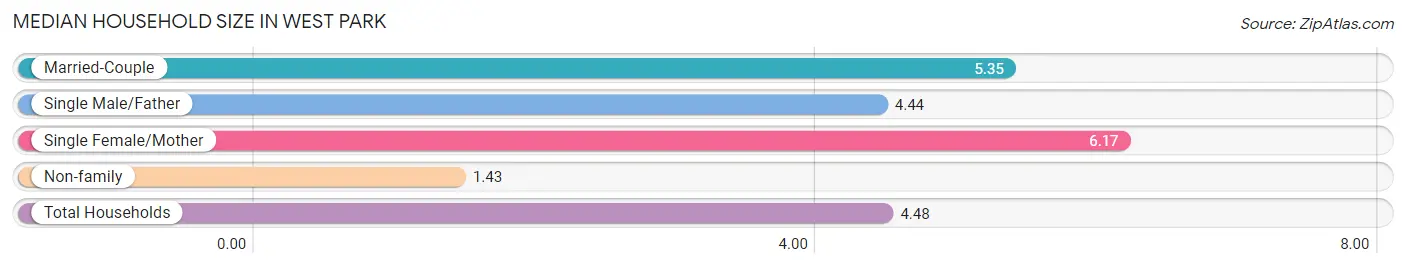
The median household size in West Park is 4.48 persons per household, with single female/mother households (30 | 11.7%) accounting for the largest median household size of 6.17 persons per household. non-family households (53 | 20.7%) represent the smallest median household size with 1.43 persons per household.
| Household Type | # Households | Household Size |
| Married-Couple | 130 (50.8%) | 5.35 |
| Single Male/Father | 43 (16.8%) | 4.44 |
| Single Female/Mother | 30 (11.7%) | 6.17 |
| Non-family | 53 (20.7%) | 1.43 |
| Total Households | 256 (100.0%) | 4.48 |
Household Size by Marriage Status in West Park
Out of a total of 256 households in West Park, 203 (79.3%) are family households, while 53 (20.7%) are nonfamily households. The most numerous type of family households are 6-person households, comprising 41, and the most common type of nonfamily households are 1-person households, comprising 28.
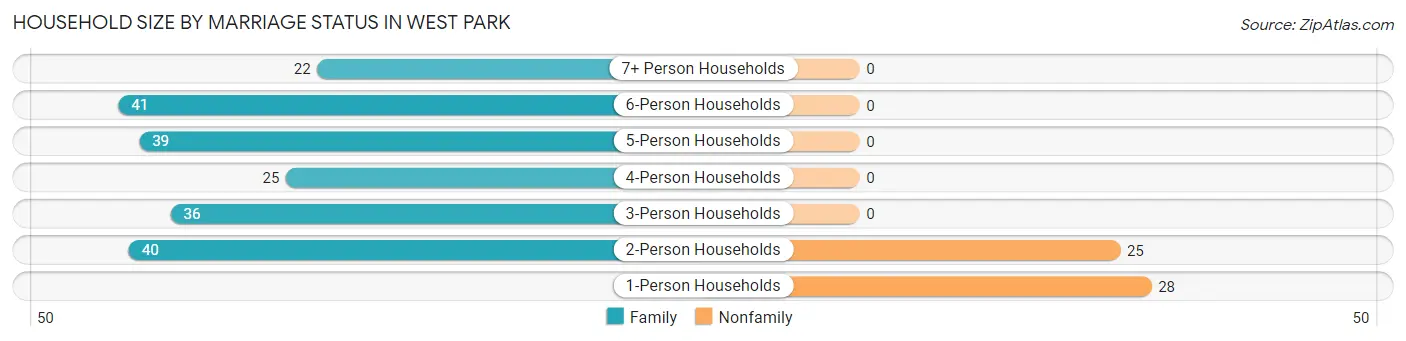
| Household Size | Family Households | Nonfamily Households |
| 1-Person Households | - | 28 (10.9%) |
| 2-Person Households | 40 (15.6%) | 25 (9.8%) |
| 3-Person Households | 36 (14.1%) | 0 (0.0%) |
| 4-Person Households | 25 (9.8%) | 0 (0.0%) |
| 5-Person Households | 39 (15.2%) | 0 (0.0%) |
| 6-Person Households | 41 (16.0%) | 0 (0.0%) |
| 7+ Person Households | 22 (8.6%) | 0 (0.0%) |
| Total | 203 (79.3%) | 53 (20.7%) |
Female Fertility in West Park
Fertility by Age in West Park
Average fertility rate in West Park is 102.0 births per 1,000 women. Women in the age bracket of 15 to 19 years have the highest fertility rate with 333.0 births per 1,000 women. Women in the age bracket of 35 to 50 years acount for 57.1% of all women with births.
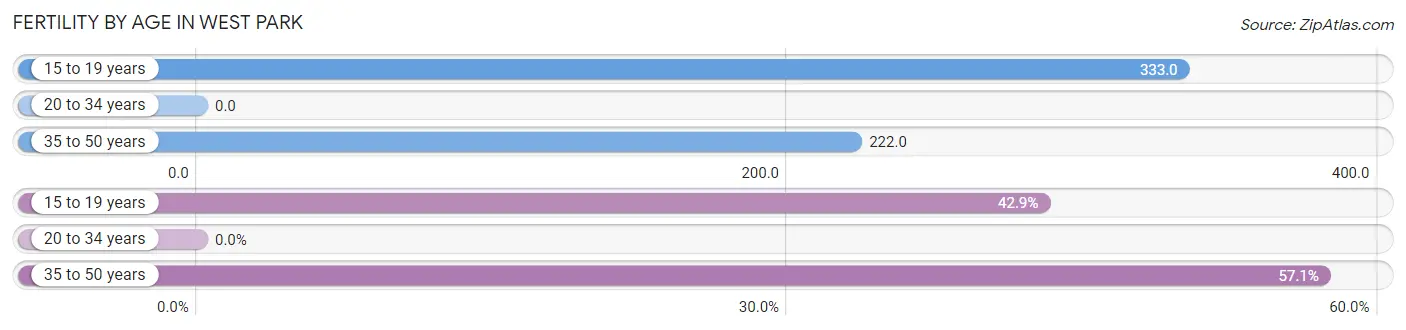
| Age Bracket | Women with Births | Births / 1,000 Women |
| 15 to 19 years | 9 (42.9%) | 333.0 |
| 20 to 34 years | 0 (0.0%) | 0.0 |
| 35 to 50 years | 12 (57.1%) | 222.0 |
| Total | 21 (100.0%) | 102.0 |
Fertility by Age by Marriage Status in West Park
42.9% of women with births (21) in West Park are married. The highest percentage of unmarried women with births falls into 15 to 19 years age bracket with 100.0% of them unmarried at the time of birth, while the lowest percentage of unmarried women with births belong to 35 to 50 years age bracket with 25.0% of them unmarried.
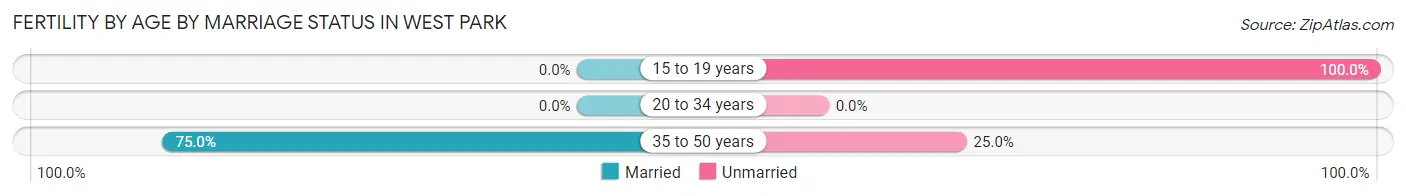
| Age Bracket | Married | Unmarried |
| 15 to 19 years | 0 (0.0%) | 9 (100.0%) |
| 20 to 34 years | 0 (0.0%) | 0 (0.0%) |
| 35 to 50 years | 9 (75.0%) | 3 (25.0%) |
| Total | 9 (42.9%) | 12 (57.1%) |
Fertility by Education in West Park
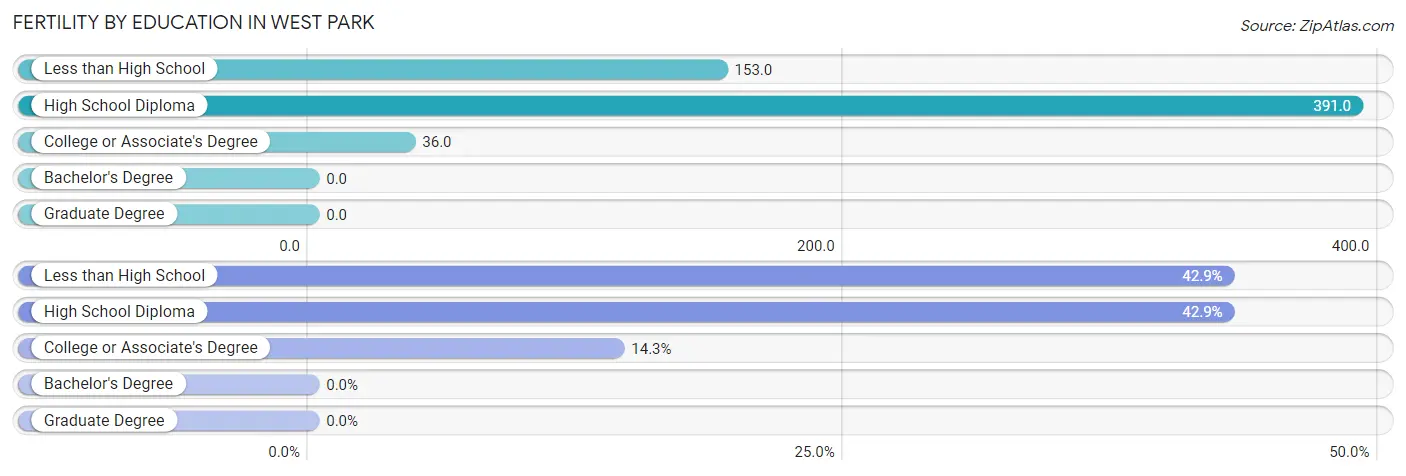
| Educational Attainment | Women with Births | Births / 1,000 Women |
| Less than High School | 9 (42.9%) | 153.0 |
| High School Diploma | 9 (42.9%) | 391.0 |
| College or Associate's Degree | 3 (14.3%) | 36.0 |
| Bachelor's Degree | 0 (0.0%) | 0.0 |
| Graduate Degree | 0 (0.0%) | 0.0 |
| Total | 21 (100.0%) | 102.0 |
Fertility by Education by Marriage Status in West Park
57.1% of women with births in West Park are unmarried. Women with the educational attainment of high school diploma are most likely to be married with 100.0% of them married at childbirth, while women with the educational attainment of less than high school are least likely to be married with 100.0% of them unmarried at childbirth.
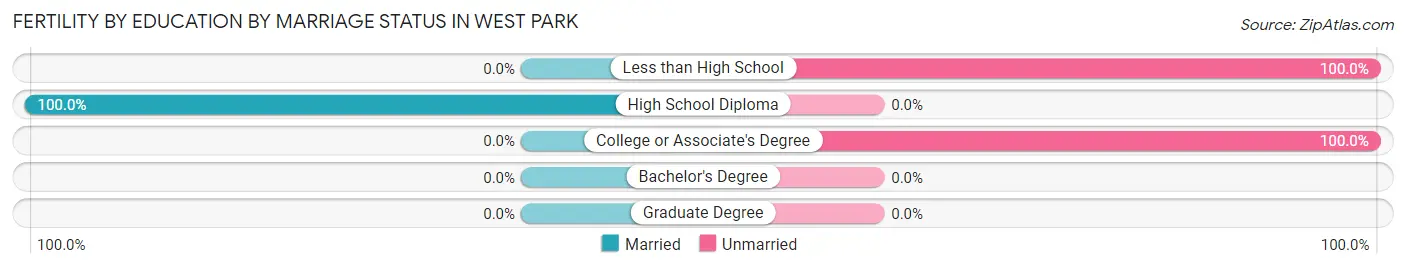
| Educational Attainment | Married | Unmarried |
| Less than High School | 0 (0.0%) | 9 (100.0%) |
| High School Diploma | 9 (100.0%) | 0 (0.0%) |
| College or Associate's Degree | 0 (0.0%) | 3 (100.0%) |
| Bachelor's Degree | 0 (0.0%) | 0 (0.0%) |
| Graduate Degree | 0 (0.0%) | 0 (0.0%) |
| Total | 9 (42.9%) | 12 (57.1%) |
Employment Characteristics in West Park
Employment by Class of Employer in West Park
Among the 419 employed individuals in West Park, private company employees (214 | 51.1%), local government employees (51 | 12.2%), and not-for-profit organizations (43 | 10.3%) make up the most common classes of employment.
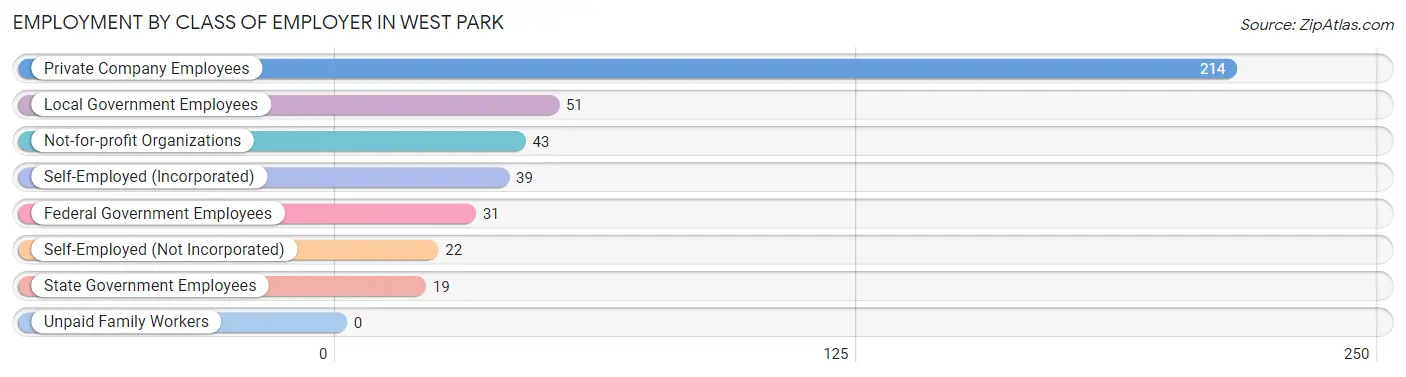
| Employer Class | # Employees | % Employees |
| Private Company Employees | 214 | 51.1% |
| Self-Employed (Incorporated) | 39 | 9.3% |
| Self-Employed (Not Incorporated) | 22 | 5.2% |
| Not-for-profit Organizations | 43 | 10.3% |
| Local Government Employees | 51 | 12.2% |
| State Government Employees | 19 | 4.5% |
| Federal Government Employees | 31 | 7.4% |
| Unpaid Family Workers | 0 | 0.0% |
| Total | 419 | 100.0% |
Employment Status by Age in West Park
According to the labor force statistics for West Park, out of the total population over 16 years of age (835), 58.3% or 487 individuals are in the labor force, with 14.0% or 68 of them unemployed. The age group with the highest labor force participation rate is 25 to 29 years, with 88.2% or 97 individuals in the labor force. Within the labor force, the 16 to 19 years age range has the highest percentage of unemployed individuals, with 100.0% or 10 of them being unemployed.
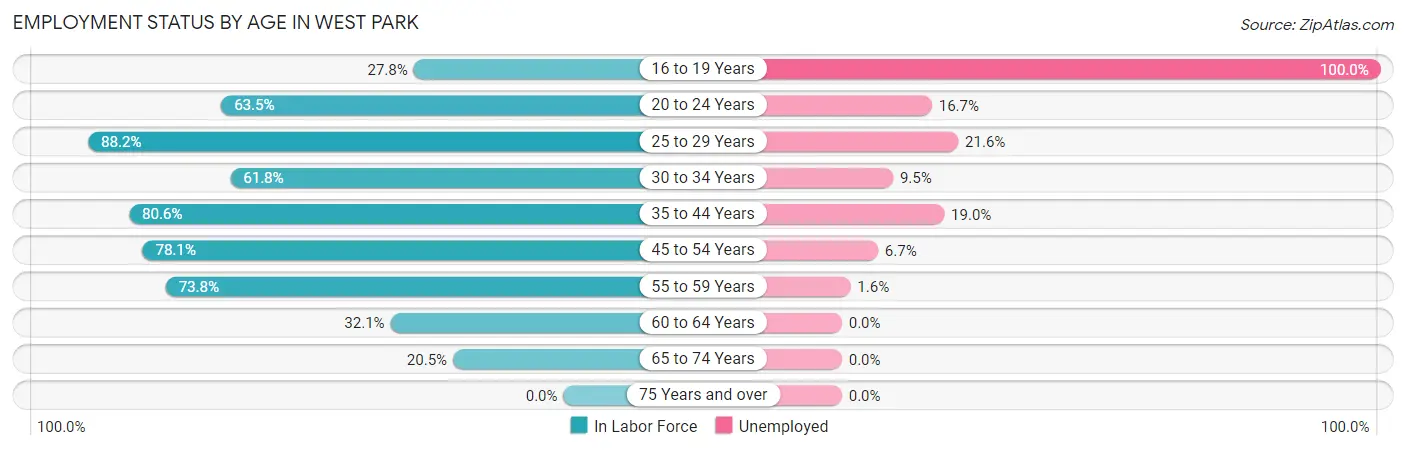
| Age Bracket | In Labor Force | Unemployed |
| 16 to 19 Years | 10 (27.8%) | 10 (100.0%) |
| 20 to 24 Years | 54 (63.5%) | 9 (16.7%) |
| 25 to 29 Years | 97 (88.2%) | 21 (21.6%) |
| 30 to 34 Years | 63 (61.8%) | 6 (9.5%) |
| 35 to 44 Years | 79 (80.6%) | 15 (19.0%) |
| 45 to 54 Years | 89 (78.1%) | 6 (6.7%) |
| 55 to 59 Years | 62 (73.8%) | 1 (1.6%) |
| 60 to 64 Years | 17 (32.1%) | 0 (0.0%) |
| 65 to 74 Years | 16 (20.5%) | 0 (0.0%) |
| 75 Years and over | 0 (0.0%) | 0 (0.0%) |
| Total | 487 (58.3%) | 68 (14.0%) |
Employment Status by Educational Attainment in West Park
According to labor force statistics for West Park, 72.5% of individuals (407) out of the total population between 25 and 64 years of age (561) are in the labor force, with 12.0% or 49 of them being unemployed. The group with the highest labor force participation rate are those with the educational attainment of bachelor's degree or higher, with 100.0% or 65 individuals in the labor force. Within the labor force, individuals with high school diploma education have the highest percentage of unemployment, with 22.2% or 26 of them being unemployed.
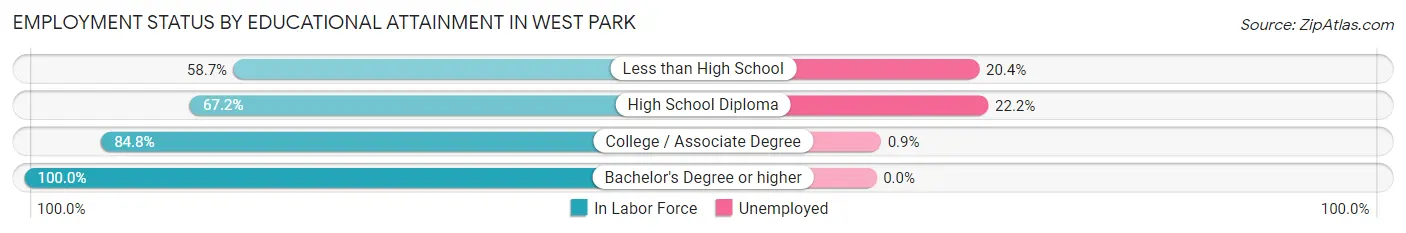
| Educational Attainment | In Labor Force | Unemployed |
| Less than High School | 108 (58.7%) | 38 (20.4%) |
| High School Diploma | 117 (67.2%) | 39 (22.2%) |
| College / Associate Degree | 117 (84.8%) | 1 (0.9%) |
| Bachelor's Degree or higher | 65 (100.0%) | 0 (0.0%) |
| Total | 407 (72.5%) | 67 (12.0%) |
Employment Occupations by Sex in West Park
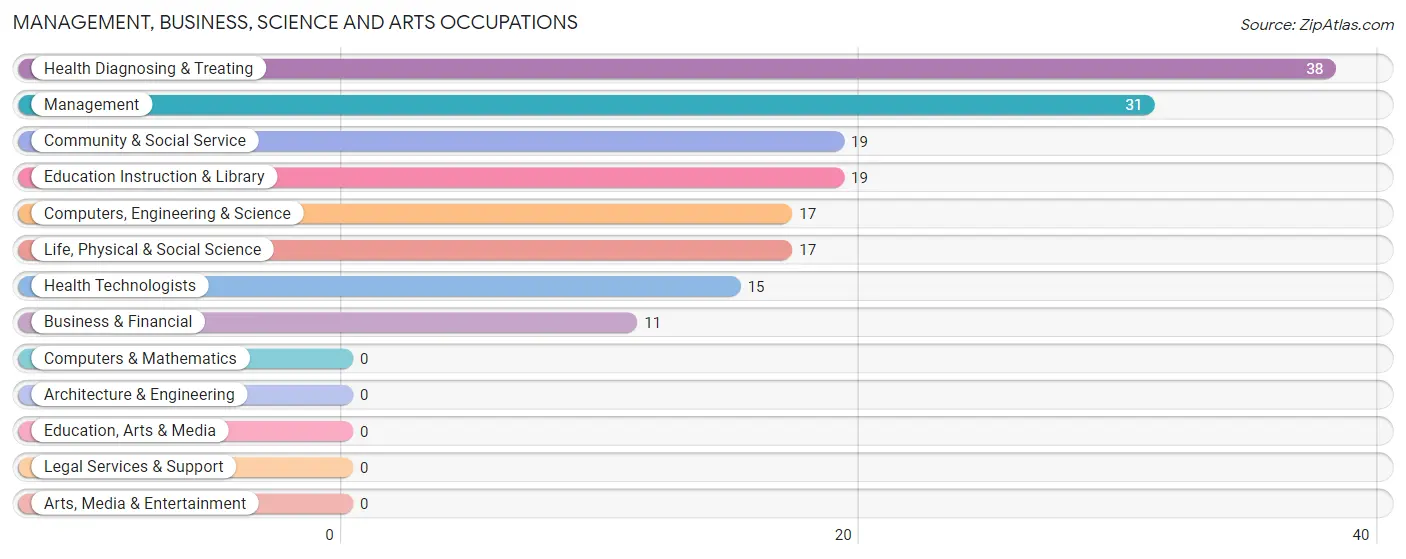
Management, Business, Science and Arts Occupations
The most common Management, Business, Science and Arts occupations in West Park are Health Diagnosing & Treating (38 | 9.1%), Management (31 | 7.4%), Community & Social Service (19 | 4.5%), Education Instruction & Library (19 | 4.5%), and Computers, Engineering & Science (17 | 4.1%).
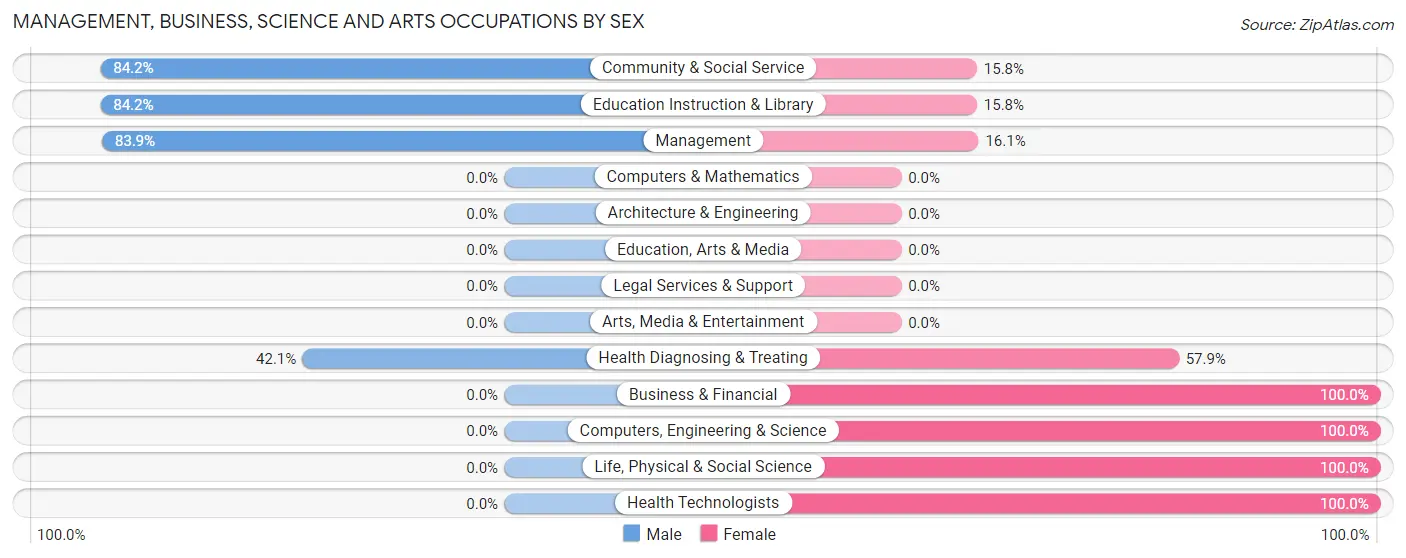
Management, Business, Science and Arts Occupations by Sex
Within the Management, Business, Science and Arts occupations in West Park, the most male-oriented occupations are Community & Social Service (84.2%), Education Instruction & Library (84.2%), and Management (83.9%), while the most female-oriented occupations are Business & Financial (100.0%), Computers, Engineering & Science (100.0%), and Life, Physical & Social Science (100.0%).
| Occupation | Male | Female |
| Management | 26 (83.9%) | 5 (16.1%) |
| Business & Financial | 0 (0.0%) | 11 (100.0%) |
| Computers, Engineering & Science | 0 (0.0%) | 17 (100.0%) |
| Computers & Mathematics | 0 (0.0%) | 0 (0.0%) |
| Architecture & Engineering | 0 (0.0%) | 0 (0.0%) |
| Life, Physical & Social Science | 0 (0.0%) | 17 (100.0%) |
| Community & Social Service | 16 (84.2%) | 3 (15.8%) |
| Education, Arts & Media | 0 (0.0%) | 0 (0.0%) |
| Legal Services & Support | 0 (0.0%) | 0 (0.0%) |
| Education Instruction & Library | 16 (84.2%) | 3 (15.8%) |
| Arts, Media & Entertainment | 0 (0.0%) | 0 (0.0%) |
| Health Diagnosing & Treating | 16 (42.1%) | 22 (57.9%) |
| Health Technologists | 0 (0.0%) | 15 (100.0%) |
| Total (Category) | 58 (50.0%) | 58 (50.0%) |
| Total (Overall) | 246 (58.7%) | 173 (41.3%) |
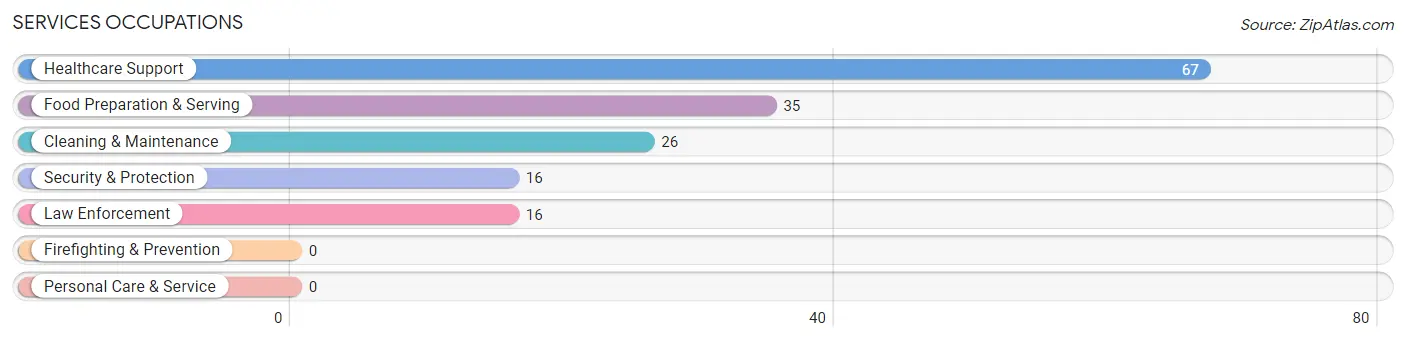
Services Occupations
The most common Services occupations in West Park are Healthcare Support (67 | 16.0%), Food Preparation & Serving (35 | 8.4%), Cleaning & Maintenance (26 | 6.2%), Security & Protection (16 | 3.8%), and Law Enforcement (16 | 3.8%).
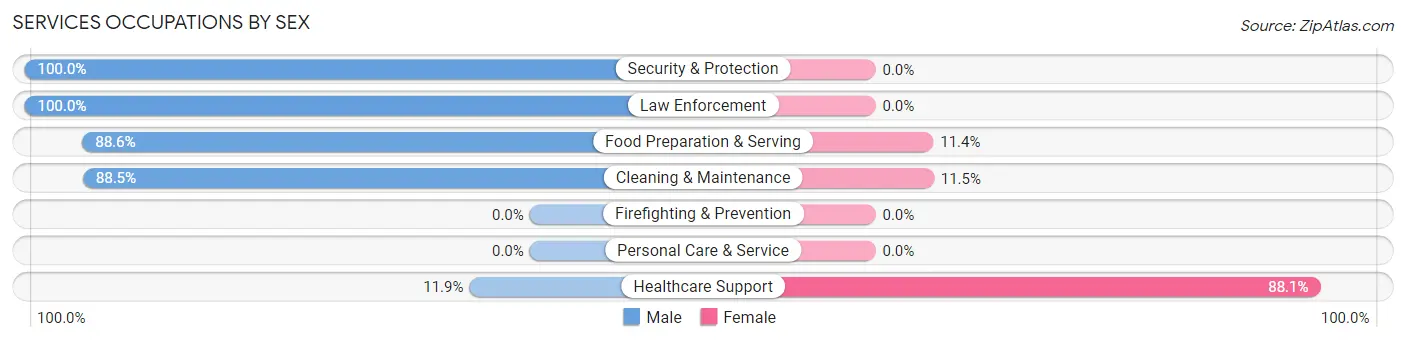
Services Occupations by Sex
Within the Services occupations in West Park, the most male-oriented occupations are Security & Protection (100.0%), Law Enforcement (100.0%), and Food Preparation & Serving (88.6%), while the most female-oriented occupations are Healthcare Support (88.1%), Cleaning & Maintenance (11.5%), and Food Preparation & Serving (11.4%).
| Occupation | Male | Female |
| Healthcare Support | 8 (11.9%) | 59 (88.1%) |
| Security & Protection | 16 (100.0%) | 0 (0.0%) |
| Firefighting & Prevention | 0 (0.0%) | 0 (0.0%) |
| Law Enforcement | 16 (100.0%) | 0 (0.0%) |
| Food Preparation & Serving | 31 (88.6%) | 4 (11.4%) |
| Cleaning & Maintenance | 23 (88.5%) | 3 (11.5%) |
| Personal Care & Service | 0 (0.0%) | 0 (0.0%) |
| Total (Category) | 78 (54.2%) | 66 (45.8%) |
| Total (Overall) | 246 (58.7%) | 173 (41.3%) |
Sales and Office Occupations
The most common Sales and Office occupations in West Park are Sales & Related (30 | 7.2%), and Office & Administration (19 | 4.5%).
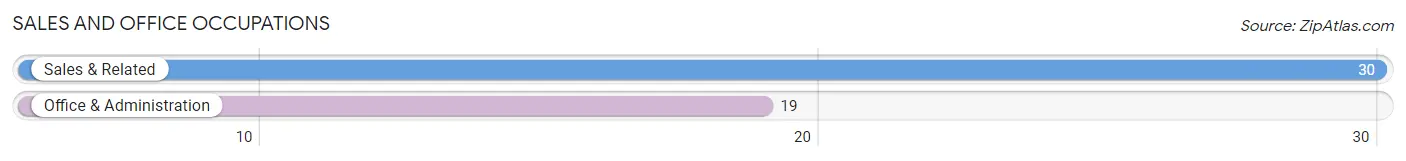
Sales and Office Occupations by Sex
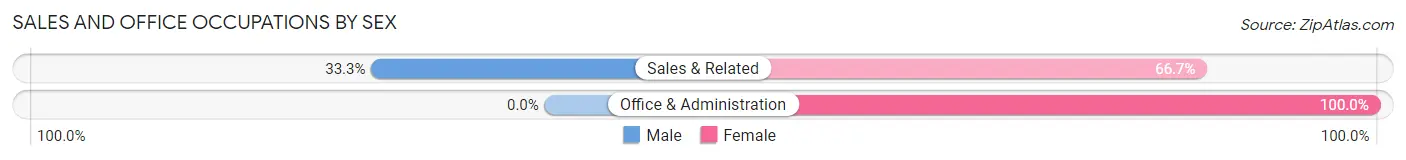
| Occupation | Male | Female |
| Sales & Related | 10 (33.3%) | 20 (66.7%) |
| Office & Administration | 0 (0.0%) | 19 (100.0%) |
| Total (Category) | 10 (20.4%) | 39 (79.6%) |
| Total (Overall) | 246 (58.7%) | 173 (41.3%) |
Natural Resources, Construction and Maintenance Occupations
The most common Natural Resources, Construction and Maintenance occupations in West Park are Farming, Fishing & Forestry (41 | 9.8%), Construction & Extraction (10 | 2.4%), and Installation, Maintenance & Repair (8 | 1.9%).
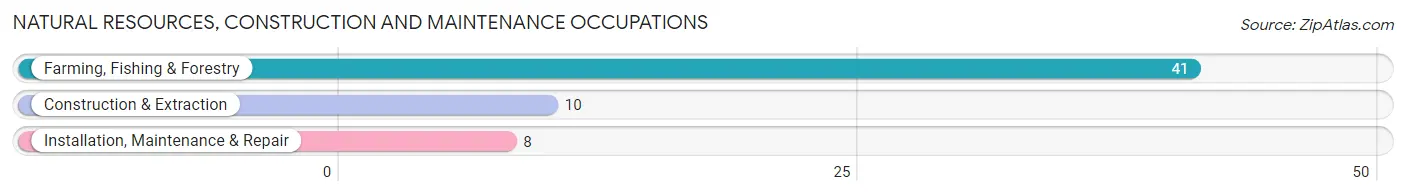
Natural Resources, Construction and Maintenance Occupations by Sex
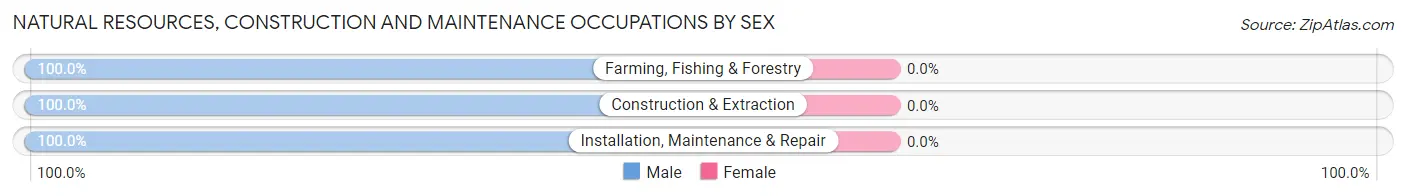
| Occupation | Male | Female |
| Farming, Fishing & Forestry | 41 (100.0%) | 0 (0.0%) |
| Construction & Extraction | 10 (100.0%) | 0 (0.0%) |
| Installation, Maintenance & Repair | 8 (100.0%) | 0 (0.0%) |
| Total (Category) | 59 (100.0%) | 0 (0.0%) |
| Total (Overall) | 246 (58.7%) | 173 (41.3%) |
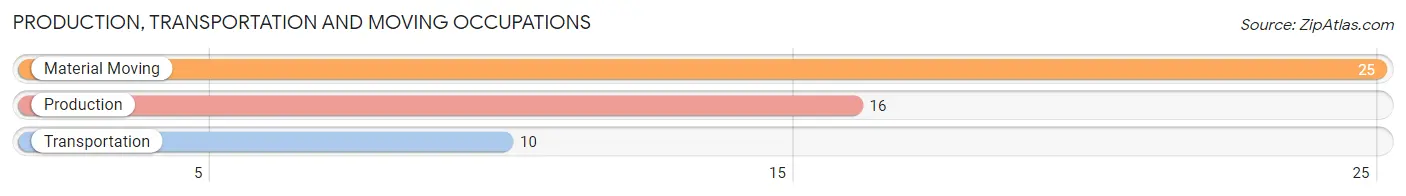
Production, Transportation and Moving Occupations
The most common Production, Transportation and Moving occupations in West Park are Material Moving (25 | 6.0%), Production (16 | 3.8%), and Transportation (10 | 2.4%).
Production, Transportation and Moving Occupations by Sex
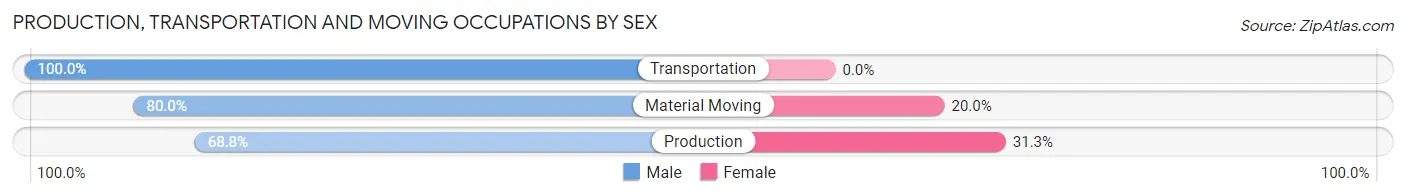
| Occupation | Male | Female |
| Production | 11 (68.8%) | 5 (31.2%) |
| Transportation | 10 (100.0%) | 0 (0.0%) |
| Material Moving | 20 (80.0%) | 5 (20.0%) |
| Total (Category) | 41 (80.4%) | 10 (19.6%) |
| Total (Overall) | 246 (58.7%) | 173 (41.3%) |
Employment Industries by Sex in West Park
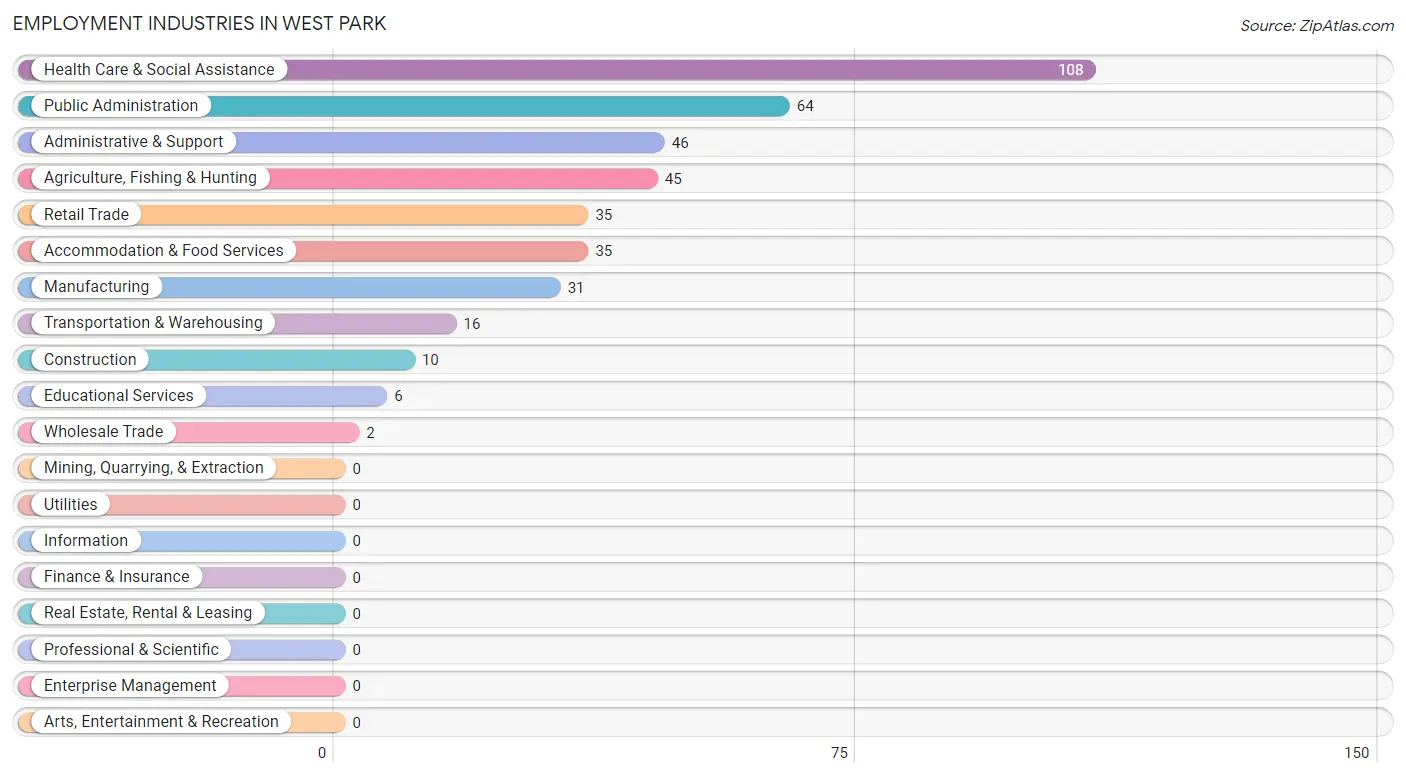
Employment Industries in West Park
The major employment industries in West Park include Health Care & Social Assistance (108 | 25.8%), Public Administration (64 | 15.3%), Administrative & Support (46 | 11.0%), Agriculture, Fishing & Hunting (45 | 10.7%), and Retail Trade (35 | 8.4%).
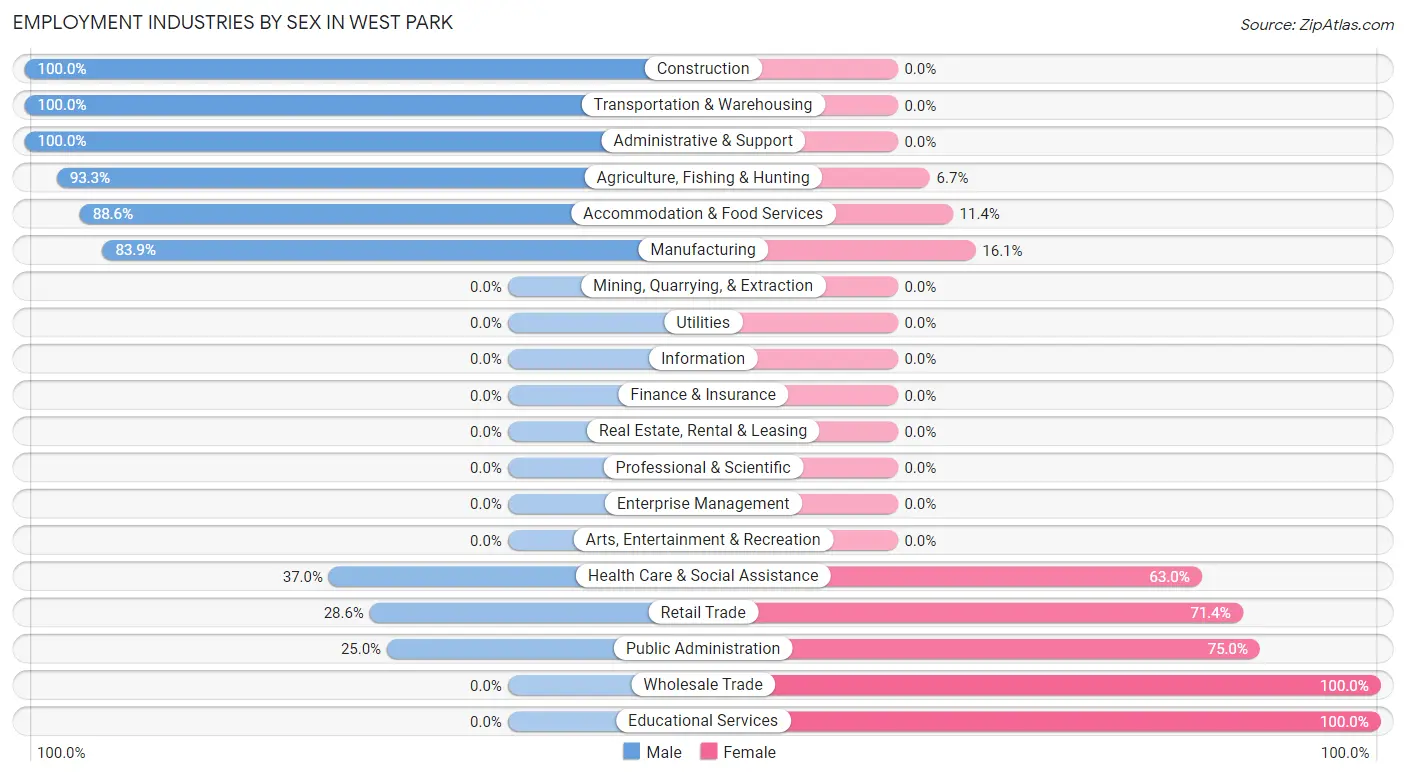
Employment Industries by Sex in West Park
The West Park industries that see more men than women are Construction (100.0%), Transportation & Warehousing (100.0%), and Administrative & Support (100.0%), whereas the industries that tend to have a higher number of women are Wholesale Trade (100.0%), Educational Services (100.0%), and Public Administration (75.0%).
| Industry | Male | Female |
| Agriculture, Fishing & Hunting | 42 (93.3%) | 3 (6.7%) |
| Mining, Quarrying, & Extraction | 0 (0.0%) | 0 (0.0%) |
| Construction | 10 (100.0%) | 0 (0.0%) |
| Manufacturing | 26 (83.9%) | 5 (16.1%) |
| Wholesale Trade | 0 (0.0%) | 2 (100.0%) |
| Retail Trade | 10 (28.6%) | 25 (71.4%) |
| Transportation & Warehousing | 16 (100.0%) | 0 (0.0%) |
| Utilities | 0 (0.0%) | 0 (0.0%) |
| Information | 0 (0.0%) | 0 (0.0%) |
| Finance & Insurance | 0 (0.0%) | 0 (0.0%) |
| Real Estate, Rental & Leasing | 0 (0.0%) | 0 (0.0%) |
| Professional & Scientific | 0 (0.0%) | 0 (0.0%) |
| Enterprise Management | 0 (0.0%) | 0 (0.0%) |
| Administrative & Support | 46 (100.0%) | 0 (0.0%) |
| Educational Services | 0 (0.0%) | 6 (100.0%) |
| Health Care & Social Assistance | 40 (37.0%) | 68 (63.0%) |
| Arts, Entertainment & Recreation | 0 (0.0%) | 0 (0.0%) |
| Accommodation & Food Services | 31 (88.6%) | 4 (11.4%) |
| Public Administration | 16 (25.0%) | 48 (75.0%) |
| Total | 246 (58.7%) | 173 (41.3%) |
Education in West Park
School Enrollment in West Park
The most common levels of schooling among the 202 students in West Park are elementary school (70 | 34.6%), high school (36 | 17.8%), and kindergarten (33 | 16.3%).

| School Level | # Students | % Students |
| Nursery / Preschool | 3 | 1.5% |
| Kindergarten | 33 | 16.3% |
| Elementary School | 70 | 34.6% |
| Middle School | 33 | 16.3% |
| High School | 36 | 17.8% |
| College / Undergraduate | 22 | 10.9% |
| Graduate / Professional | 5 | 2.5% |
| Total | 202 | 100.0% |
School Enrollment by Age by Funding Source in West Park
Out of a total of 202 students who are enrolled in schools in West Park, 5 (2.5%) attend a private institution, while the remaining 197 (97.5%) are enrolled in public schools. The age group of 25 to 34 year olds has the highest likelihood of being enrolled in private schools, with 5 (100.0% in the age bracket) enrolled. Conversely, the age group of 3 to 4 year olds has the lowest likelihood of being enrolled in a private school, with 3 (100.0% in the age bracket) attending a public institution.
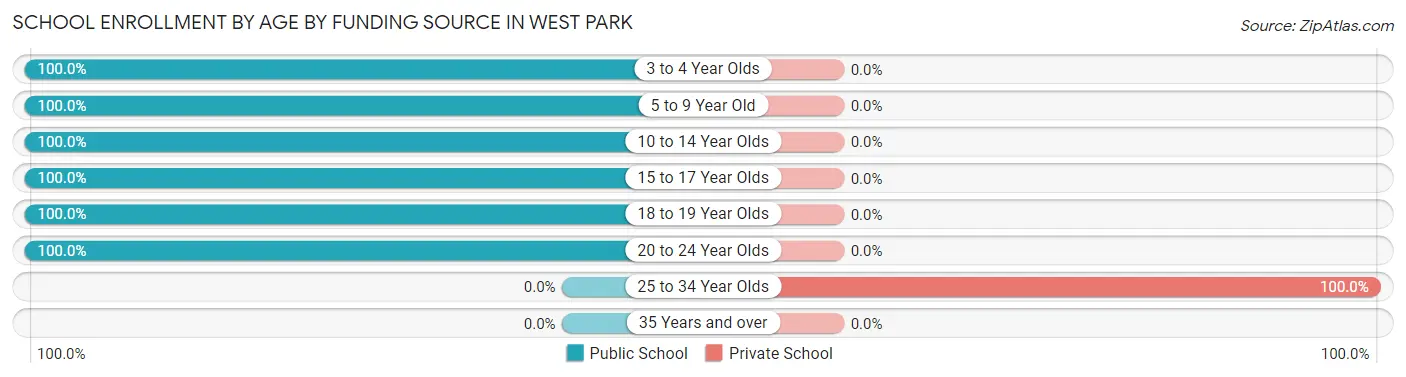
| Age Bracket | Public School | Private School |
| 3 to 4 Year Olds | 3 (100.0%) | 0 (0.0%) |
| 5 to 9 Year Old | 81 (100.0%) | 0 (0.0%) |
| 10 to 14 Year Olds | 55 (100.0%) | 0 (0.0%) |
| 15 to 17 Year Olds | 27 (100.0%) | 0 (0.0%) |
| 18 to 19 Year Olds | 9 (100.0%) | 0 (0.0%) |
| 20 to 24 Year Olds | 22 (100.0%) | 0 (0.0%) |
| 25 to 34 Year Olds | 0 (0.0%) | 5 (100.0%) |
| 35 Years and over | 0 (0.0%) | 0 (0.0%) |
| Total | 197 (97.5%) | 5 (2.5%) |
Educational Attainment by Field of Study in West Park
Arts & humanities (21 | 25.3%), engineering (17 | 20.5%), psychology (15 | 18.1%), science & technology (15 | 18.1%), and education (9 | 10.8%) are the most common fields of study among 83 individuals in West Park who have obtained a bachelor's degree or higher.
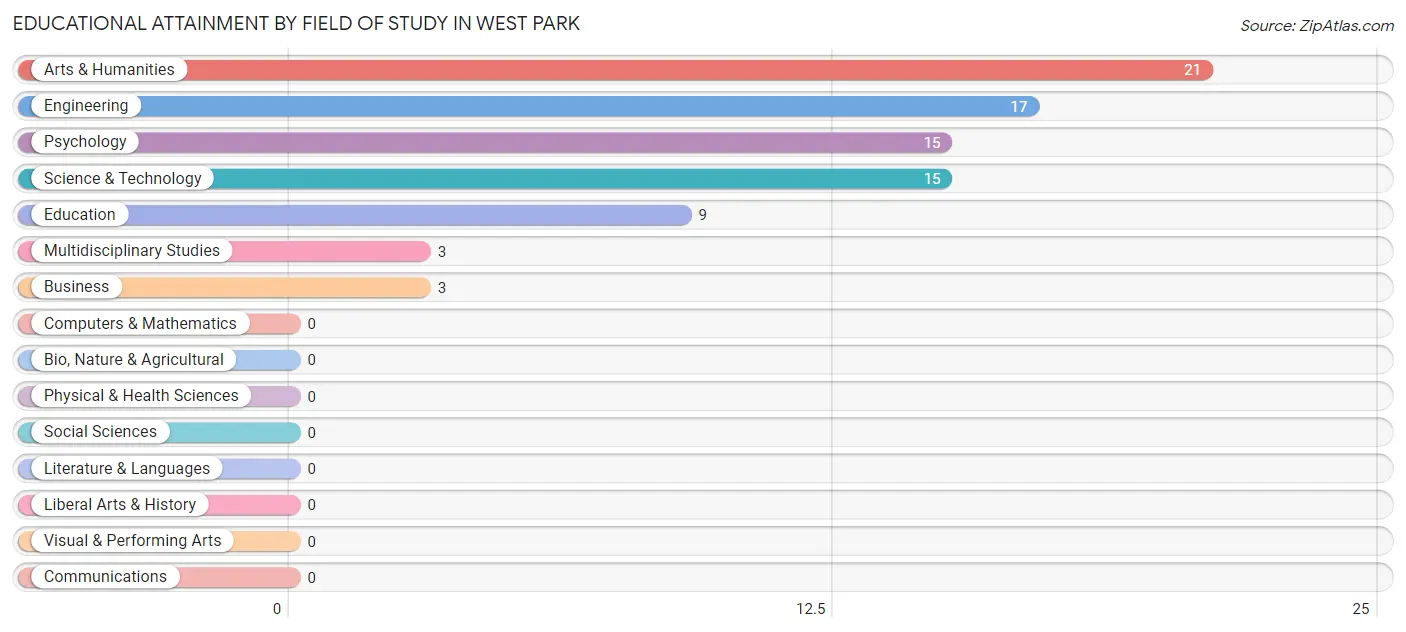
| Field of Study | # Graduates | % Graduates |
| Computers & Mathematics | 0 | 0.0% |
| Bio, Nature & Agricultural | 0 | 0.0% |
| Physical & Health Sciences | 0 | 0.0% |
| Psychology | 15 | 18.1% |
| Social Sciences | 0 | 0.0% |
| Engineering | 17 | 20.5% |
| Multidisciplinary Studies | 3 | 3.6% |
| Science & Technology | 15 | 18.1% |
| Business | 3 | 3.6% |
| Education | 9 | 10.8% |
| Literature & Languages | 0 | 0.0% |
| Liberal Arts & History | 0 | 0.0% |
| Visual & Performing Arts | 0 | 0.0% |
| Communications | 0 | 0.0% |
| Arts & Humanities | 21 | 25.3% |
| Total | 83 | 100.0% |
Transportation & Commute in West Park
Vehicle Availability by Sex in West Park
The most prevalent vehicle ownership categories in West Park are males with 3 vehicles (83, accounting for 33.7%) and females with 3 vehicles (36, making up 48.0%).

| Vehicles Available | Male | Female |
| No Vehicle | 2 (0.8%) | 0 (0.0%) |
| 1 Vehicle | 16 (6.5%) | 24 (13.9%) |
| 2 Vehicles | 51 (20.7%) | 35 (20.2%) |
| 3 Vehicles | 83 (33.7%) | 36 (20.8%) |
| 4 Vehicles | 32 (13.0%) | 48 (27.8%) |
| 5 or more Vehicles | 62 (25.2%) | 30 (17.3%) |
| Total | 246 (100.0%) | 173 (100.0%) |
Commute Time in West Park
The most frequently occuring commute durations in West Park are 20 to 24 minutes (108 commuters, 27.9%), 15 to 19 minutes (78 commuters, 20.2%), and 10 to 14 minutes (71 commuters, 18.3%).
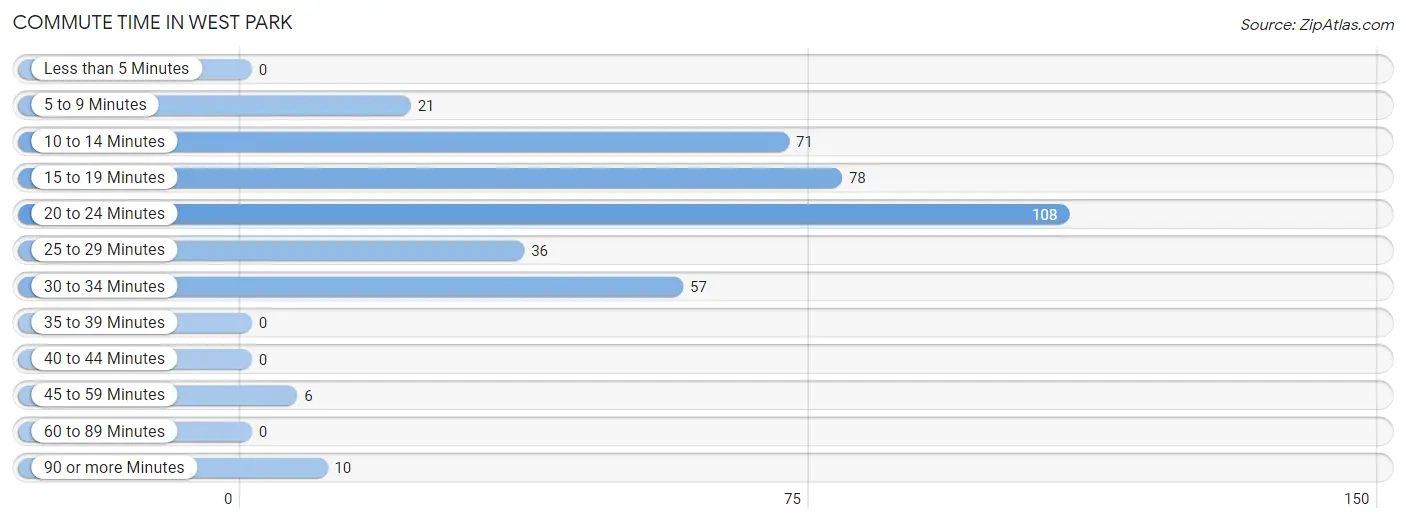
| Commute Time | # Commuters | % Commuters |
| Less than 5 Minutes | 0 | 0.0% |
| 5 to 9 Minutes | 21 | 5.4% |
| 10 to 14 Minutes | 71 | 18.3% |
| 15 to 19 Minutes | 78 | 20.2% |
| 20 to 24 Minutes | 108 | 27.9% |
| 25 to 29 Minutes | 36 | 9.3% |
| 30 to 34 Minutes | 57 | 14.7% |
| 35 to 39 Minutes | 0 | 0.0% |
| 40 to 44 Minutes | 0 | 0.0% |
| 45 to 59 Minutes | 6 | 1.5% |
| 60 to 89 Minutes | 0 | 0.0% |
| 90 or more Minutes | 10 | 2.6% |
Commute Time by Sex in West Park
The most common commute times in West Park are 20 to 24 minutes (75 commuters, 33.8%) for males and 30 to 34 minutes (42 commuters, 25.5%) for females.
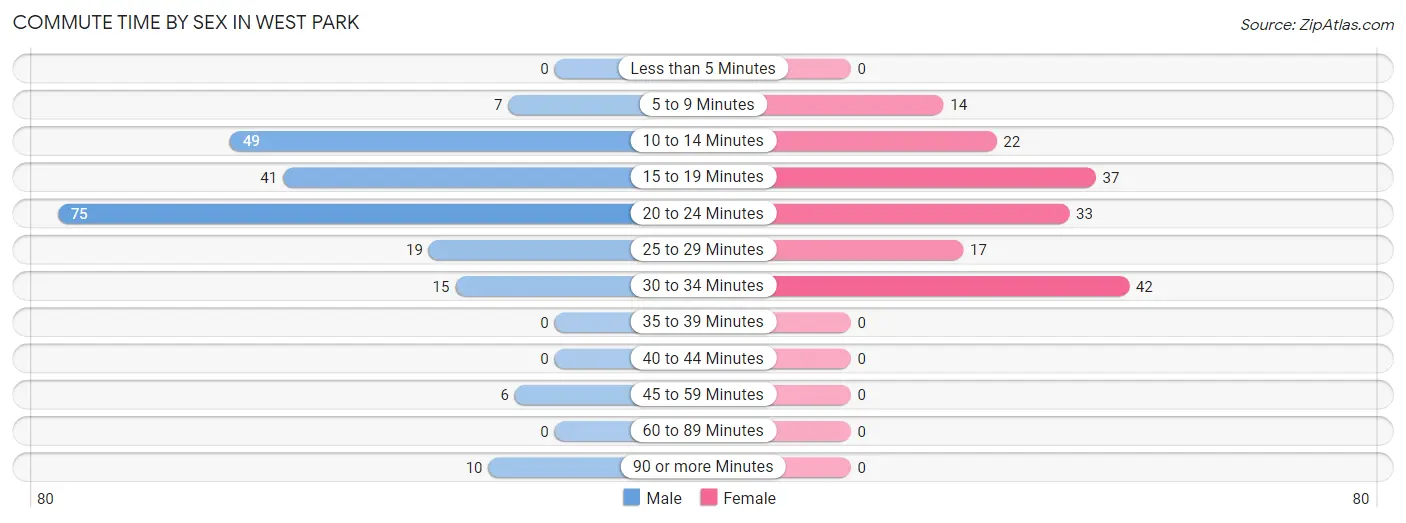
| Commute Time | Male | Female |
| Less than 5 Minutes | 0 (0.0%) | 0 (0.0%) |
| 5 to 9 Minutes | 7 (3.2%) | 14 (8.5%) |
| 10 to 14 Minutes | 49 (22.1%) | 22 (13.3%) |
| 15 to 19 Minutes | 41 (18.5%) | 37 (22.4%) |
| 20 to 24 Minutes | 75 (33.8%) | 33 (20.0%) |
| 25 to 29 Minutes | 19 (8.6%) | 17 (10.3%) |
| 30 to 34 Minutes | 15 (6.8%) | 42 (25.5%) |
| 35 to 39 Minutes | 0 (0.0%) | 0 (0.0%) |
| 40 to 44 Minutes | 0 (0.0%) | 0 (0.0%) |
| 45 to 59 Minutes | 6 (2.7%) | 0 (0.0%) |
| 60 to 89 Minutes | 0 (0.0%) | 0 (0.0%) |
| 90 or more Minutes | 10 (4.5%) | 0 (0.0%) |
Time of Departure to Work by Sex in West Park
The most frequent times of departure to work in West Park are 7:00 AM to 7:29 AM (78, 35.1%) for males and 7:30 AM to 7:59 AM (57, 34.5%) for females.
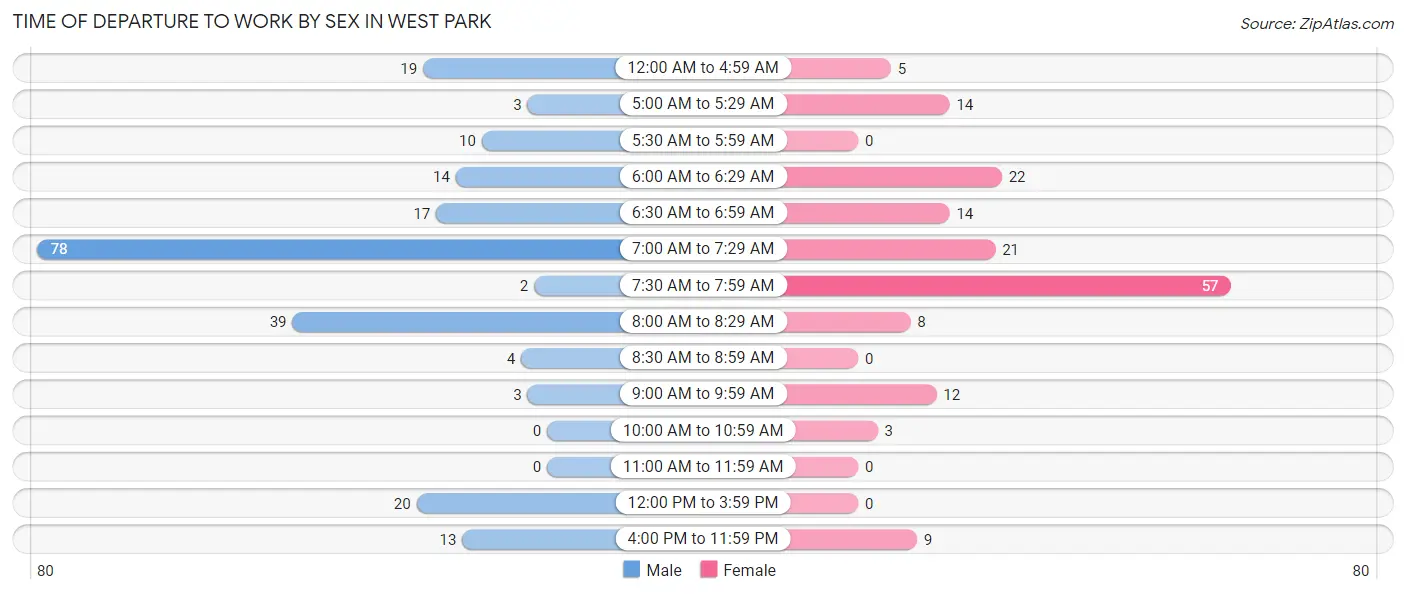
| Time of Departure | Male | Female |
| 12:00 AM to 4:59 AM | 19 (8.6%) | 5 (3.0%) |
| 5:00 AM to 5:29 AM | 3 (1.3%) | 14 (8.5%) |
| 5:30 AM to 5:59 AM | 10 (4.5%) | 0 (0.0%) |
| 6:00 AM to 6:29 AM | 14 (6.3%) | 22 (13.3%) |
| 6:30 AM to 6:59 AM | 17 (7.7%) | 14 (8.5%) |
| 7:00 AM to 7:29 AM | 78 (35.1%) | 21 (12.7%) |
| 7:30 AM to 7:59 AM | 2 (0.9%) | 57 (34.5%) |
| 8:00 AM to 8:29 AM | 39 (17.6%) | 8 (4.9%) |
| 8:30 AM to 8:59 AM | 4 (1.8%) | 0 (0.0%) |
| 9:00 AM to 9:59 AM | 3 (1.3%) | 12 (7.3%) |
| 10:00 AM to 10:59 AM | 0 (0.0%) | 3 (1.8%) |
| 11:00 AM to 11:59 AM | 0 (0.0%) | 0 (0.0%) |
| 12:00 PM to 3:59 PM | 20 (9.0%) | 0 (0.0%) |
| 4:00 PM to 11:59 PM | 13 (5.9%) | 9 (5.4%) |
| Total | 222 (100.0%) | 165 (100.0%) |
Housing Occupancy in West Park
Occupancy by Ownership in West Park
Of the total 256 dwellings in West Park, owner-occupied units account for 119 (46.5%), while renter-occupied units make up 137 (53.5%).
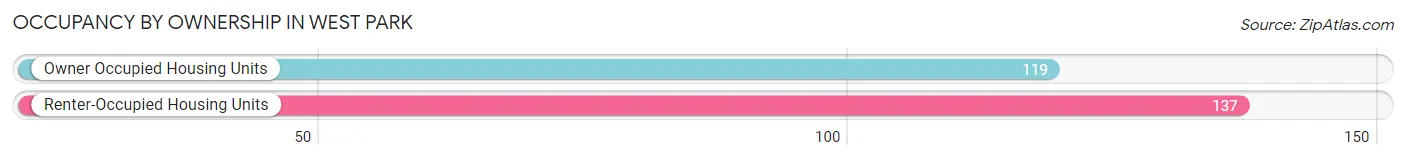
| Occupancy | # Housing Units | % Housing Units |
| Owner Occupied Housing Units | 119 | 46.5% |
| Renter-Occupied Housing Units | 137 | 53.5% |
| Total Occupied Housing Units | 256 | 100.0% |
Occupancy by Household Size in West Park
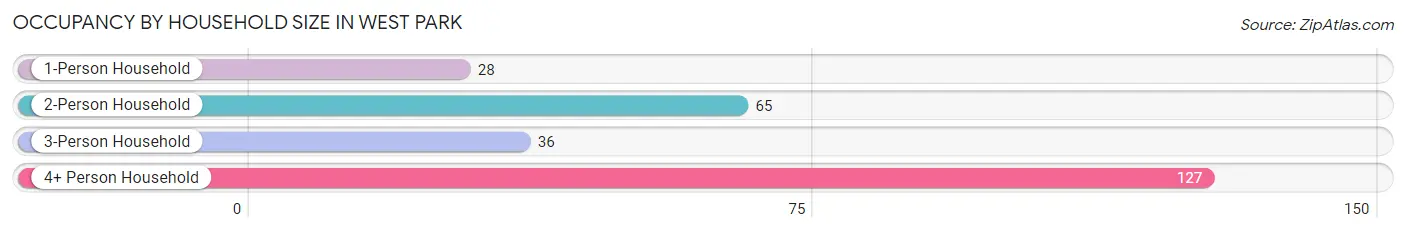
| Household Size | # Housing Units | % Housing Units |
| 1-Person Household | 28 | 10.9% |
| 2-Person Household | 65 | 25.4% |
| 3-Person Household | 36 | 14.1% |
| 4+ Person Household | 127 | 49.6% |
| Total Housing Units | 256 | 100.0% |
Occupancy by Ownership by Household Size in West Park
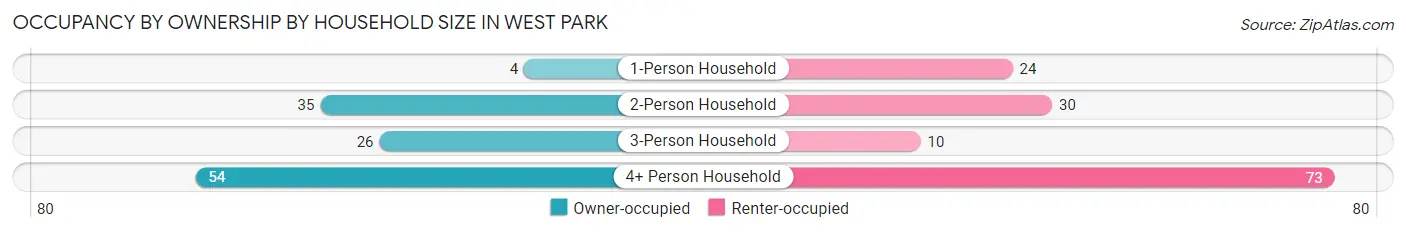
| Household Size | Owner-occupied | Renter-occupied |
| 1-Person Household | 4 (14.3%) | 24 (85.7%) |
| 2-Person Household | 35 (53.8%) | 30 (46.2%) |
| 3-Person Household | 26 (72.2%) | 10 (27.8%) |
| 4+ Person Household | 54 (42.5%) | 73 (57.5%) |
| Total Housing Units | 119 (46.5%) | 137 (53.5%) |
Occupancy by Educational Attainment in West Park
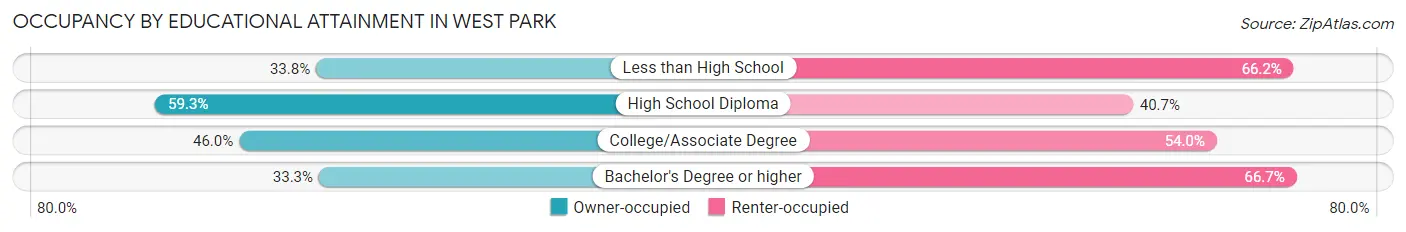
| Household Size | Owner-occupied | Renter-occupied |
| Less than High School | 25 (33.8%) | 49 (66.2%) |
| High School Diploma | 51 (59.3%) | 35 (40.7%) |
| College/Associate Degree | 40 (46.0%) | 47 (54.0%) |
| Bachelor's Degree or higher | 3 (33.3%) | 6 (66.7%) |
Occupancy by Age of Householder in West Park
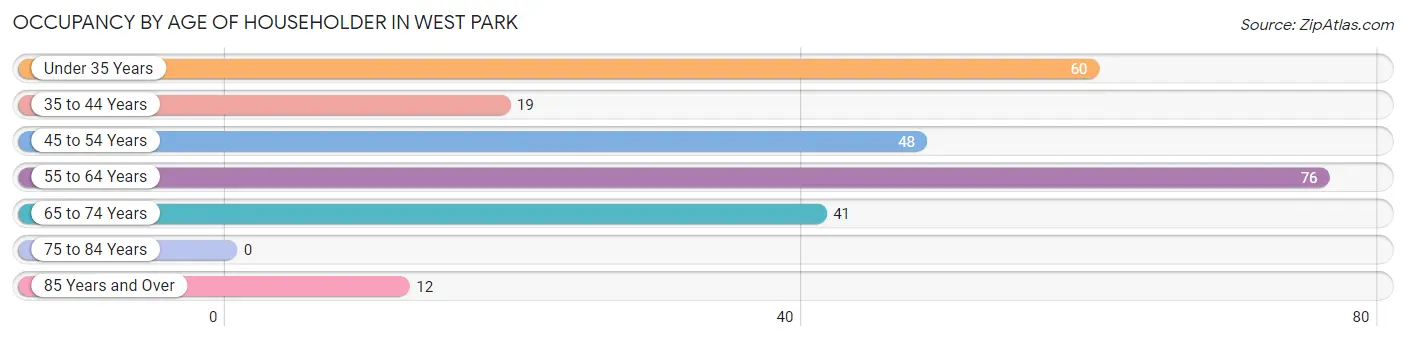
| Age Bracket | # Households | % Households |
| Under 35 Years | 60 | 23.4% |
| 35 to 44 Years | 19 | 7.4% |
| 45 to 54 Years | 48 | 18.8% |
| 55 to 64 Years | 76 | 29.7% |
| 65 to 74 Years | 41 | 16.0% |
| 75 to 84 Years | 0 | 0.0% |
| 85 Years and Over | 12 | 4.7% |
| Total | 256 | 100.0% |
Housing Finances in West Park
Median Income by Occupancy in West Park
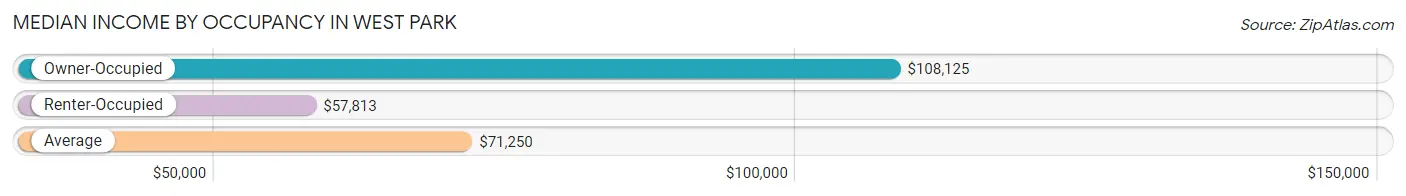
| Occupancy Type | # Households | Median Income |
| Owner-Occupied | 119 (46.5%) | $108,125 |
| Renter-Occupied | 137 (53.5%) | $57,813 |
| Average | 256 (100.0%) | $71,250 |
Occupancy by Householder Income Bracket in West Park
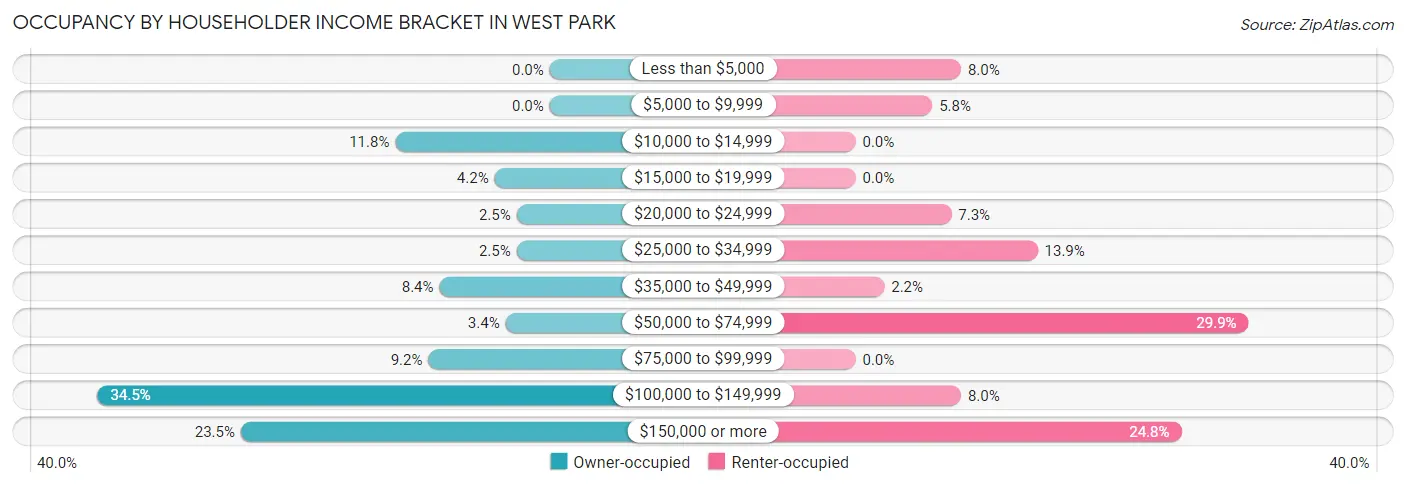
| Income Bracket | Owner-occupied | Renter-occupied |
| Less than $5,000 | 0 (0.0%) | 11 (8.0%) |
| $5,000 to $9,999 | 0 (0.0%) | 8 (5.8%) |
| $10,000 to $14,999 | 14 (11.8%) | 0 (0.0%) |
| $15,000 to $19,999 | 5 (4.2%) | 0 (0.0%) |
| $20,000 to $24,999 | 3 (2.5%) | 10 (7.3%) |
| $25,000 to $34,999 | 3 (2.5%) | 19 (13.9%) |
| $35,000 to $49,999 | 10 (8.4%) | 3 (2.2%) |
| $50,000 to $74,999 | 4 (3.4%) | 41 (29.9%) |
| $75,000 to $99,999 | 11 (9.2%) | 0 (0.0%) |
| $100,000 to $149,999 | 41 (34.4%) | 11 (8.0%) |
| $150,000 or more | 28 (23.5%) | 34 (24.8%) |
| Total | 119 (100.0%) | 137 (100.0%) |
Monthly Housing Cost Tiers in West Park
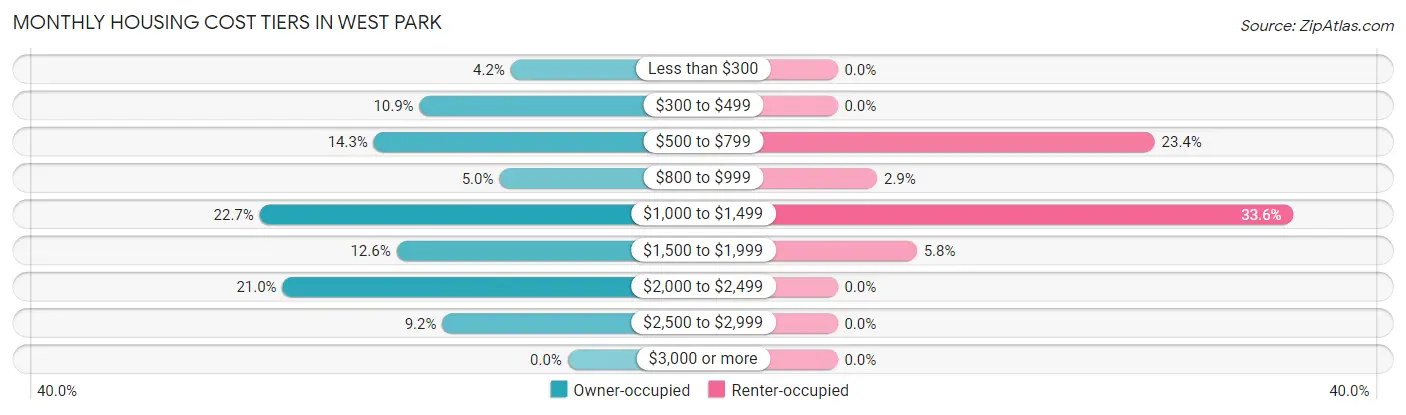
| Monthly Cost | Owner-occupied | Renter-occupied |
| Less than $300 | 5 (4.2%) | 0 (0.0%) |
| $300 to $499 | 13 (10.9%) | 0 (0.0%) |
| $500 to $799 | 17 (14.3%) | 32 (23.4%) |
| $800 to $999 | 6 (5.0%) | 4 (2.9%) |
| $1,000 to $1,499 | 27 (22.7%) | 46 (33.6%) |
| $1,500 to $1,999 | 15 (12.6%) | 8 (5.8%) |
| $2,000 to $2,499 | 25 (21.0%) | 0 (0.0%) |
| $2,500 to $2,999 | 11 (9.2%) | 0 (0.0%) |
| $3,000 or more | 0 (0.0%) | 0 (0.0%) |
| Total | 119 (100.0%) | 137 (100.0%) |
Physical Housing Characteristics in West Park
Housing Structures in West Park
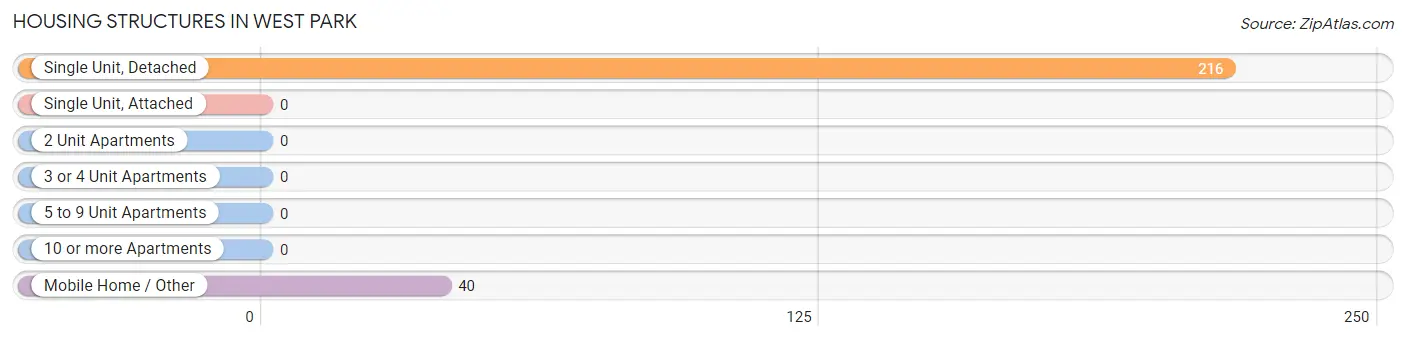
| Structure Type | # Housing Units | % Housing Units |
| Single Unit, Detached | 216 | 84.4% |
| Single Unit, Attached | 0 | 0.0% |
| 2 Unit Apartments | 0 | 0.0% |
| 3 or 4 Unit Apartments | 0 | 0.0% |
| 5 to 9 Unit Apartments | 0 | 0.0% |
| 10 or more Apartments | 0 | 0.0% |
| Mobile Home / Other | 40 | 15.6% |
| Total | 256 | 100.0% |
Housing Structures by Occupancy in West Park
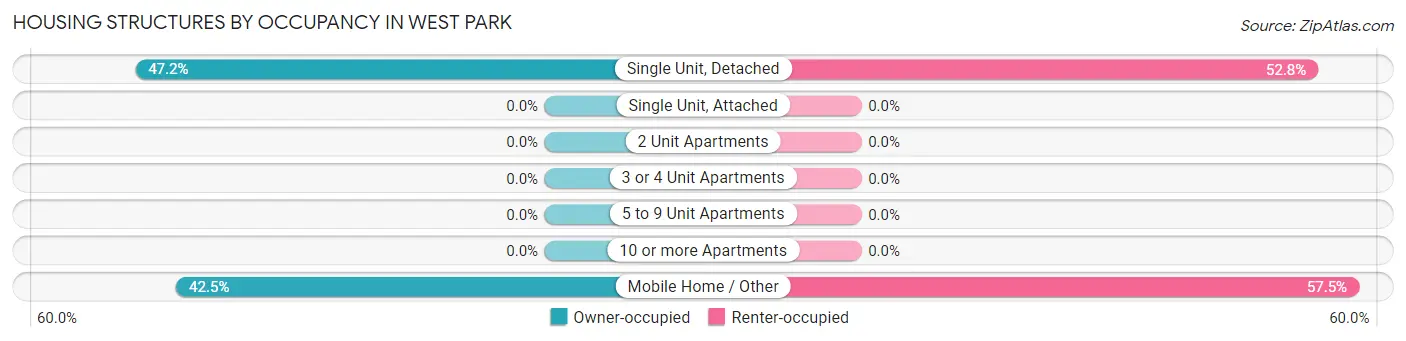
| Structure Type | Owner-occupied | Renter-occupied |
| Single Unit, Detached | 102 (47.2%) | 114 (52.8%) |
| Single Unit, Attached | 0 (0.0%) | 0 (0.0%) |
| 2 Unit Apartments | 0 (0.0%) | 0 (0.0%) |
| 3 or 4 Unit Apartments | 0 (0.0%) | 0 (0.0%) |
| 5 to 9 Unit Apartments | 0 (0.0%) | 0 (0.0%) |
| 10 or more Apartments | 0 (0.0%) | 0 (0.0%) |
| Mobile Home / Other | 17 (42.5%) | 23 (57.5%) |
| Total | 119 (46.5%) | 137 (53.5%) |
Housing Structures by Number of Rooms in West Park
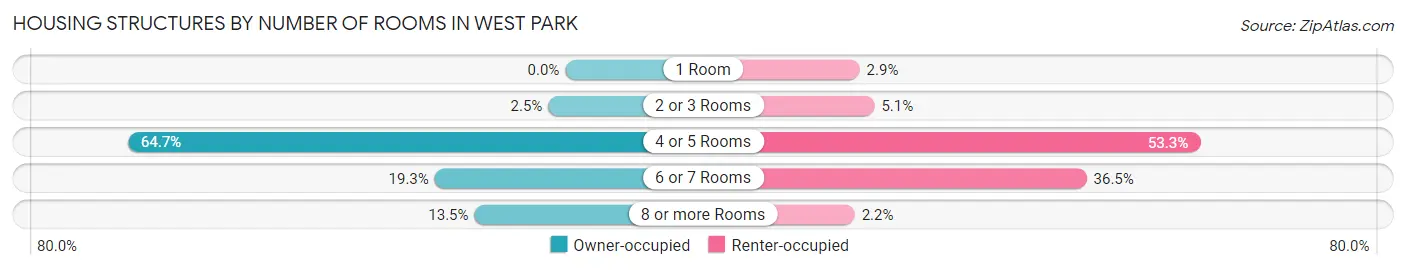
| Number of Rooms | Owner-occupied | Renter-occupied |
| 1 Room | 0 (0.0%) | 4 (2.9%) |
| 2 or 3 Rooms | 3 (2.5%) | 7 (5.1%) |
| 4 or 5 Rooms | 77 (64.7%) | 73 (53.3%) |
| 6 or 7 Rooms | 23 (19.3%) | 50 (36.5%) |
| 8 or more Rooms | 16 (13.5%) | 3 (2.2%) |
| Total | 119 (100.0%) | 137 (100.0%) |
Housing Structure by Heating Type in West Park
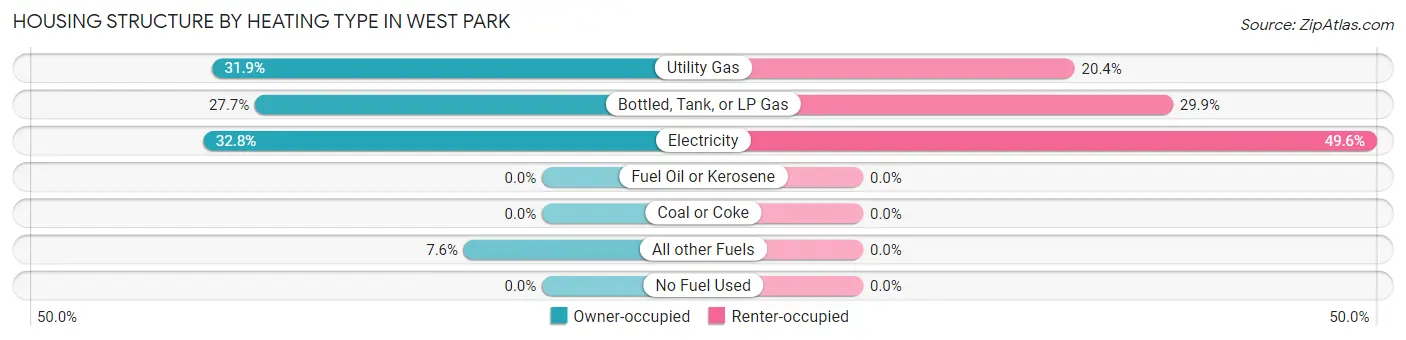
| Heating Type | Owner-occupied | Renter-occupied |
| Utility Gas | 38 (31.9%) | 28 (20.4%) |
| Bottled, Tank, or LP Gas | 33 (27.7%) | 41 (29.9%) |
| Electricity | 39 (32.8%) | 68 (49.6%) |
| Fuel Oil or Kerosene | 0 (0.0%) | 0 (0.0%) |
| Coal or Coke | 0 (0.0%) | 0 (0.0%) |
| All other Fuels | 9 (7.6%) | 0 (0.0%) |
| No Fuel Used | 0 (0.0%) | 0 (0.0%) |
| Total | 119 (100.0%) | 137 (100.0%) |
Household Vehicle Usage in West Park
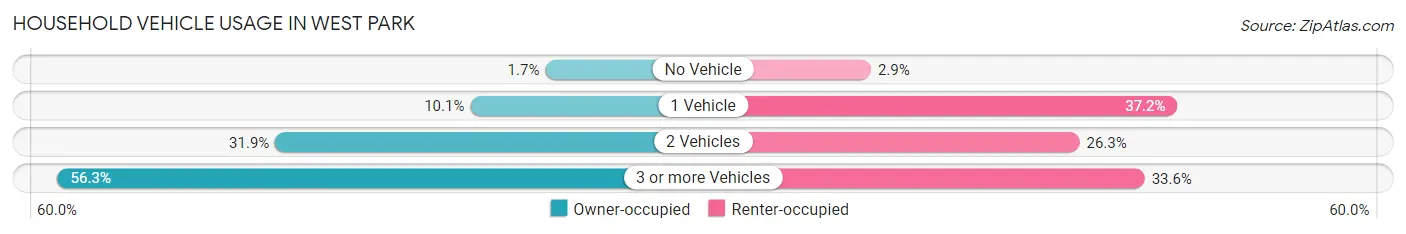
| Vehicles per Household | Owner-occupied | Renter-occupied |
| No Vehicle | 2 (1.7%) | 4 (2.9%) |
| 1 Vehicle | 12 (10.1%) | 51 (37.2%) |
| 2 Vehicles | 38 (31.9%) | 36 (26.3%) |
| 3 or more Vehicles | 67 (56.3%) | 46 (33.6%) |
| Total | 119 (100.0%) | 137 (100.0%) |
Real Estate & Mortgages in West Park
Real Estate and Mortgage Overview in West Park
| Characteristic | Without Mortgage | With Mortgage |
| Housing Units | 29 | 90 |
| Median Property Value | $139,200 | $214,300 |
| Median Household Income | - | - |
| Monthly Housing Costs | $348 | $0 |
| Real Estate Taxes | $967 | $0 |
Property Value by Mortgage Status in West Park
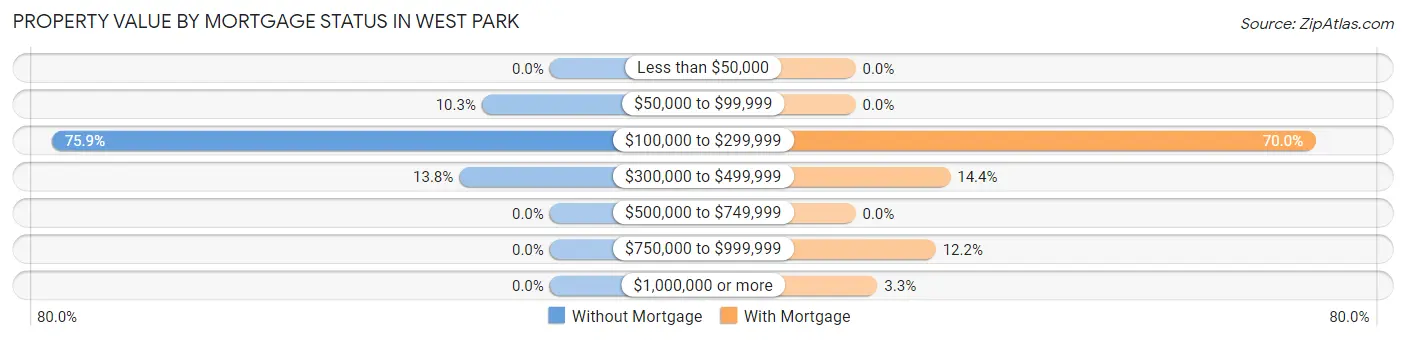
| Property Value | Without Mortgage | With Mortgage |
| Less than $50,000 | 0 (0.0%) | 0 (0.0%) |
| $50,000 to $99,999 | 3 (10.3%) | 0 (0.0%) |
| $100,000 to $299,999 | 22 (75.9%) | 63 (70.0%) |
| $300,000 to $499,999 | 4 (13.8%) | 13 (14.4%) |
| $500,000 to $749,999 | 0 (0.0%) | 0 (0.0%) |
| $750,000 to $999,999 | 0 (0.0%) | 11 (12.2%) |
| $1,000,000 or more | 0 (0.0%) | 3 (3.3%) |
| Total | 29 (100.0%) | 90 (100.0%) |
Household Income by Mortgage Status in West Park
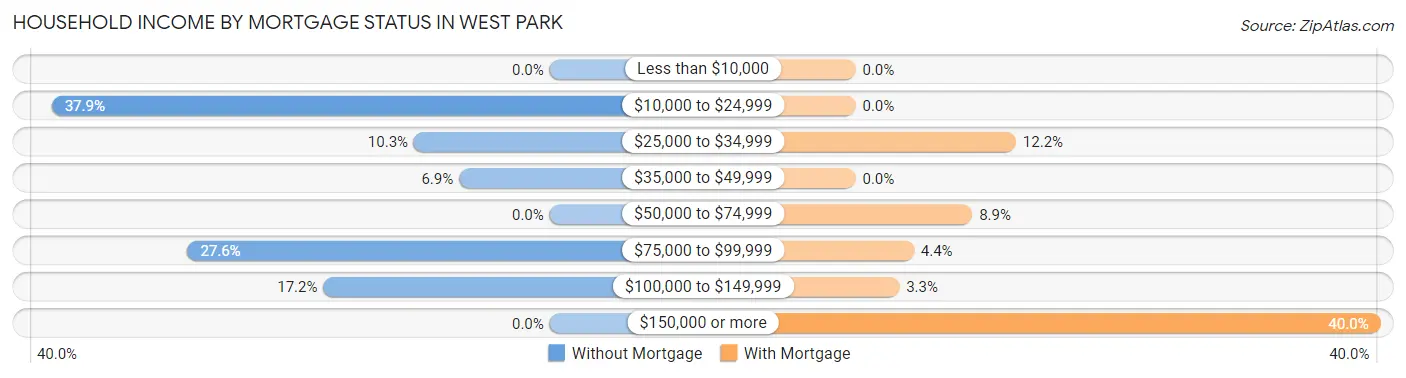
| Household Income | Without Mortgage | With Mortgage |
| Less than $10,000 | 0 (0.0%) | 0 (0.0%) |
| $10,000 to $24,999 | 11 (37.9%) | 0 (0.0%) |
| $25,000 to $34,999 | 3 (10.3%) | 11 (12.2%) |
| $35,000 to $49,999 | 2 (6.9%) | 0 (0.0%) |
| $50,000 to $74,999 | 0 (0.0%) | 8 (8.9%) |
| $75,000 to $99,999 | 8 (27.6%) | 4 (4.4%) |
| $100,000 to $149,999 | 5 (17.2%) | 3 (3.3%) |
| $150,000 or more | 0 (0.0%) | 36 (40.0%) |
| Total | 29 (100.0%) | 90 (100.0%) |
Property Value to Household Income Ratio in West Park
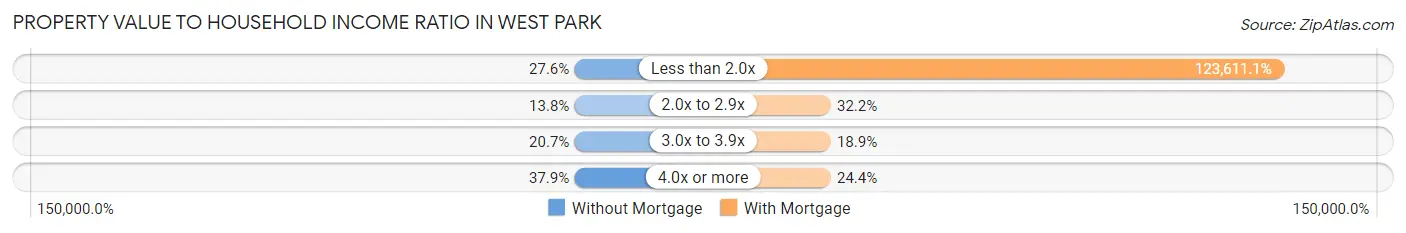
| Value-to-Income Ratio | Without Mortgage | With Mortgage |
| Less than 2.0x | 8 (27.6%) | 111,250 (123,611.1%) |
| 2.0x to 2.9x | 4 (13.8%) | 29 (32.2%) |
| 3.0x to 3.9x | 6 (20.7%) | 17 (18.9%) |
| 4.0x or more | 11 (37.9%) | 22 (24.4%) |
| Total | 29 (100.0%) | 90 (100.0%) |
Real Estate Taxes by Mortgage Status in West Park
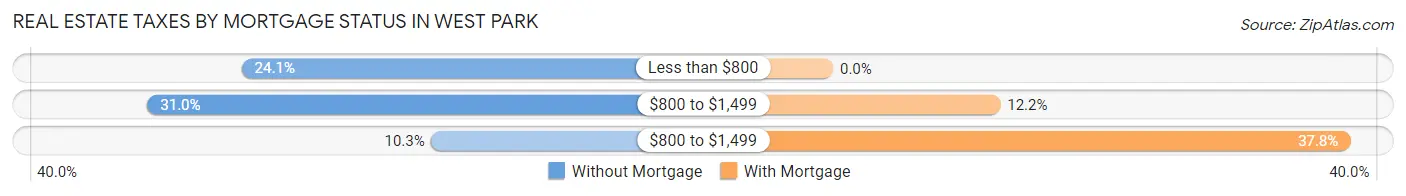
| Property Taxes | Without Mortgage | With Mortgage |
| Less than $800 | 7 (24.1%) | 0 (0.0%) |
| $800 to $1,499 | 9 (31.0%) | 11 (12.2%) |
| $800 to $1,499 | 3 (10.3%) | 34 (37.8%) |
| Total | 29 (100.0%) | 90 (100.0%) |
Health & Disability in West Park
Health Insurance Coverage by Age in West Park
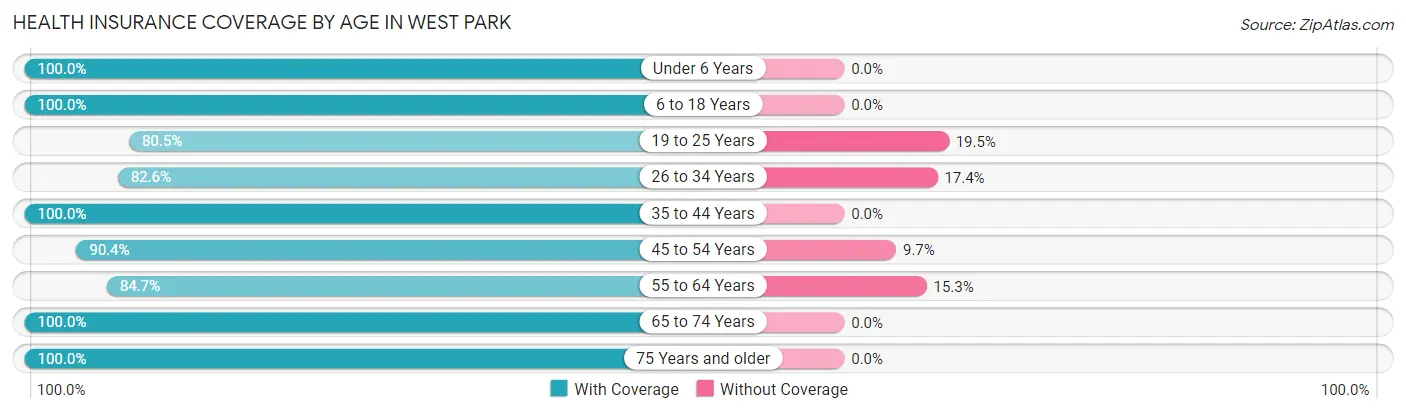
| Age Bracket | With Coverage | Without Coverage |
| Under 6 Years | 182 (100.0%) | 0 (0.0%) |
| 6 to 18 Years | 161 (100.0%) | 0 (0.0%) |
| 19 to 25 Years | 91 (80.5%) | 22 (19.5%) |
| 26 to 34 Years | 157 (82.6%) | 33 (17.4%) |
| 35 to 44 Years | 98 (100.0%) | 0 (0.0%) |
| 45 to 54 Years | 103 (90.3%) | 11 (9.7%) |
| 55 to 64 Years | 116 (84.7%) | 21 (15.3%) |
| 65 to 74 Years | 78 (100.0%) | 0 (0.0%) |
| 75 Years and older | 75 (100.0%) | 0 (0.0%) |
| Total | 1,061 (92.4%) | 87 (7.6%) |
Health Insurance Coverage by Citizenship Status in West Park
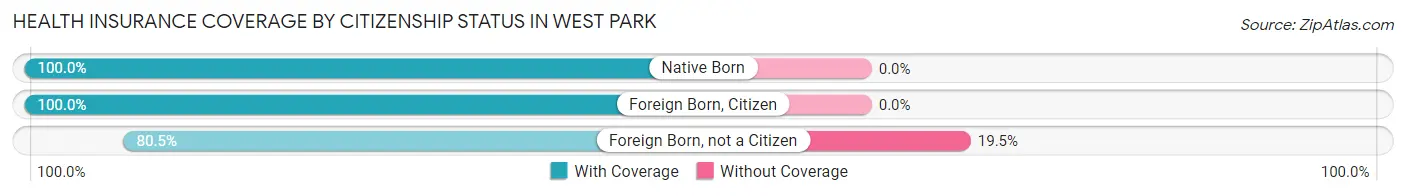
| Citizenship Status | With Coverage | Without Coverage |
| Native Born | 182 (100.0%) | 0 (0.0%) |
| Foreign Born, Citizen | 161 (100.0%) | 0 (0.0%) |
| Foreign Born, not a Citizen | 91 (80.5%) | 22 (19.5%) |
Health Insurance Coverage by Household Income in West Park
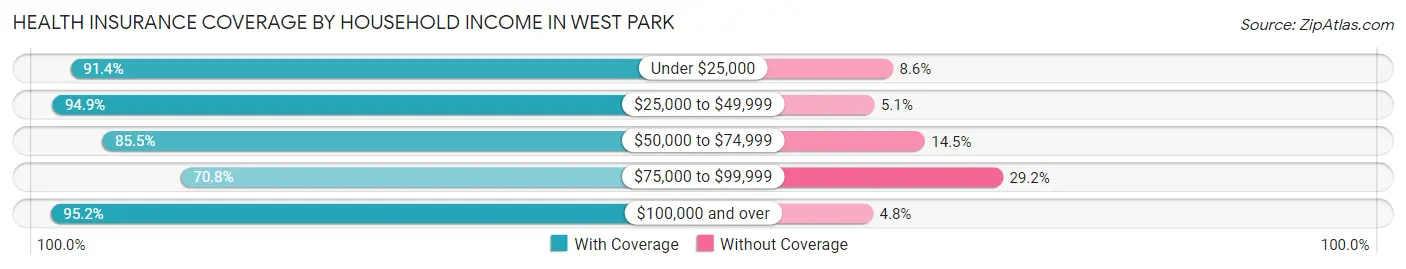
| Household Income | With Coverage | Without Coverage |
| Under $25,000 | 192 (91.4%) | 18 (8.6%) |
| $25,000 to $49,999 | 148 (94.9%) | 8 (5.1%) |
| $50,000 to $74,999 | 153 (85.5%) | 26 (14.5%) |
| $75,000 to $99,999 | 17 (70.8%) | 7 (29.2%) |
| $100,000 and over | 551 (95.2%) | 28 (4.8%) |
Public vs Private Health Insurance Coverage by Age in West Park
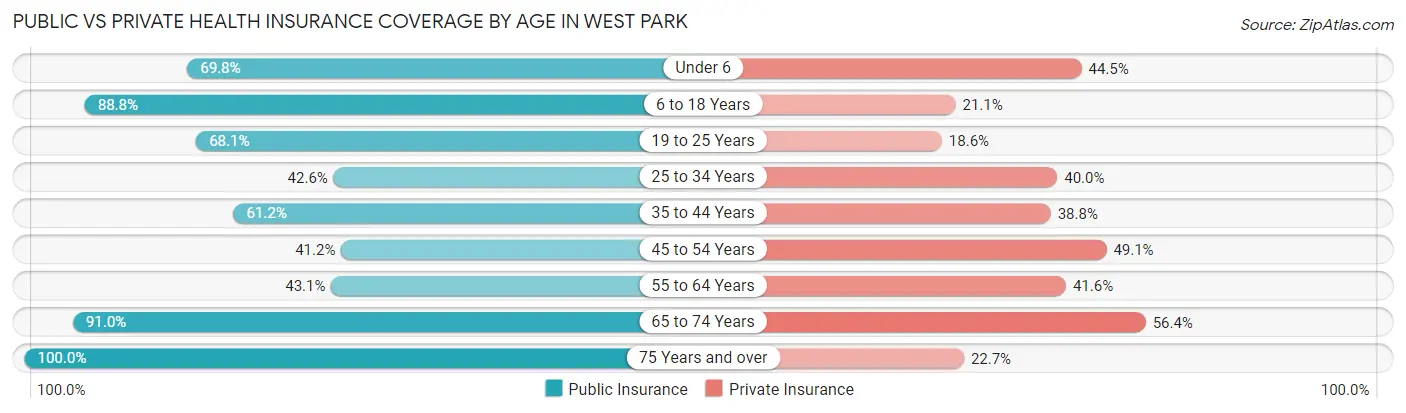
| Age Bracket | Public Insurance | Private Insurance |
| Under 6 | 127 (69.8%) | 81 (44.5%) |
| 6 to 18 Years | 143 (88.8%) | 34 (21.1%) |
| 19 to 25 Years | 77 (68.1%) | 21 (18.6%) |
| 25 to 34 Years | 81 (42.6%) | 76 (40.0%) |
| 35 to 44 Years | 60 (61.2%) | 38 (38.8%) |
| 45 to 54 Years | 47 (41.2%) | 56 (49.1%) |
| 55 to 64 Years | 59 (43.1%) | 57 (41.6%) |
| 65 to 74 Years | 71 (91.0%) | 44 (56.4%) |
| 75 Years and over | 75 (100.0%) | 17 (22.7%) |
| Total | 740 (64.5%) | 424 (36.9%) |
Disability Status by Sex by Age in West Park
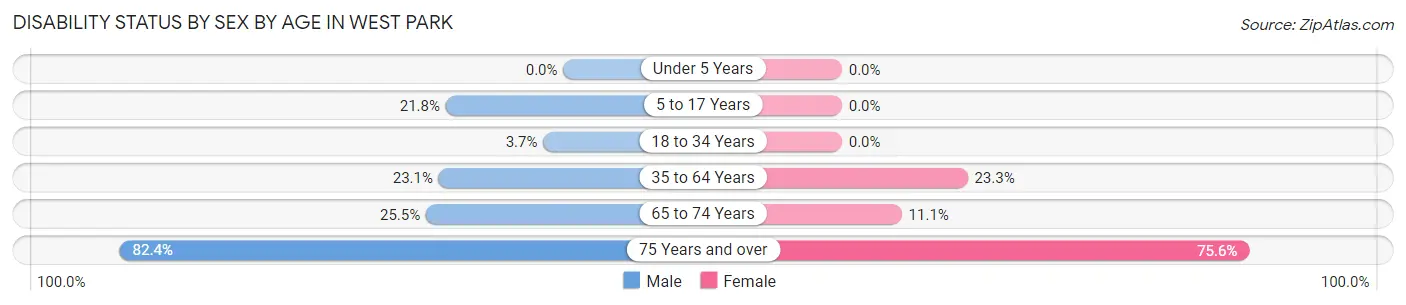
| Age Bracket | Male | Female |
| Under 5 Years | 0 (0.0%) | 0 (0.0%) |
| 5 to 17 Years | 12 (21.8%) | 0 (0.0%) |
| 18 to 34 Years | 7 (3.7%) | 0 (0.0%) |
| 35 to 64 Years | 46 (23.1%) | 35 (23.3%) |
| 65 to 74 Years | 13 (25.5%) | 3 (11.1%) |
| 75 Years and over | 28 (82.4%) | 31 (75.6%) |
Disability Class by Sex by Age in West Park
Disability Class: Hearing Difficulty
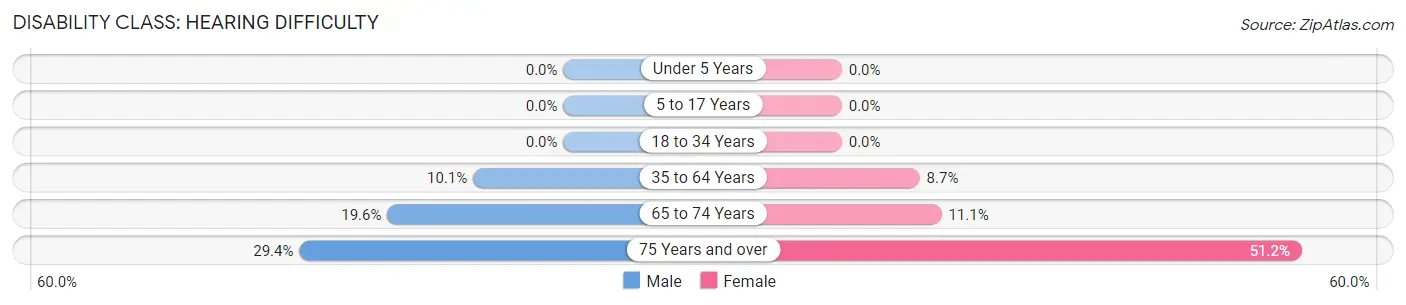
| Age Bracket | Male | Female |
| Under 5 Years | 0 (0.0%) | 0 (0.0%) |
| 5 to 17 Years | 0 (0.0%) | 0 (0.0%) |
| 18 to 34 Years | 0 (0.0%) | 0 (0.0%) |
| 35 to 64 Years | 20 (10.1%) | 13 (8.7%) |
| 65 to 74 Years | 10 (19.6%) | 3 (11.1%) |
| 75 Years and over | 10 (29.4%) | 21 (51.2%) |
Disability Class: Vision Difficulty
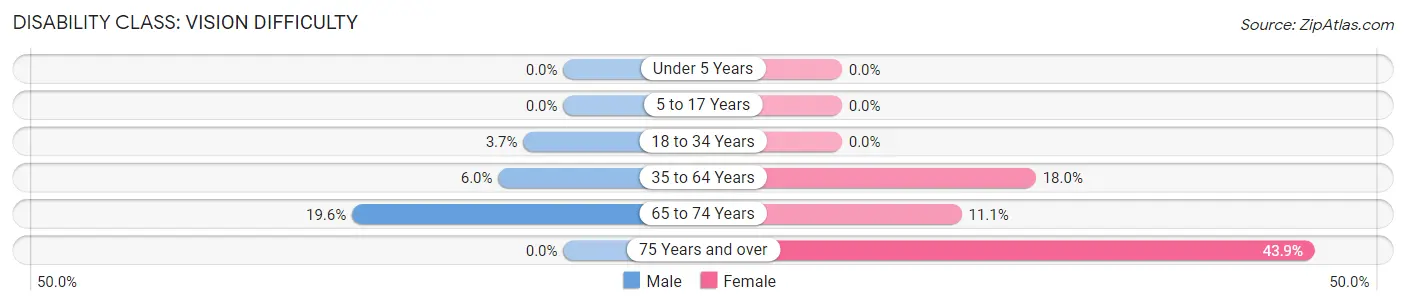
| Age Bracket | Male | Female |
| Under 5 Years | 0 (0.0%) | 0 (0.0%) |
| 5 to 17 Years | 0 (0.0%) | 0 (0.0%) |
| 18 to 34 Years | 7 (3.7%) | 0 (0.0%) |
| 35 to 64 Years | 12 (6.0%) | 27 (18.0%) |
| 65 to 74 Years | 10 (19.6%) | 3 (11.1%) |
| 75 Years and over | 0 (0.0%) | 18 (43.9%) |
Disability Class: Cognitive Difficulty
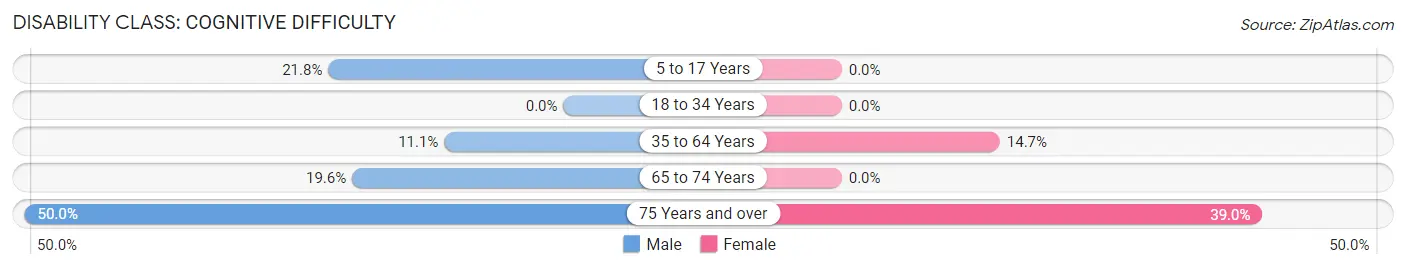
| Age Bracket | Male | Female |
| 5 to 17 Years | 12 (21.8%) | 0 (0.0%) |
| 18 to 34 Years | 0 (0.0%) | 0 (0.0%) |
| 35 to 64 Years | 22 (11.1%) | 22 (14.7%) |
| 65 to 74 Years | 10 (19.6%) | 0 (0.0%) |
| 75 Years and over | 17 (50.0%) | 16 (39.0%) |
Disability Class: Ambulatory Difficulty
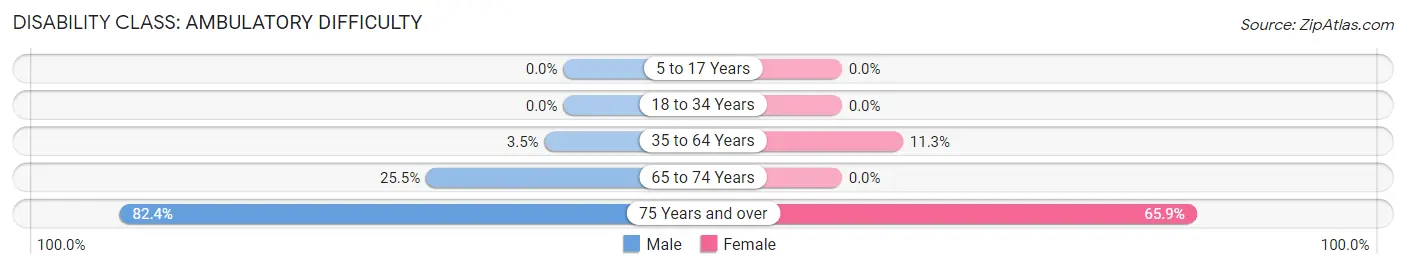
| Age Bracket | Male | Female |
| 5 to 17 Years | 0 (0.0%) | 0 (0.0%) |
| 18 to 34 Years | 0 (0.0%) | 0 (0.0%) |
| 35 to 64 Years | 7 (3.5%) | 17 (11.3%) |
| 65 to 74 Years | 13 (25.5%) | 0 (0.0%) |
| 75 Years and over | 28 (82.4%) | 27 (65.8%) |
Disability Class: Self-Care Difficulty
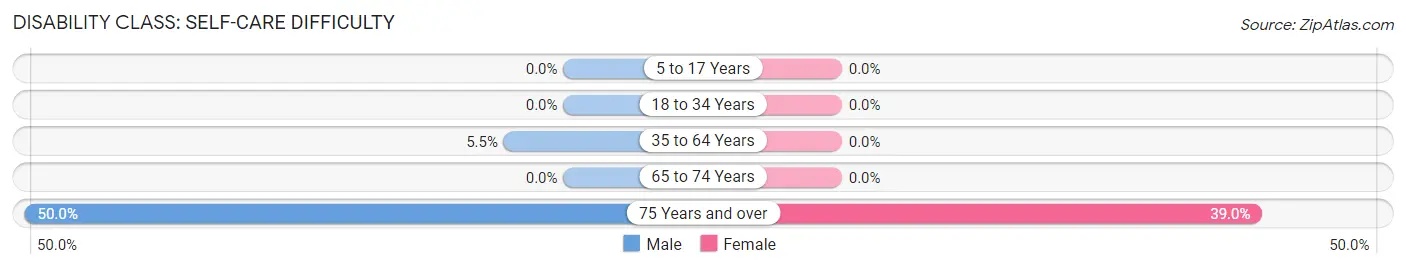
| Age Bracket | Male | Female |
| 5 to 17 Years | 0 (0.0%) | 0 (0.0%) |
| 18 to 34 Years | 0 (0.0%) | 0 (0.0%) |
| 35 to 64 Years | 11 (5.5%) | 0 (0.0%) |
| 65 to 74 Years | 0 (0.0%) | 0 (0.0%) |
| 75 Years and over | 17 (50.0%) | 16 (39.0%) |
Technology Access in West Park
Computing Device Access in West Park
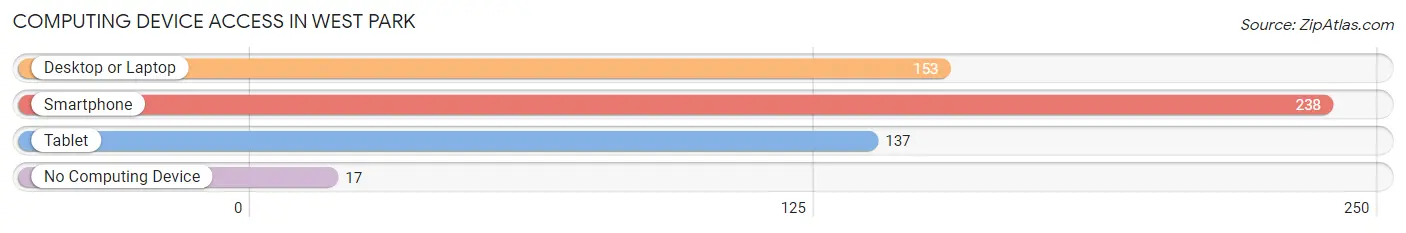
| Device Type | # Households | % Households |
| Desktop or Laptop | 153 | 59.8% |
| Smartphone | 238 | 93.0% |
| Tablet | 137 | 53.5% |
| No Computing Device | 17 | 6.6% |
| Total | 256 | 100.0% |
Internet Access in West Park
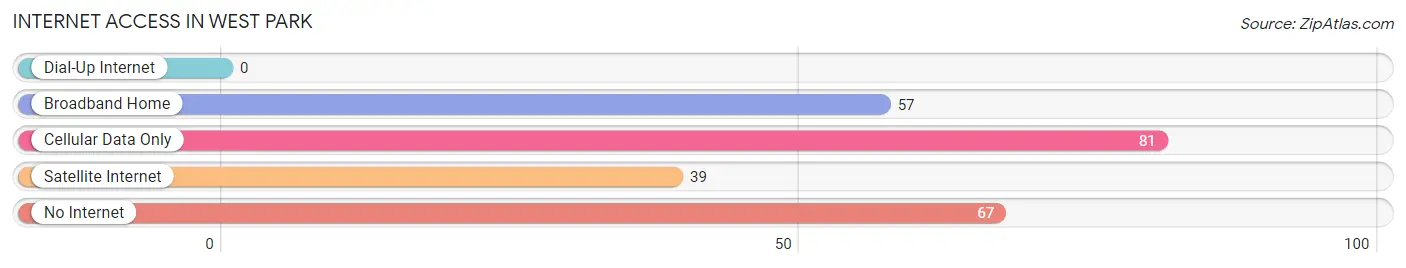
| Internet Type | # Households | % Households |
| Dial-Up Internet | 0 | 0.0% |
| Broadband Home | 57 | 22.3% |
| Cellular Data Only | 81 | 31.6% |
| Satellite Internet | 39 | 15.2% |
| No Internet | 67 | 26.2% |
| Total | 256 | 100.0% |
West Park Summary
West Park is a small city located in Los Angeles County, California. It is situated in the San Fernando Valley, just north of the city of Los Angeles. The city was incorporated in 1987 and has a population of approximately 24,000 people.
Geography
West Park is located in the San Fernando Valley, just north of the city of Los Angeles. It is bordered by the cities of North Hollywood to the east, Burbank to the north, and Sun Valley to the west. The city is situated in the foothills of the Santa Monica Mountains, and is surrounded by the Verdugo Mountains to the east and the San Gabriel Mountains to the north. The city covers an area of approximately 4.5 square miles.
Climate
West Park has a Mediterranean climate, with hot, dry summers and mild, wet winters. The average high temperature in the summer is around 85°F, and the average low temperature in the winter is around 50°F. The city receives an average of 15 inches of rain per year.
Demographics
As of the 2010 census, West Park had a population of 24,000 people. The racial makeup of the city was 57.3% White, 11.2% African American, 0.7% Native American, 11.2% Asian, 0.2% Pacific Islander, and 19.6% from other races. The median household income was $50,000, and the median family income was $54,000.
Economy
West Park is home to a variety of businesses, including retail stores, restaurants, and professional services. The city is also home to several major employers, including the Los Angeles County Department of Health Services, the Los Angeles Unified School District, and the Los Angeles County Sheriff's Department.
History
West Park was originally part of the Rancho San Rafael, a large land grant given to the Verdugo family in 1784. The area was later subdivided and sold off in the late 19th century. The city was incorporated in 1987, and has since grown to become a vibrant community.
Conclusion
West Park is a small city located in Los Angeles County, California. It is situated in the San Fernando Valley, just north of the city of Los Angeles. The city was incorporated in 1987 and has a population of approximately 24,000 people. West Park has a Mediterranean climate, with hot, dry summers and mild, wet winters. The city is home to a variety of businesses, including retail stores, restaurants, and professional services. The racial makeup of the city is 57.3% White, 11.2% African American, 0.7% Native American, 11.2% Asian, 0.2% Pacific Islander, and 19.6% from other races. The median household income was $50,000, and the median family income was $54,000. West Park is a vibrant community with a rich history and a bright future.
Common Questions
What is Per Capita Income in West Park?
Per Capita income in West Park is $25,848.
What is the Median Family Income in West Park?
Median Family Income in West Park is $70,625.
What is the Median Household income in West Park?
Median Household Income in West Park is $71,250.
What is Income or Wage Gap in West Park?
Income or Wage Gap in West Park is 4.6%.
Women in West Park earn 95.4 cents for every dollar earned by a man.
What is Inequality or Gini Index in West Park?
Inequality or Gini Index in West Park is 0.46.
What is the Total Population of West Park?
Total Population of West Park is 1,148.
What is the Total Male Population of West Park?
Total Male Population of West Park is 632.
What is the Total Female Population of West Park?
Total Female Population of West Park is 516.
What is the Ratio of Males per 100 Females in West Park?
There are 122.48 Males per 100 Females in West Park.
What is the Ratio of Females per 100 Males in West Park?
There are 81.65 Females per 100 Males in West Park.
What is the Median Population Age in West Park?
Median Population Age in West Park is 30.9 Years.
What is the Average Family Size in West Park
Average Family Size in West Park is 5.0 People.
What is the Average Household Size in West Park
Average Household Size in West Park is 4.5 People.
How Large is the Labor Force in West Park?
There are 487 People in the Labor Forcein in West Park.
What is the Percentage of People in the Labor Force in West Park?
58.3% of People are in the Labor Force in West Park.
What is the Unemployment Rate in West Park?
Unemployment Rate in West Park is 14.0%.