Cities with the Highest Percentage of Population Employed in Life, Physical & Social Science in Louisiana
RELATED REPORTS & OPTIONS
Life, Physical & Social Science
Louisiana
Compare Cities
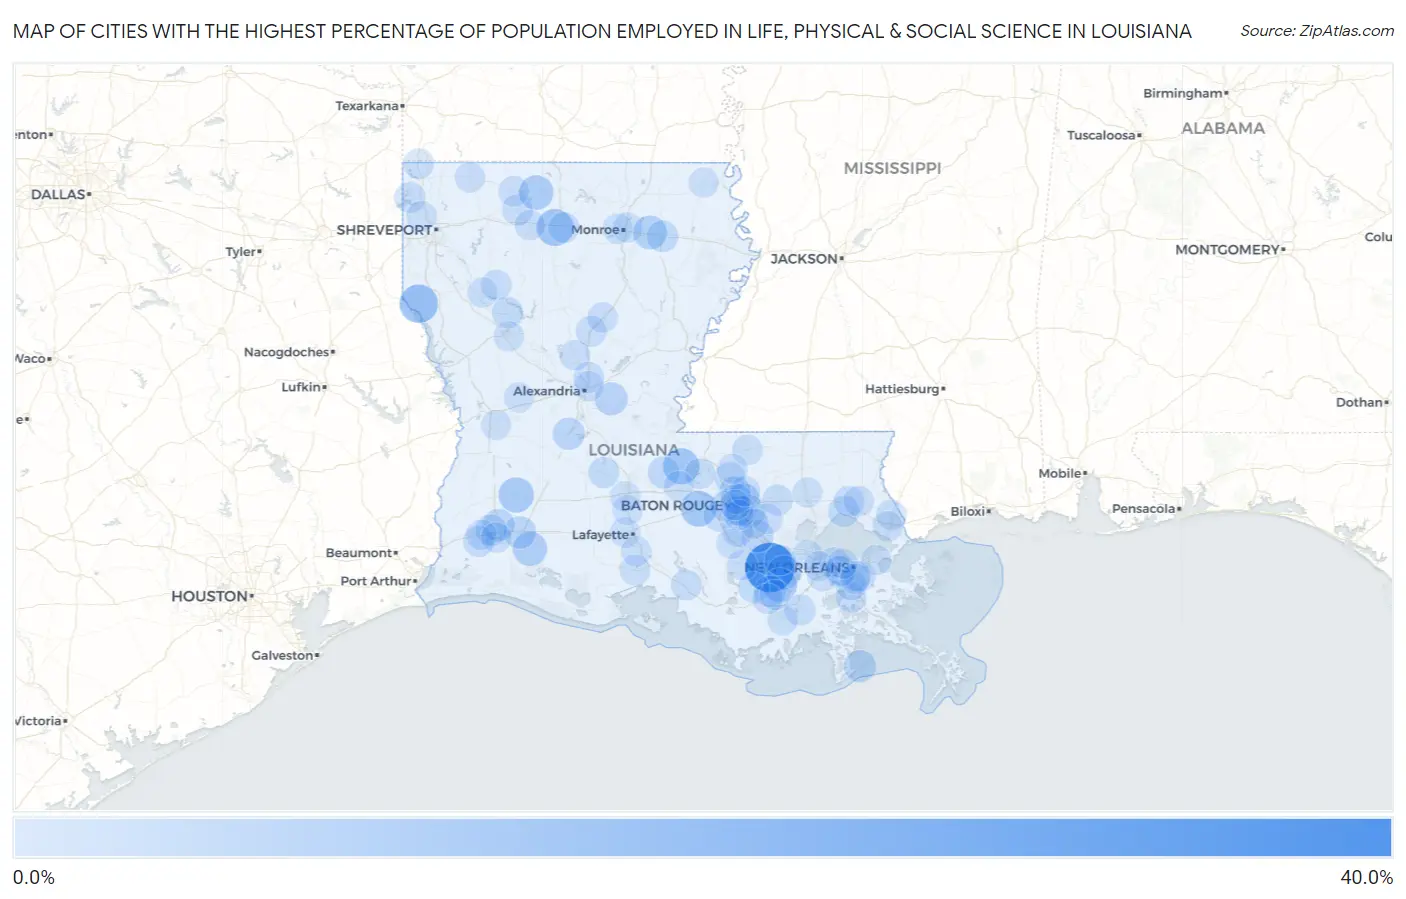
Map of Cities with the Highest Percentage of Population Employed in Life, Physical & Social Science in Louisiana
0.0%
40.0%
Cities with the Highest Percentage of Population Employed in Life, Physical & Social Science in Louisiana
| City | % Employed | vs State | vs National | |
| 1. | Moonshine | 30.6% | 0.98%(+29.6)#1 | 1.1%(+29.5)#43 |
| 2. | Stanley | 13.0% | 0.98%(+12.1)#2 | 1.1%(+12.0)#158 |
| 3. | Grambling | 10.9% | 0.98%(+9.94)#3 | 1.1%(+9.83)#204 |
| 4. | Morganza | 9.8% | 0.98%(+8.86)#4 | 1.1%(+8.75)#235 |
| 5. | Grosse Tete | 9.2% | 0.98%(+8.26)#5 | 1.1%(+8.15)#271 |
| 6. | Reeves | 8.3% | 0.98%(+7.36)#6 | 1.1%(+7.24)#320 |
| 7. | Lisbon | 7.3% | 0.98%(+6.31)#7 | 1.1%(+6.20)#393 |
| 8. | South Vacherie | 7.1% | 0.98%(+6.07)#8 | 1.1%(+5.96)#425 |
| 9. | Hayes | 7.0% | 0.98%(+6.03)#9 | 1.1%(+5.92)#436 |
| 10. | Choctaw | 6.8% | 0.98%(+5.85)#10 | 1.1%(+5.74)#454 |
| 11. | Start | 6.3% | 0.98%(+5.30)#11 | 1.1%(+5.19)#535 |
| 12. | Center Point | 5.1% | 0.98%(+4.13)#12 | 1.1%(+4.02)#765 |
| 13. | Monticello | 5.1% | 0.98%(+4.09)#13 | 1.1%(+3.97)#775 |
| 14. | Shenandoah | 4.9% | 0.98%(+3.93)#14 | 1.1%(+3.81)#816 |
| 15. | Iowa | 4.3% | 0.98%(+3.36)#15 | 1.1%(+3.25)#1,027 |
| 16. | Moss Bluff | 4.1% | 0.98%(+3.12)#16 | 1.1%(+3.00)#1,114 |
| 17. | Gonzales | 4.0% | 0.98%(+3.04)#17 | 1.1%(+2.93)#1,154 |
| 18. | Grand Isle | 4.0% | 0.98%(+3.02)#18 | 1.1%(+2.91)#1,163 |
| 19. | Mcnary | 3.9% | 0.98%(+2.92)#19 | 1.1%(+2.81)#1,227 |
| 20. | Brownfields | 3.7% | 0.98%(+2.68)#20 | 1.1%(+2.57)#1,363 |
| 21. | Melville | 3.5% | 0.98%(+2.56)#21 | 1.1%(+2.45)#1,444 |
| 22. | Rayville | 3.1% | 0.98%(+2.12)#22 | 1.1%(+2.01)#1,793 |
| 23. | Westlake | 2.8% | 0.98%(+1.85)#23 | 1.1%(+1.73)#2,043 |
| 24. | Thibodaux | 2.8% | 0.98%(+1.80)#24 | 1.1%(+1.69)#2,108 |
| 25. | Madisonville | 2.7% | 0.98%(+1.71)#25 | 1.1%(+1.60)#2,236 |
| 26. | St Gabriel | 2.6% | 0.98%(+1.66)#26 | 1.1%(+1.54)#2,299 |
| 27. | Campti | 2.6% | 0.98%(+1.60)#27 | 1.1%(+1.49)#2,392 |
| 28. | Labadieville | 2.6% | 0.98%(+1.58)#28 | 1.1%(+1.47)#2,419 |
| 29. | Zachary | 2.5% | 0.98%(+1.55)#29 | 1.1%(+1.44)#2,480 |
| 30. | Lockport Heights | 2.5% | 0.98%(+1.49)#30 | 1.1%(+1.37)#2,583 |
| 31. | Carlyss | 2.5% | 0.98%(+1.48)#31 | 1.1%(+1.37)#2,590 |
| 32. | Ville Platte | 2.4% | 0.98%(+1.37)#32 | 1.1%(+1.26)#2,775 |
| 33. | Oil City | 2.2% | 0.98%(+1.27)#33 | 1.1%(+1.16)#2,946 |
| 34. | Georgetown | 2.2% | 0.98%(+1.24)#34 | 1.1%(+1.13)#3,002 |
| 35. | Athens | 2.1% | 0.98%(+1.15)#35 | 1.1%(+1.04)#3,173 |
| 36. | Livingston | 2.1% | 0.98%(+1.08)#36 | 1.1%(+0.972)#3,290 |
| 37. | Ventress | 2.1% | 0.98%(+1.08)#37 | 1.1%(+0.962)#3,312 |
| 38. | Ruston | 2.0% | 0.98%(+1.07)#38 | 1.1%(+0.955)#3,328 |
| 39. | Inniswold | 2.0% | 0.98%(+1.03)#39 | 1.1%(+0.917)#3,408 |
| 40. | Terrytown | 1.9% | 0.98%(+0.932)#40 | 1.1%(+0.819)#3,629 |
| 41. | Baldwin | 1.9% | 0.98%(+0.927)#41 | 1.1%(+0.814)#3,635 |
| 42. | Elmwood | 1.9% | 0.98%(+0.922)#42 | 1.1%(+0.809)#3,656 |
| 43. | Paulina | 1.9% | 0.98%(+0.909)#43 | 1.1%(+0.796)#3,697 |
| 44. | Addis | 1.9% | 0.98%(+0.899)#44 | 1.1%(+0.786)#3,726 |
| 45. | Martin | 1.9% | 0.98%(+0.897)#45 | 1.1%(+0.784)#3,734 |
| 46. | Jean Lafitte | 1.9% | 0.98%(+0.888)#46 | 1.1%(+0.775)#3,755 |
| 47. | Westminster | 1.9% | 0.98%(+0.875)#47 | 1.1%(+0.762)#3,786 |
| 48. | Paincourtville | 1.8% | 0.98%(+0.869)#48 | 1.1%(+0.756)#3,809 |
| 49. | Ball | 1.8% | 0.98%(+0.784)#49 | 1.1%(+0.671)#4,034 |
| 50. | Estelle | 1.7% | 0.98%(+0.749)#50 | 1.1%(+0.636)#4,128 |
| 51. | Port Allen | 1.7% | 0.98%(+0.720)#51 | 1.1%(+0.607)#4,222 |
| 52. | Houma | 1.7% | 0.98%(+0.716)#52 | 1.1%(+0.603)#4,240 |
| 53. | Homer | 1.7% | 0.98%(+0.705)#53 | 1.1%(+0.592)#4,269 |
| 54. | Delcambre | 1.7% | 0.98%(+0.678)#54 | 1.1%(+0.565)#4,329 |
| 55. | Kenner | 1.6% | 0.98%(+0.650)#55 | 1.1%(+0.537)#4,412 |
| 56. | Sulphur | 1.6% | 0.98%(+0.642)#56 | 1.1%(+0.530)#4,434 |
| 57. | Lake Charles | 1.6% | 0.98%(+0.631)#57 | 1.1%(+0.518)#4,474 |
| 58. | Covington | 1.6% | 0.98%(+0.626)#58 | 1.1%(+0.513)#4,484 |
| 59. | Urania | 1.6% | 0.98%(+0.576)#59 | 1.1%(+0.463)#4,640 |
| 60. | Port Vincent | 1.5% | 0.98%(+0.570)#60 | 1.1%(+0.457)#4,658 |
| 61. | Prairieville | 1.5% | 0.98%(+0.522)#61 | 1.1%(+0.409)#4,834 |
| 62. | Schriever | 1.5% | 0.98%(+0.521)#62 | 1.1%(+0.408)#4,838 |
| 63. | Abita Springs | 1.5% | 0.98%(+0.517)#63 | 1.1%(+0.404)#4,864 |
| 64. | Clinton | 1.5% | 0.98%(+0.502)#64 | 1.1%(+0.389)#4,932 |
| 65. | Merrydale | 1.4% | 0.98%(+0.458)#65 | 1.1%(+0.346)#5,111 |
| 66. | Harahan | 1.4% | 0.98%(+0.455)#66 | 1.1%(+0.342)#5,130 |
| 67. | Ida | 1.4% | 0.98%(+0.451)#67 | 1.1%(+0.338)#5,154 |
| 68. | New Orleans | 1.4% | 0.98%(+0.438)#68 | 1.1%(+0.325)#5,192 |
| 69. | Pearl River | 1.4% | 0.98%(+0.414)#69 | 1.1%(+0.301)#5,271 |
| 70. | Oak Hills Place | 1.4% | 0.98%(+0.414)#70 | 1.1%(+0.301)#5,272 |
| 71. | Dry Prong | 1.4% | 0.98%(+0.398)#71 | 1.1%(+0.285)#5,320 |
| 72. | Baton Rouge | 1.4% | 0.98%(+0.396)#72 | 1.1%(+0.283)#5,335 |
| 73. | Arcadia | 1.4% | 0.98%(+0.388)#73 | 1.1%(+0.275)#5,365 |
| 74. | Slidell | 1.3% | 0.98%(+0.372)#74 | 1.1%(+0.259)#5,452 |
| 75. | Central | 1.3% | 0.98%(+0.346)#75 | 1.1%(+0.233)#5,560 |
| 76. | Luling | 1.3% | 0.98%(+0.345)#76 | 1.1%(+0.233)#5,565 |
| 77. | Laplace | 1.3% | 0.98%(+0.333)#77 | 1.1%(+0.220)#5,619 |
| 78. | Sarepta | 1.3% | 0.98%(+0.321)#78 | 1.1%(+0.208)#5,682 |
| 79. | Blanchard | 1.3% | 0.98%(+0.273)#79 | 1.1%(+0.160)#5,894 |
| 80. | West Monroe | 1.2% | 0.98%(+0.239)#80 | 1.1%(+0.126)#6,051 |
| 81. | Scott | 1.2% | 0.98%(+0.230)#81 | 1.1%(+0.117)#6,085 |
| 82. | Youngsville | 1.2% | 0.98%(+0.225)#82 | 1.1%(+0.112)#6,115 |
| 83. | White Castle | 1.2% | 0.98%(+0.223)#83 | 1.1%(+0.110)#6,122 |
| 84. | Natchitoches | 1.2% | 0.98%(+0.218)#84 | 1.1%(+0.105)#6,147 |
| 85. | Pineville | 1.2% | 0.98%(+0.210)#85 | 1.1%(+0.097)#6,188 |
| 86. | Simpson | 1.2% | 0.98%(+0.185)#86 | 1.1%(+0.072)#6,313 |
| 87. | New Sarpy | 1.1% | 0.98%(+0.163)#87 | 1.1%(+0.050)#6,414 |
| 88. | Slaughter | 1.1% | 0.98%(+0.153)#88 | 1.1%(+0.040)#6,460 |
| 89. | Gretna | 1.1% | 0.98%(+0.152)#89 | 1.1%(+0.039)#6,463 |
| 90. | Metairie | 1.1% | 0.98%(+0.149)#90 | 1.1%(+0.036)#6,478 |
| 91. | Natalbany | 1.1% | 0.98%(+0.140)#91 | 1.1%(+0.027)#6,521 |
| 92. | Fordoche | 1.1% | 0.98%(+0.133)#92 | 1.1%(+0.020)#6,570 |
| 93. | Lafourche Crossing | 1.1% | 0.98%(+0.129)#93 | 1.1%(+0.016)#6,598 |
| 94. | Edgefield | 1.1% | 0.98%(+0.127)#94 | 1.1%(+0.014)#6,609 |
| 95. | Opelousas | 1.1% | 0.98%(+0.127)#95 | 1.1%(+0.014)#6,612 |
| 96. | Fort Polk South | 1.1% | 0.98%(+0.109)#96 | 1.1%(-0.004)#6,710 |
| 97. | Oak Grove | 1.1% | 0.98%(+0.088)#97 | 1.1%(-0.025)#6,815 |
| 98. | Monroe | 1.1% | 0.98%(+0.079)#98 | 1.1%(-0.034)#6,853 |
| 99. | Harvey | 1.0% | 0.98%(+0.071)#99 | 1.1%(-0.041)#6,886 |
| 100. | Sunset | 1.0% | 0.98%(+0.070)#100 | 1.1%(-0.043)#6,890 |
Common Questions
What are the Top 10 Cities with the Highest Percentage of Population Employed in Life, Physical & Social Science in Louisiana?
Top 10 Cities with the Highest Percentage of Population Employed in Life, Physical & Social Science in Louisiana are:
#1
30.6%
#2
13.0%
#3
10.9%
#4
9.8%
#5
9.2%
#6
8.3%
#7
7.3%
#8
7.1%
#9
7.0%
#10
6.8%
What city has the Highest Percentage of Population Employed in Life, Physical & Social Science in Louisiana?
Moonshine has the Highest Percentage of Population Employed in Life, Physical & Social Science in Louisiana with 30.6%.
What is the Percentage of Population Employed in Life, Physical & Social Science in the State of Louisiana?
Percentage of Population Employed in Life, Physical & Social Science in Louisiana is 0.98%.
What is the Percentage of Population Employed in Life, Physical & Social Science in the United States?
Percentage of Population Employed in Life, Physical & Social Science in the United States is 1.1%.