China Lake Acres, CA Map & Demographics
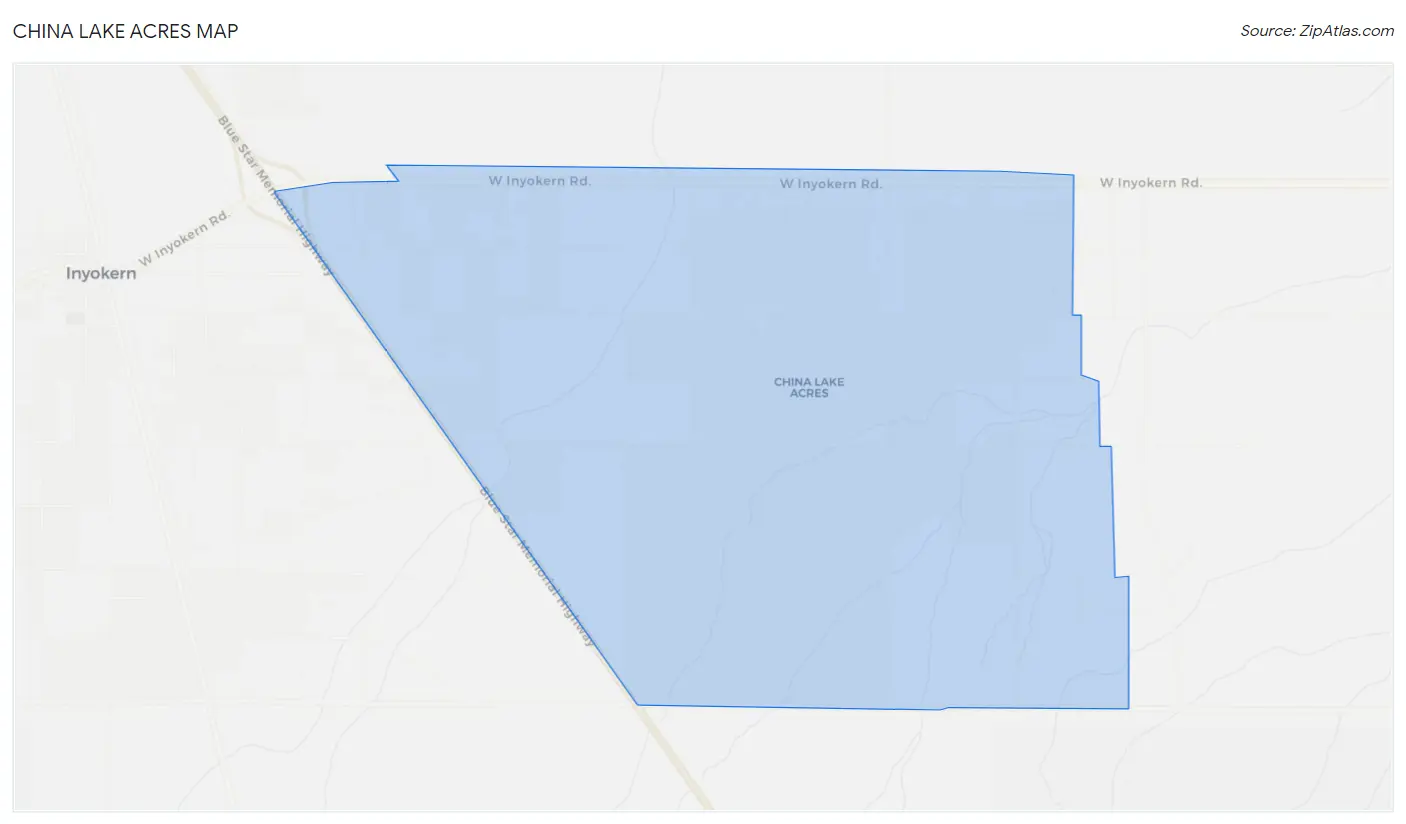
China Lake Acres Map
China Lake Acres Overview
$41,585
PER CAPITA INCOME
$68,007
AVG FAMILY INCOME
$48,063
AVG HOUSEHOLD INCOME
38.4%
WAGE / INCOME GAP [ % ]
61.6¢/ $1
WAGE / INCOME GAP [ $ ]
$11,368
FAMILY INCOME DEFICIT
0.65
INEQUALITY / GINI INDEX
2,385
TOTAL POPULATION
1,039
MALE POPULATION
1,346
FEMALE POPULATION
77.19
MALES / 100 FEMALES
129.55
FEMALES / 100 MALES
34.7
MEDIAN AGE
3.1
AVG FAMILY SIZE
2.9
AVG HOUSEHOLD SIZE
1,078
LABOR FORCE [ PEOPLE ]
63.7%
PERCENT IN LABOR FORCE
6.8%
UNEMPLOYMENT RATE
Income in China Lake Acres
Income Overview in China Lake Acres
Per Capita Income in China Lake Acres is $41,585, while median incomes of families and households are $68,007 and $48,063 respectively.
| Characteristic | Number | Measure |
| Per Capita Income | 2,385 | $41,585 |
| Median Family Income | 563 | $68,007 |
| Mean Family Income | 563 | $145,673 |
| Median Household Income | 820 | $48,063 |
| Mean Household Income | 820 | $118,630 |
| Income Deficit | 563 | $11,368 |
| Wage / Income Gap (%) | 2,385 | 38.36% |
| Wage / Income Gap ($) | 2,385 | 61.64¢ per $1 |
| Gini / Inequality Index | 2,385 | 0.65 |
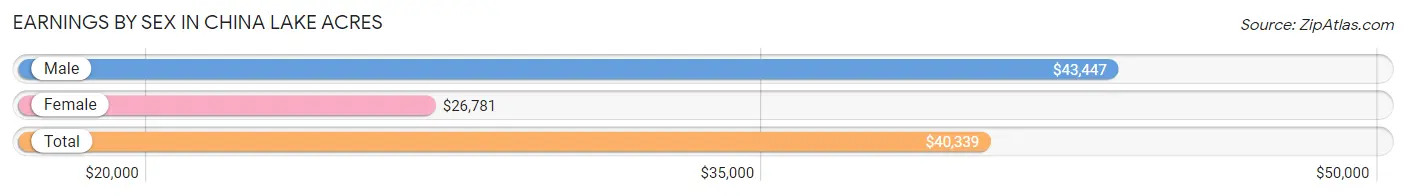
Earnings by Sex in China Lake Acres
Average Earnings in China Lake Acres are $40,339, $43,447 for men and $26,781 for women, a difference of 38.4%.
| Sex | Number | Average Earnings |
| Male | 495 (46.0%) | $43,447 |
| Female | 581 (54.0%) | $26,781 |
| Total | 1,076 (100.0%) | $40,339 |
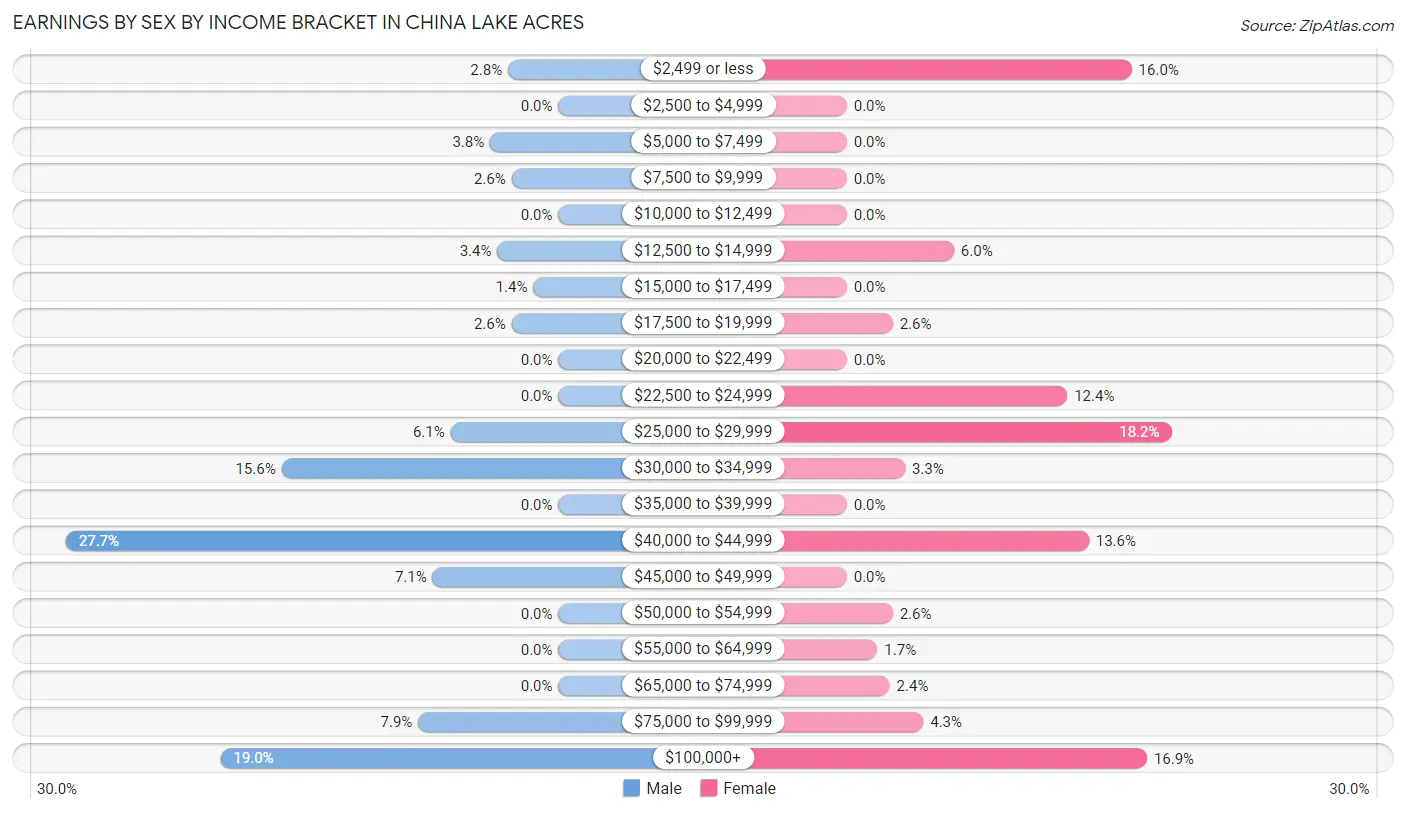
Earnings by Sex by Income Bracket in China Lake Acres
The most common earnings brackets in China Lake Acres are $40,000 to $44,999 for men (137 | 27.7%) and $25,000 to $29,999 for women (106 | 18.2%).
| Income | Male | Female |
| $2,499 or less | 14 (2.8%) | 93 (16.0%) |
| $2,500 to $4,999 | 0 (0.0%) | 0 (0.0%) |
| $5,000 to $7,499 | 19 (3.8%) | 0 (0.0%) |
| $7,500 to $9,999 | 13 (2.6%) | 0 (0.0%) |
| $10,000 to $12,499 | 0 (0.0%) | 0 (0.0%) |
| $12,500 to $14,999 | 17 (3.4%) | 35 (6.0%) |
| $15,000 to $17,499 | 7 (1.4%) | 0 (0.0%) |
| $17,500 to $19,999 | 13 (2.6%) | 15 (2.6%) |
| $20,000 to $22,499 | 0 (0.0%) | 0 (0.0%) |
| $22,500 to $24,999 | 0 (0.0%) | 72 (12.4%) |
| $25,000 to $29,999 | 30 (6.1%) | 106 (18.2%) |
| $30,000 to $34,999 | 77 (15.6%) | 19 (3.3%) |
| $35,000 to $39,999 | 0 (0.0%) | 0 (0.0%) |
| $40,000 to $44,999 | 137 (27.7%) | 79 (13.6%) |
| $45,000 to $49,999 | 35 (7.1%) | 0 (0.0%) |
| $50,000 to $54,999 | 0 (0.0%) | 15 (2.6%) |
| $55,000 to $64,999 | 0 (0.0%) | 10 (1.7%) |
| $65,000 to $74,999 | 0 (0.0%) | 14 (2.4%) |
| $75,000 to $99,999 | 39 (7.9%) | 25 (4.3%) |
| $100,000+ | 94 (19.0%) | 98 (16.9%) |
| Total | 495 (100.0%) | 581 (100.0%) |
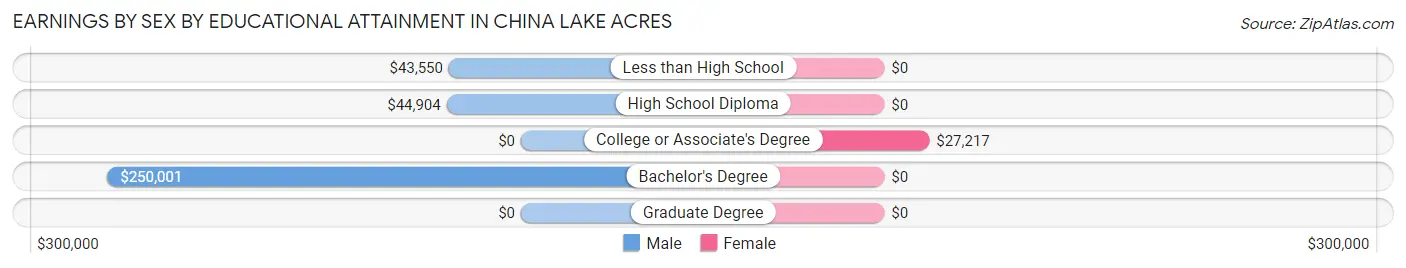
Earnings by Sex by Educational Attainment in China Lake Acres
Average earnings in China Lake Acres are $44,436 for men and $33,158 for women, a difference of 25.4%. Men with an educational attainment of bachelor's degree enjoy the highest average annual earnings of $250,001, while those with less than high school education earn the least with $43,550. Women with an educational attainment of college or associate's degree earn the most with the average annual earnings of $27,217, while those with college or associate's degree education have the smallest earnings of $27,217.
| Educational Attainment | Male Income | Female Income |
| Less than High School | $43,550 | $0 |
| High School Diploma | $44,904 | $0 |
| College or Associate's Degree | - | - |
| Bachelor's Degree | $250,001 | $0 |
| Graduate Degree | - | - |
| Total | $44,436 | $33,158 |
Family Income in China Lake Acres
Family Income Brackets in China Lake Acres
According to the China Lake Acres family income data, there are 131 families falling into the $50,000 to $74,999 income range, which is the most common income bracket and makes up 23.3% of all families.
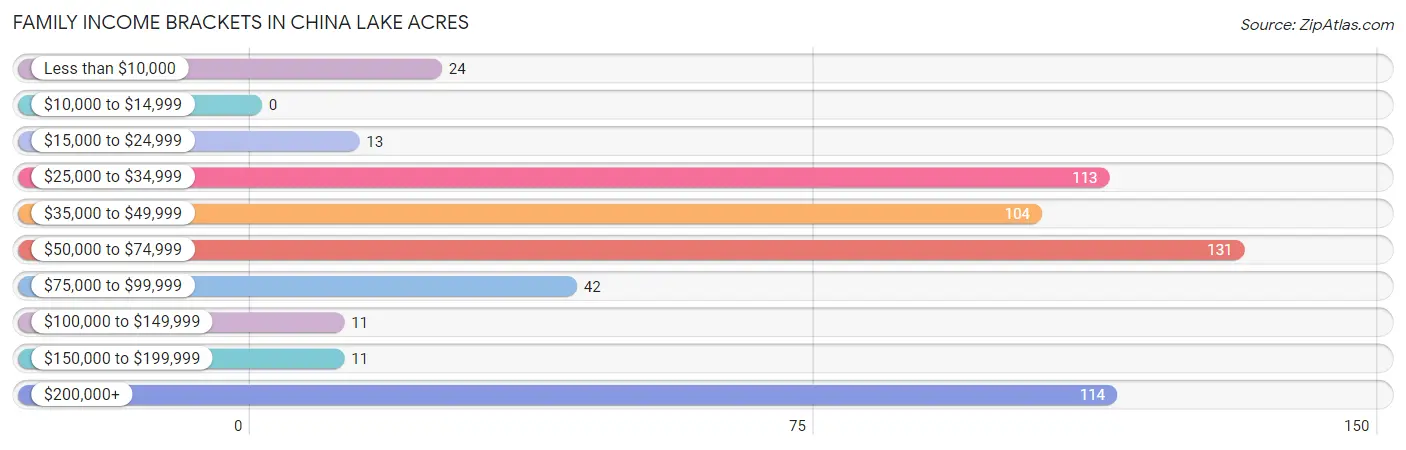
| Income Bracket | # Families | % Families |
| Less than $10,000 | 24 | 4.3% |
| $10,000 to $14,999 | 0 | 0.0% |
| $15,000 to $24,999 | 13 | 2.3% |
| $25,000 to $34,999 | 113 | 20.1% |
| $35,000 to $49,999 | 104 | 18.5% |
| $50,000 to $74,999 | 131 | 23.3% |
| $75,000 to $99,999 | 42 | 7.5% |
| $100,000 to $149,999 | 11 | 2.0% |
| $150,000 to $199,999 | 11 | 2.0% |
| $200,000+ | 114 | 20.2% |
Family Income by Famaliy Size in China Lake Acres
2-person families (172 | 30.5%) account for the highest median family income in China Lake Acres with $47,125 per family, while 2-person families (172 | 30.5%) have the highest median income of $23,562 per family member.
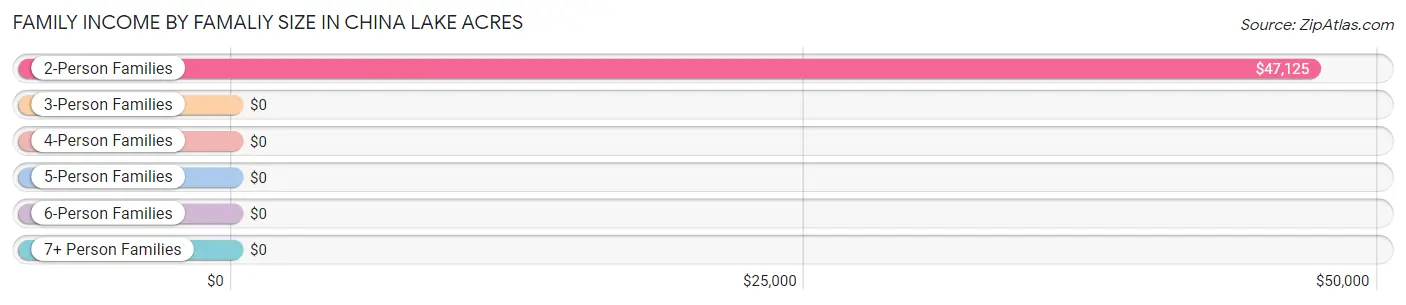
| Income Bracket | # Families | Median Income |
| 2-Person Families | 172 (30.5%) | $47,125 |
| 3-Person Families | 235 (41.7%) | $0 |
| 4-Person Families | 46 (8.2%) | $0 |
| 5-Person Families | 95 (16.9%) | $0 |
| 6-Person Families | 15 (2.7%) | $0 |
| 7+ Person Families | 0 (0.0%) | $0 |
| Total | 563 (100.0%) | $68,007 |
Family Income by Number of Earners in China Lake Acres
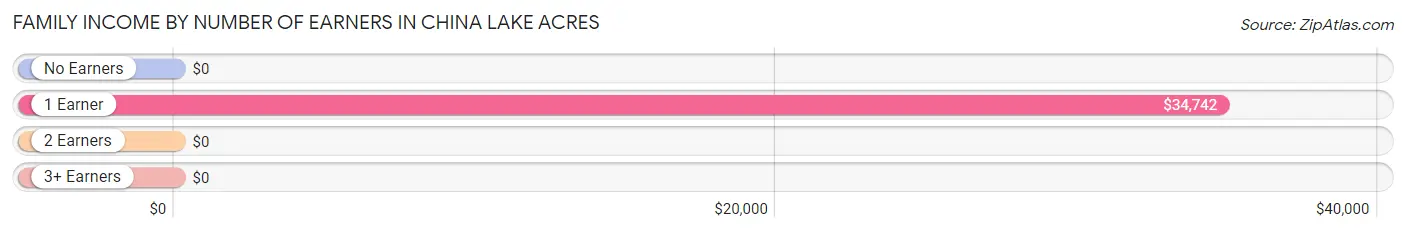
| Number of Earners | # Families | Median Income |
| No Earners | 75 (13.3%) | $0 |
| 1 Earner | 209 (37.1%) | $34,742 |
| 2 Earners | 253 (44.9%) | $0 |
| 3+ Earners | 26 (4.6%) | $0 |
| Total | 563 (100.0%) | $68,007 |
Household Income in China Lake Acres
Household Income Brackets in China Lake Acres
With 155 households falling in the category, the $25,000 to $34,999 income range is the most frequent in China Lake Acres, accounting for 18.9% of all households. In contrast, only 20 households (2.4%) fall into the $100,000 to $149,999 income bracket, making it the least populous group.
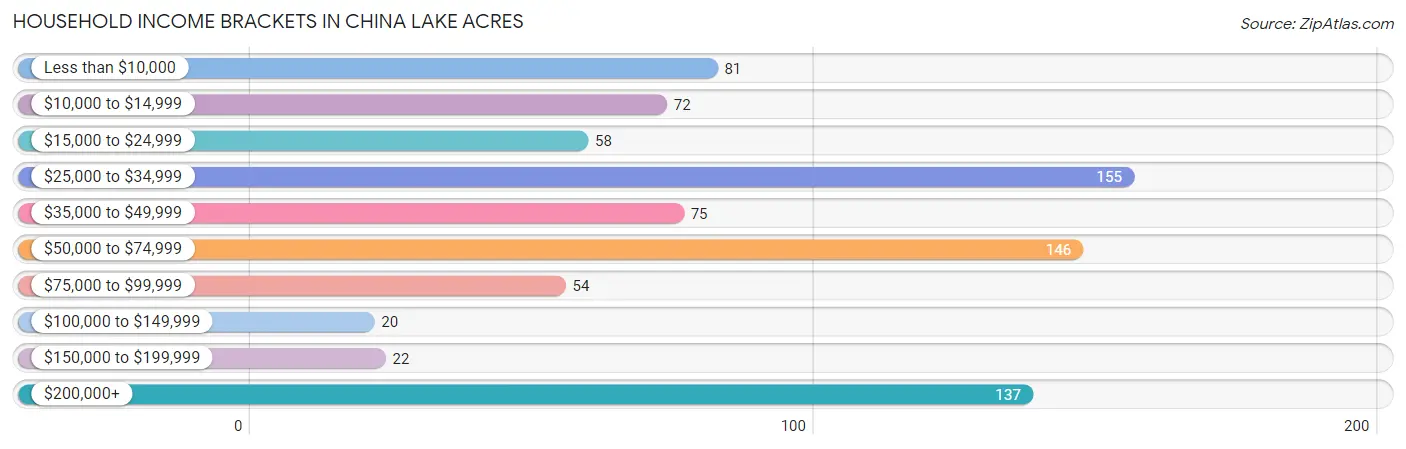
| Income Bracket | # Households | % Households |
| Less than $10,000 | 81 | 9.9% |
| $10,000 to $14,999 | 72 | 8.8% |
| $15,000 to $24,999 | 58 | 7.1% |
| $25,000 to $34,999 | 155 | 18.9% |
| $35,000 to $49,999 | 75 | 9.1% |
| $50,000 to $74,999 | 146 | 17.8% |
| $75,000 to $99,999 | 54 | 6.6% |
| $100,000 to $149,999 | 20 | 2.4% |
| $150,000 to $199,999 | 22 | 2.7% |
| $200,000+ | 137 | 16.7% |
Household Income by Householder Age in China Lake Acres
The median household income in China Lake Acres is $48,063, with the highest median household income of $69,116 found in the 25 to 44 years age bracket for the primary householder. A total of 319 households (38.9%) fall into this category. Meanwhile, the 15 to 24 years age bracket for the primary householder has the lowest median household income of $0, with 63 households (7.7%) in this group.
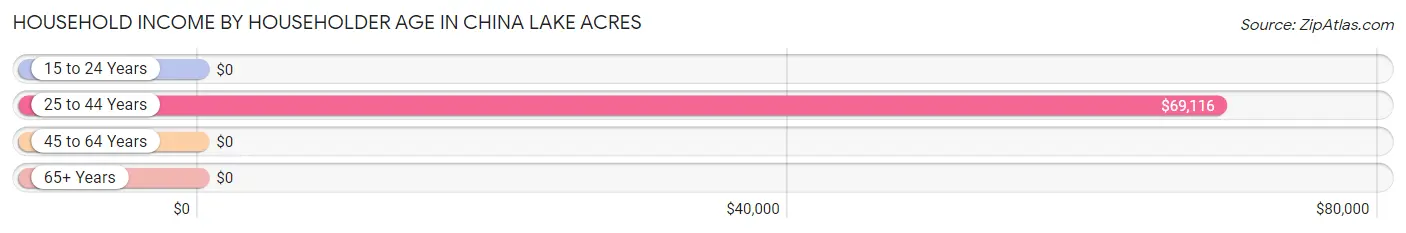
| Income Bracket | # Households | Median Income |
| 15 to 24 Years | 63 (7.7%) | $0 |
| 25 to 44 Years | 319 (38.9%) | $69,116 |
| 45 to 64 Years | 282 (34.4%) | $0 |
| 65+ Years | 156 (19.0%) | $0 |
| Total | 820 (100.0%) | $48,063 |
Poverty in China Lake Acres
Income Below Poverty by Sex and Age in China Lake Acres
With 18.1% poverty level for males and 29.7% for females among the residents of China Lake Acres, 75 year old and over males and 15 year old females are the most vulnerable to poverty, with 60 males (65.2%) and 50 females (100.0%) in their respective age groups living below the poverty level.
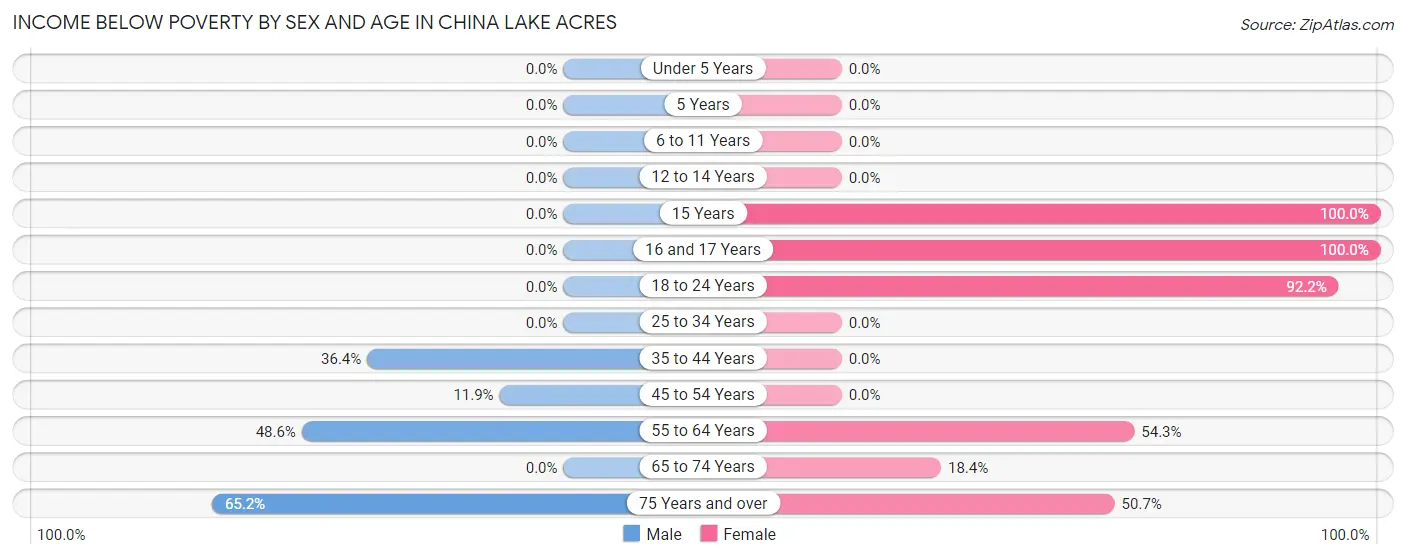
| Age Bracket | Male | Female |
| Under 5 Years | 0 (0.0%) | 0 (0.0%) |
| 5 Years | 0 (0.0%) | 0 (0.0%) |
| 6 to 11 Years | 0 (0.0%) | 0 (0.0%) |
| 12 to 14 Years | 0 (0.0%) | 0 (0.0%) |
| 15 Years | 0 (0.0%) | 50 (100.0%) |
| 16 and 17 Years | 0 (0.0%) | 52 (100.0%) |
| 18 to 24 Years | 0 (0.0%) | 71 (92.2%) |
| 25 to 34 Years | 0 (0.0%) | 0 (0.0%) |
| 35 to 44 Years | 63 (36.4%) | 0 (0.0%) |
| 45 to 54 Years | 14 (11.9%) | 0 (0.0%) |
| 55 to 64 Years | 51 (48.6%) | 107 (54.3%) |
| 65 to 74 Years | 0 (0.0%) | 7 (18.4%) |
| 75 Years and over | 60 (65.2%) | 39 (50.6%) |
| Total | 188 (18.1%) | 326 (29.7%) |
Income Above Poverty by Sex and Age in China Lake Acres
According to the poverty statistics in China Lake Acres, males aged under 5 years and females aged under 5 years are the age groups that are most secure financially, with 100.0% of males and 100.0% of females in these age groups living above the poverty line.
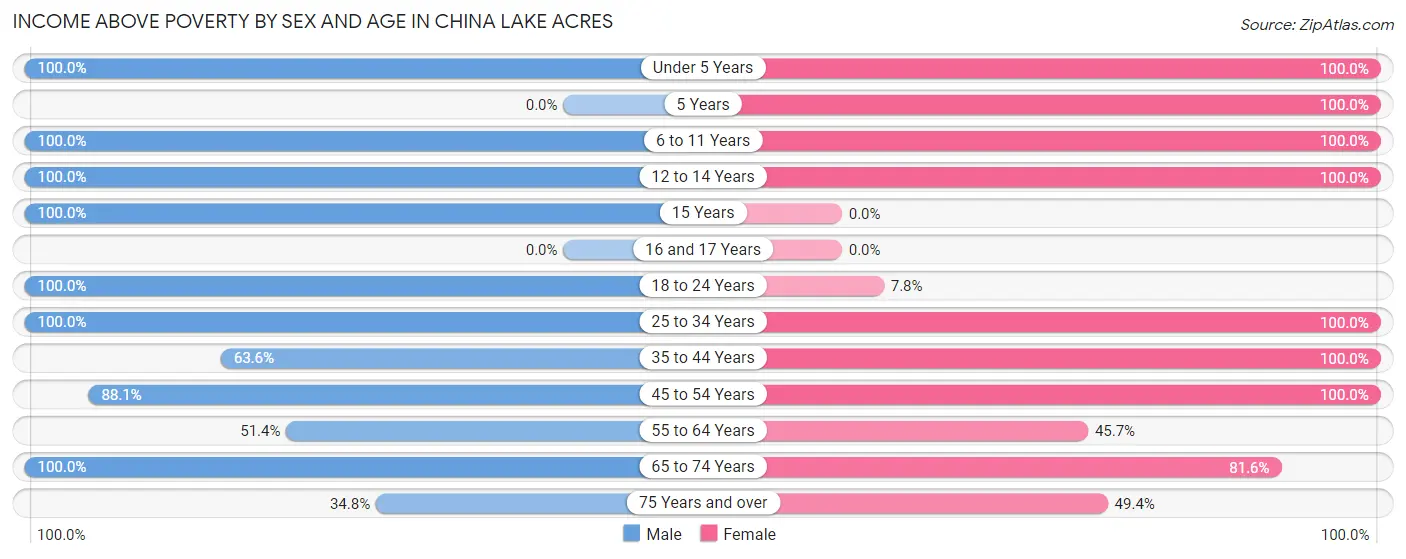
| Age Bracket | Male | Female |
| Under 5 Years | 105 (100.0%) | 78 (100.0%) |
| 5 Years | 0 (0.0%) | 29 (100.0%) |
| 6 to 11 Years | 18 (100.0%) | 63 (100.0%) |
| 12 to 14 Years | 57 (100.0%) | 32 (100.0%) |
| 15 Years | 12 (100.0%) | 0 (0.0%) |
| 16 and 17 Years | 0 (0.0%) | 0 (0.0%) |
| 18 to 24 Years | 108 (100.0%) | 6 (7.8%) |
| 25 to 34 Years | 177 (100.0%) | 129 (100.0%) |
| 35 to 44 Years | 110 (63.6%) | 245 (100.0%) |
| 45 to 54 Years | 104 (88.1%) | 31 (100.0%) |
| 55 to 64 Years | 54 (51.4%) | 90 (45.7%) |
| 65 to 74 Years | 74 (100.0%) | 31 (81.6%) |
| 75 Years and over | 32 (34.8%) | 38 (49.3%) |
| Total | 851 (81.9%) | 772 (70.3%) |
Income Below Poverty Among Married-Couple Families in China Lake Acres
The poverty statistics for married-couple families in China Lake Acres show that 18.6% or 72 of the total 387 families live below the poverty line. Families with 1 or 2 children have the highest poverty rate of 24.4%, comprising of 41 families. On the other hand, families with 3 or 4 children have the lowest poverty rate of 0.0%, which includes 0 families.
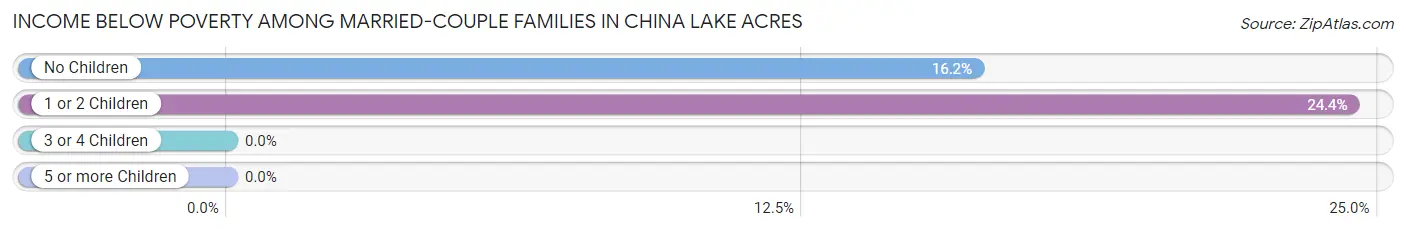
| Children | Above Poverty | Below Poverty |
| No Children | 160 (83.8%) | 31 (16.2%) |
| 1 or 2 Children | 127 (75.6%) | 41 (24.4%) |
| 3 or 4 Children | 28 (100.0%) | 0 (0.0%) |
| 5 or more Children | 0 (0.0%) | 0 (0.0%) |
| Total | 315 (81.4%) | 72 (18.6%) |
Income Below Poverty Among Single-Parent Households in China Lake Acres
| Children | Single Father | Single Mother |
| No Children | 0 (0.0%) | 0 (0.0%) |
| 1 or 2 Children | 0 (0.0%) | 0 (0.0%) |
| 3 or 4 Children | 0 (0.0%) | 0 (0.0%) |
| 5 or more Children | 0 (0.0%) | 0 (0.0%) |
| Total | 0 (0.0%) | 0 (0.0%) |
Income Below Poverty Among Married-Couple vs Single-Parent Households in China Lake Acres
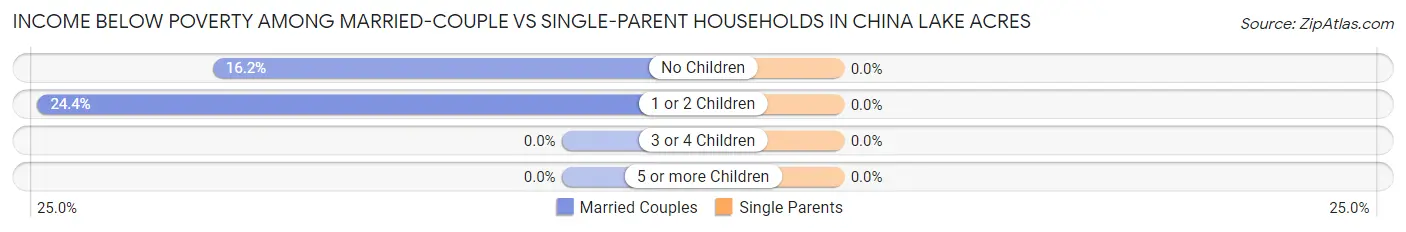
| Children | Married-Couple Families | Single-Parent Households |
| No Children | 31 (16.2%) | 0 (0.0%) |
| 1 or 2 Children | 41 (24.4%) | 0 (0.0%) |
| 3 or 4 Children | 0 (0.0%) | 0 (0.0%) |
| 5 or more Children | 0 (0.0%) | 0 (0.0%) |
| Total | 72 (18.6%) | 0 (0.0%) |
Race in China Lake Acres
The most populous races in China Lake Acres are White / Caucasian (1,461 | 61.3%), Two or more Races (436 | 18.3%), and Hispanic or Latino (347 | 14.5%).
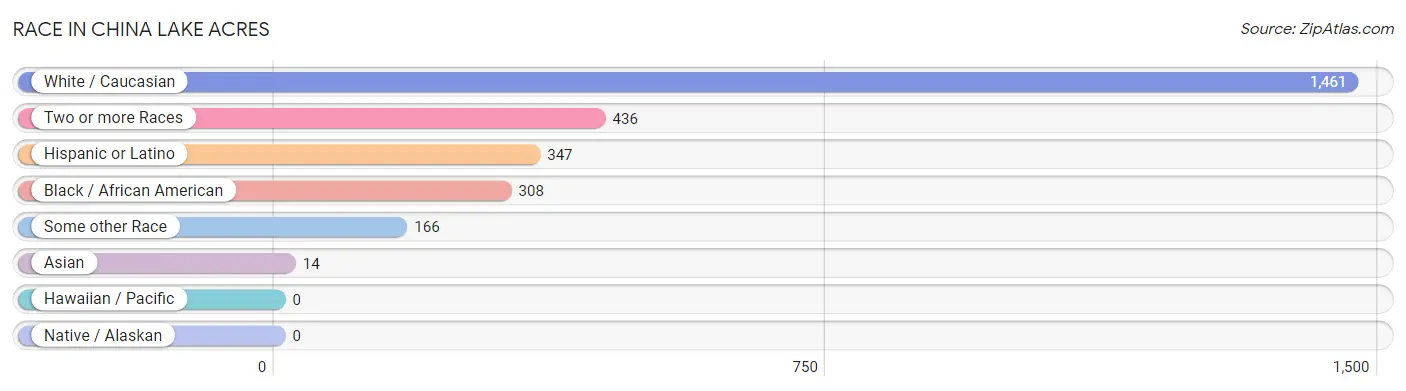
| Race | # Population | % Population |
| Asian | 14 | 0.6% |
| Black / African American | 308 | 12.9% |
| Hawaiian / Pacific | 0 | 0.0% |
| Hispanic or Latino | 347 | 14.5% |
| Native / Alaskan | 0 | 0.0% |
| White / Caucasian | 1,461 | 61.3% |
| Two or more Races | 436 | 18.3% |
| Some other Race | 166 | 7.0% |
| Total | 2,385 | 100.0% |
Ancestry in China Lake Acres
The most populous ancestries reported in China Lake Acres are Irish (764 | 32.0%), German (747 | 31.3%), Mexican (326 | 13.7%), Italian (192 | 8.1%), and Choctaw (107 | 4.5%), together accounting for 89.6% of all China Lake Acres residents.
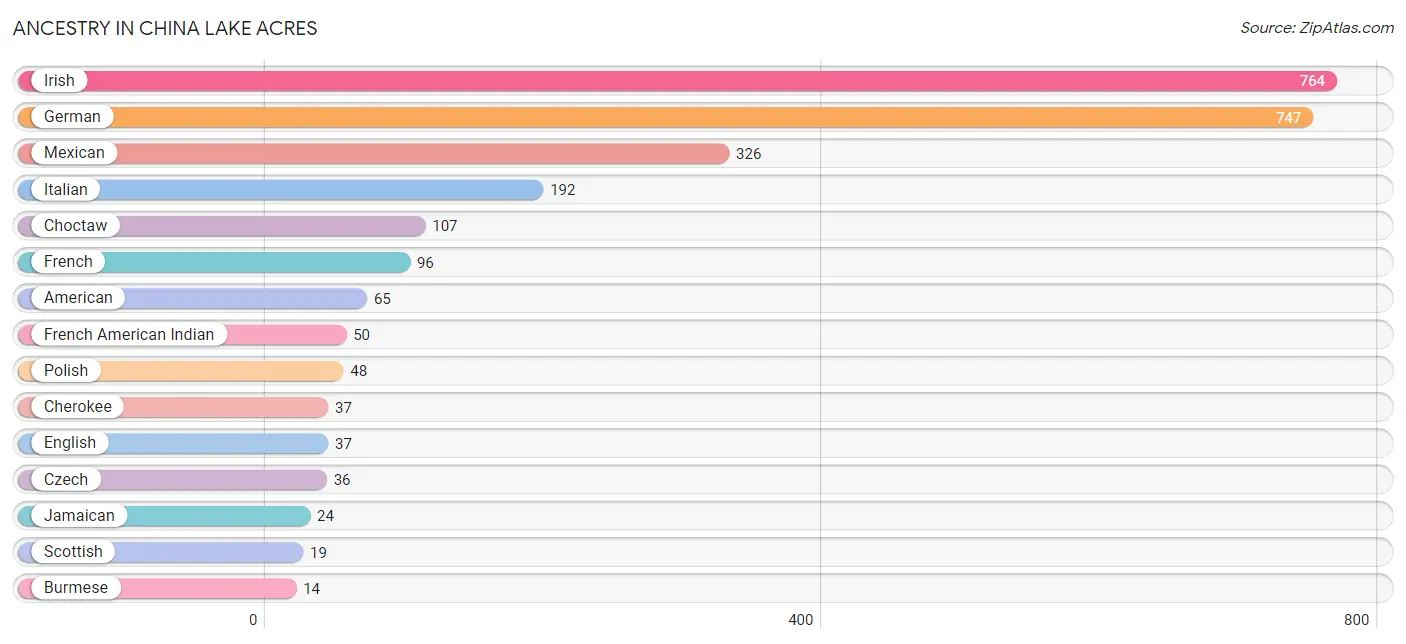
| Ancestry | # Population | % Population |
| American | 65 | 2.7% |
| Burmese | 14 | 0.6% |
| Cherokee | 37 | 1.5% |
| Choctaw | 107 | 4.5% |
| Czech | 36 | 1.5% |
| Danish | 9 | 0.4% |
| English | 37 | 1.5% |
| French | 96 | 4.0% |
| French American Indian | 50 | 2.1% |
| German | 747 | 31.3% |
| Irish | 764 | 32.0% |
| Italian | 192 | 8.1% |
| Jamaican | 24 | 1.0% |
| Mexican | 326 | 13.7% |
| Native Hawaiian | 9 | 0.4% |
| Norwegian | 14 | 0.6% |
| Polish | 48 | 2.0% |
| Puerto Rican | 7 | 0.3% |
| Samoan | 12 | 0.5% |
| Scotch-Irish | 10 | 0.4% |
| Scottish | 19 | 0.8% |
| Spaniard | 14 | 0.6% |
| Swedish | 12 | 0.5% |
| Welsh | 10 | 0.4% | View All 24 Rows |
Immigrants in China Lake Acres
The most numerous immigrant groups reported in China Lake Acres came from Central America (73 | 3.1%), Latin America (73 | 3.1%), Mexico (73 | 3.1%), Asia (14 | 0.6%), and Eastern Asia (14 | 0.6%), together accounting for 10.4% of all China Lake Acres residents.
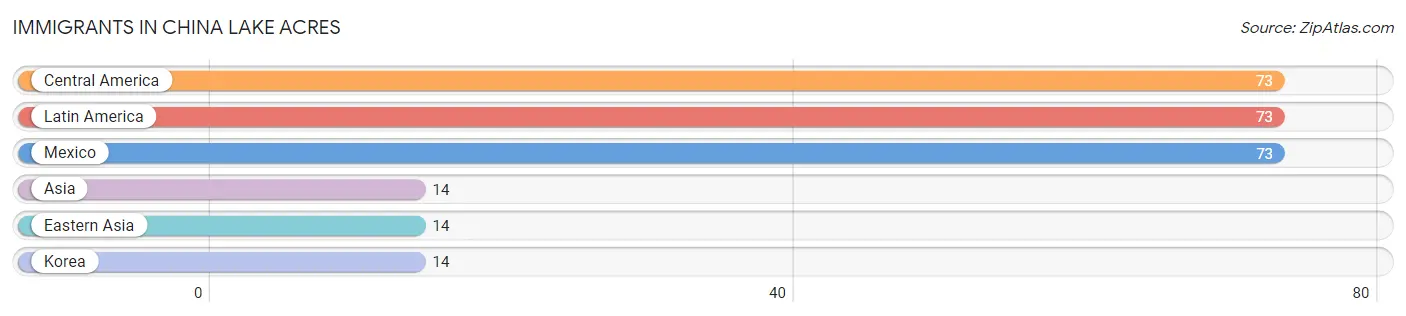
| Immigration Origin | # Population | % Population |
| Asia | 14 | 0.6% |
| Central America | 73 | 3.1% |
| Eastern Asia | 14 | 0.6% |
| Korea | 14 | 0.6% |
| Latin America | 73 | 3.1% |
| Mexico | 73 | 3.1% | View All 6 Rows |
Sex and Age in China Lake Acres
Sex and Age in China Lake Acres
The most populous age groups in China Lake Acres are 30 to 34 Years (158 | 15.2%) for men and Under 5 Years (326 | 24.2%) for women.
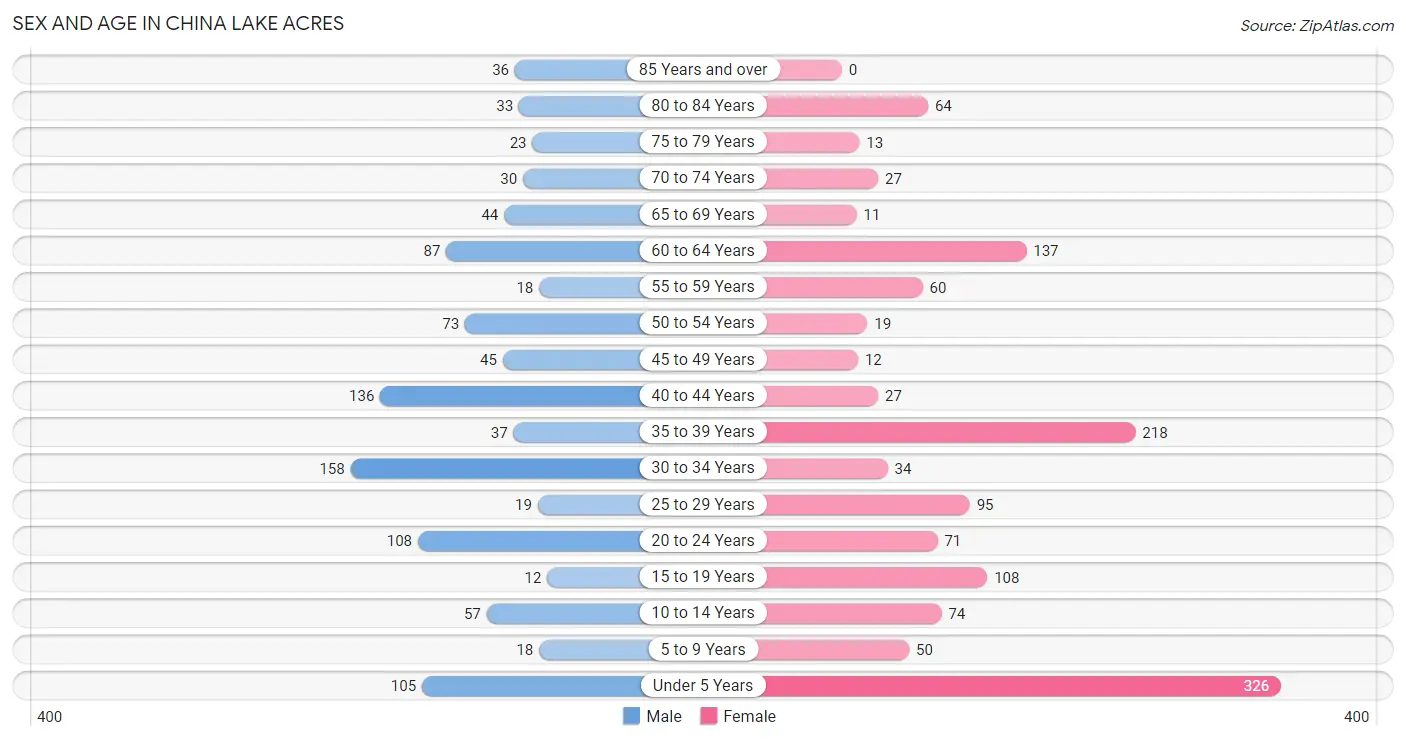
| Age Bracket | Male | Female |
| Under 5 Years | 105 (10.1%) | 326 (24.2%) |
| 5 to 9 Years | 18 (1.7%) | 50 (3.7%) |
| 10 to 14 Years | 57 (5.5%) | 74 (5.5%) |
| 15 to 19 Years | 12 (1.1%) | 108 (8.0%) |
| 20 to 24 Years | 108 (10.4%) | 71 (5.3%) |
| 25 to 29 Years | 19 (1.8%) | 95 (7.1%) |
| 30 to 34 Years | 158 (15.2%) | 34 (2.5%) |
| 35 to 39 Years | 37 (3.6%) | 218 (16.2%) |
| 40 to 44 Years | 136 (13.1%) | 27 (2.0%) |
| 45 to 49 Years | 45 (4.3%) | 12 (0.9%) |
| 50 to 54 Years | 73 (7.0%) | 19 (1.4%) |
| 55 to 59 Years | 18 (1.7%) | 60 (4.5%) |
| 60 to 64 Years | 87 (8.4%) | 137 (10.2%) |
| 65 to 69 Years | 44 (4.2%) | 11 (0.8%) |
| 70 to 74 Years | 30 (2.9%) | 27 (2.0%) |
| 75 to 79 Years | 23 (2.2%) | 13 (1.0%) |
| 80 to 84 Years | 33 (3.2%) | 64 (4.8%) |
| 85 Years and over | 36 (3.5%) | 0 (0.0%) |
| Total | 1,039 (100.0%) | 1,346 (100.0%) |
Families and Households in China Lake Acres
Median Family Size in China Lake Acres
The median family size in China Lake Acres is 3.10 persons per family, with married-couple families (387 | 68.7%) accounting for the largest median family size of 3.45 persons per family. On the other hand, single male/father families (94 | 16.7%) represent the smallest median family size with 2.00 persons per family.
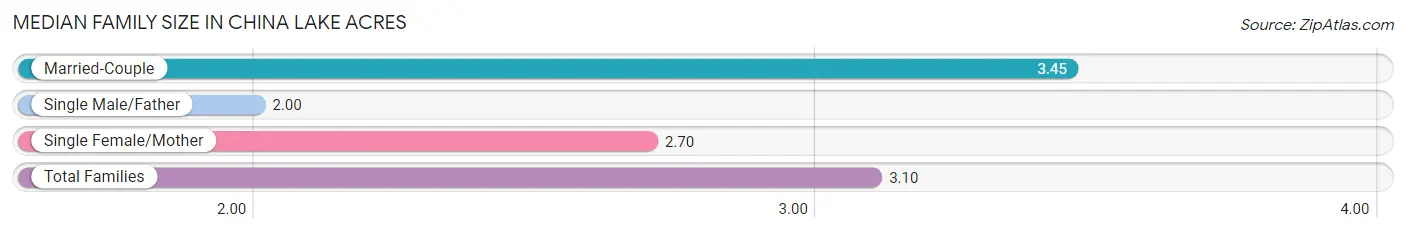
| Family Type | # Families | Family Size |
| Married-Couple | 387 (68.7%) | 3.45 |
| Single Male/Father | 94 (16.7%) | 2.00 |
| Single Female/Mother | 82 (14.6%) | 2.70 |
| Total Families | 563 (100.0%) | 3.10 |
Median Household Size in China Lake Acres
The median household size in China Lake Acres is 2.91 persons per household, with single male/father households (94 | 11.5%) accounting for the largest median household size of 5.77 persons per household. non-family households (257 | 31.3%) represent the smallest median household size with 1.07 persons per household.

| Household Type | # Households | Household Size |
| Married-Couple | 387 (47.2%) | 3.45 |
| Single Male/Father | 94 (11.5%) | 5.77 |
| Single Female/Mother | 82 (10.0%) | 2.84 |
| Non-family | 257 (31.3%) | 1.07 |
| Total Households | 820 (100.0%) | 2.91 |
Household Size by Marriage Status in China Lake Acres
Out of a total of 820 households in China Lake Acres, 563 (68.7%) are family households, while 257 (31.3%) are nonfamily households. The most numerous type of family households are 3-person households, comprising 190, and the most common type of nonfamily households are 1-person households, comprising 242.
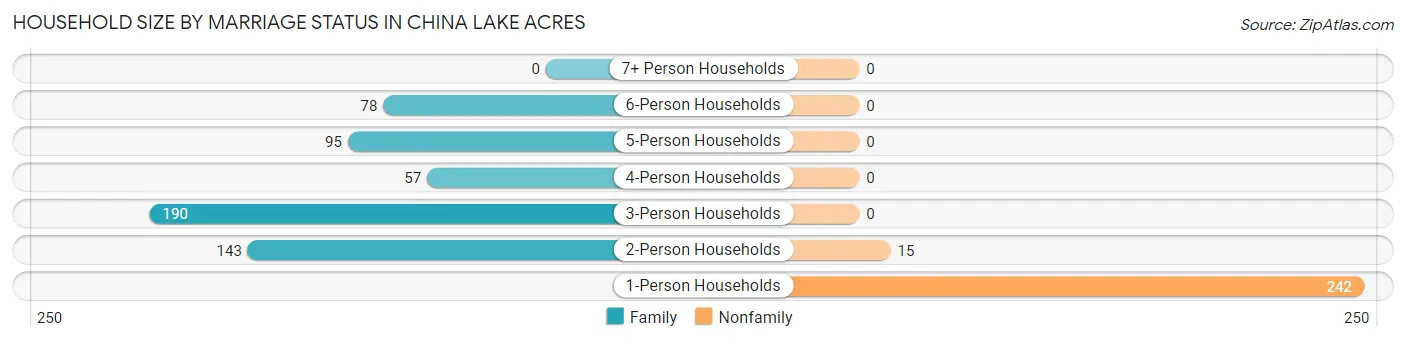
| Household Size | Family Households | Nonfamily Households |
| 1-Person Households | - | 242 (29.5%) |
| 2-Person Households | 143 (17.4%) | 15 (1.8%) |
| 3-Person Households | 190 (23.2%) | 0 (0.0%) |
| 4-Person Households | 57 (7.0%) | 0 (0.0%) |
| 5-Person Households | 95 (11.6%) | 0 (0.0%) |
| 6-Person Households | 78 (9.5%) | 0 (0.0%) |
| 7+ Person Households | 0 (0.0%) | 0 (0.0%) |
| Total | 563 (68.7%) | 257 (31.3%) |
Female Fertility in China Lake Acres
Fertility by Age in China Lake Acres
Average fertility rate in China Lake Acres is 141.0 births per 1,000 women. Women in the age bracket of 20 to 34 years have the highest fertility rate with 405.0 births per 1,000 women. Women in the age bracket of 20 to 34 years acount for 100.0% of all women with births.
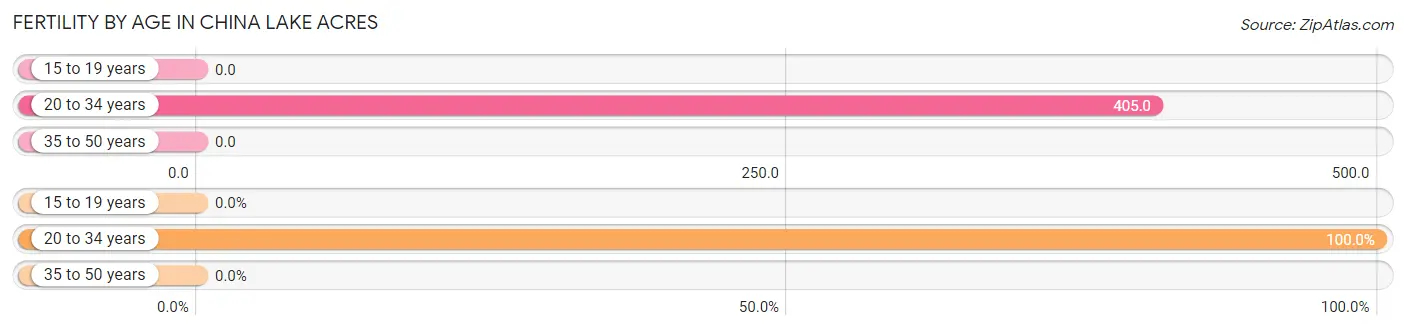
| Age Bracket | Women with Births | Births / 1,000 Women |
| 15 to 19 years | 0 (0.0%) | 0.0 |
| 20 to 34 years | 81 (100.0%) | 405.0 |
| 35 to 50 years | 0 (0.0%) | 0.0 |
| Total | 81 (100.0%) | 141.0 |
Fertility by Age by Marriage Status in China Lake Acres
12.3% of women with births (81) in China Lake Acres are married. The highest percentage of unmarried women with births falls into 20 to 34 years age bracket with 87.6% of them unmarried at the time of birth, while the lowest percentage of unmarried women with births belong to 20 to 34 years age bracket with 87.7% of them unmarried.
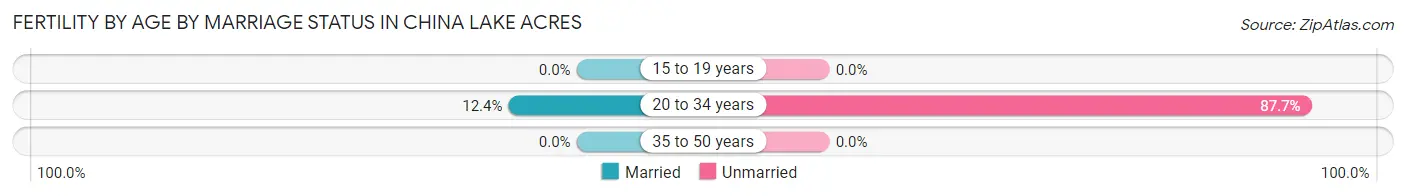
| Age Bracket | Married | Unmarried |
| 15 to 19 years | 0 (0.0%) | 0 (0.0%) |
| 20 to 34 years | 10 (12.3%) | 71 (87.6%) |
| 35 to 50 years | 0 (0.0%) | 0 (0.0%) |
| Total | 10 (12.3%) | 71 (87.6%) |
Fertility by Education in China Lake Acres
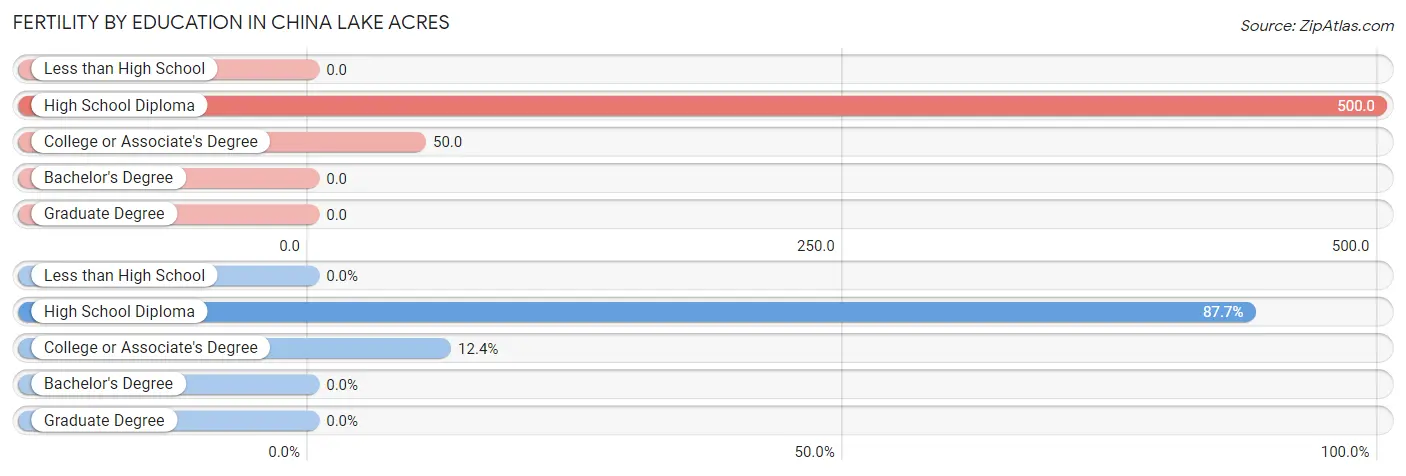
| Educational Attainment | Women with Births | Births / 1,000 Women |
| Less than High School | 0 (0.0%) | 0.0 |
| High School Diploma | 71 (87.6%) | 500.0 |
| College or Associate's Degree | 10 (12.3%) | 50.0 |
| Bachelor's Degree | 0 (0.0%) | 0.0 |
| Graduate Degree | 0 (0.0%) | 0.0 |
| Total | 81 (100.0%) | 141.0 |
Fertility by Education by Marriage Status in China Lake Acres
87.6% of women with births in China Lake Acres are unmarried. Women with the educational attainment of college or associate's degree are most likely to be married with 100.0% of them married at childbirth, while women with the educational attainment of high school diploma are least likely to be married with 100.0% of them unmarried at childbirth.
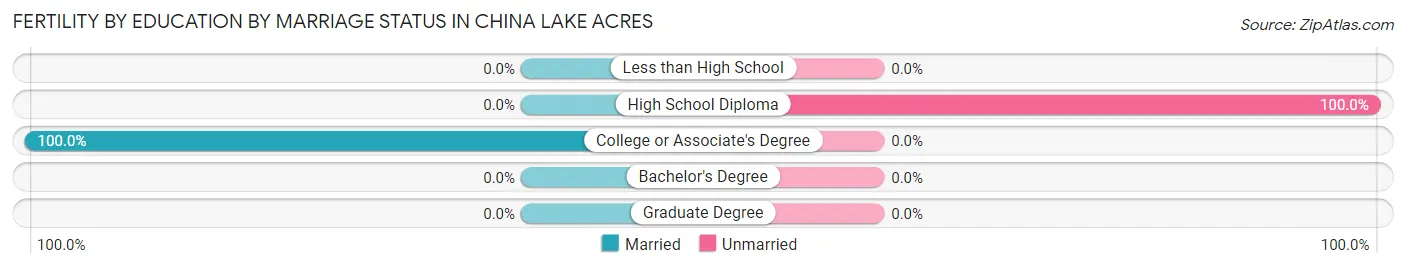
| Educational Attainment | Married | Unmarried |
| Less than High School | 0 (0.0%) | 0 (0.0%) |
| High School Diploma | 0 (0.0%) | 71 (100.0%) |
| College or Associate's Degree | 10 (100.0%) | 0 (0.0%) |
| Bachelor's Degree | 0 (0.0%) | 0 (0.0%) |
| Graduate Degree | 0 (0.0%) | 0 (0.0%) |
| Total | 10 (12.3%) | 71 (87.6%) |
Employment Characteristics in China Lake Acres
Employment by Class of Employer in China Lake Acres
Among the 1,005 employed individuals in China Lake Acres, private company employees (647 | 64.4%), federal government employees (174 | 17.3%), and self-employed (not incorporated) (78 | 7.8%) make up the most common classes of employment.
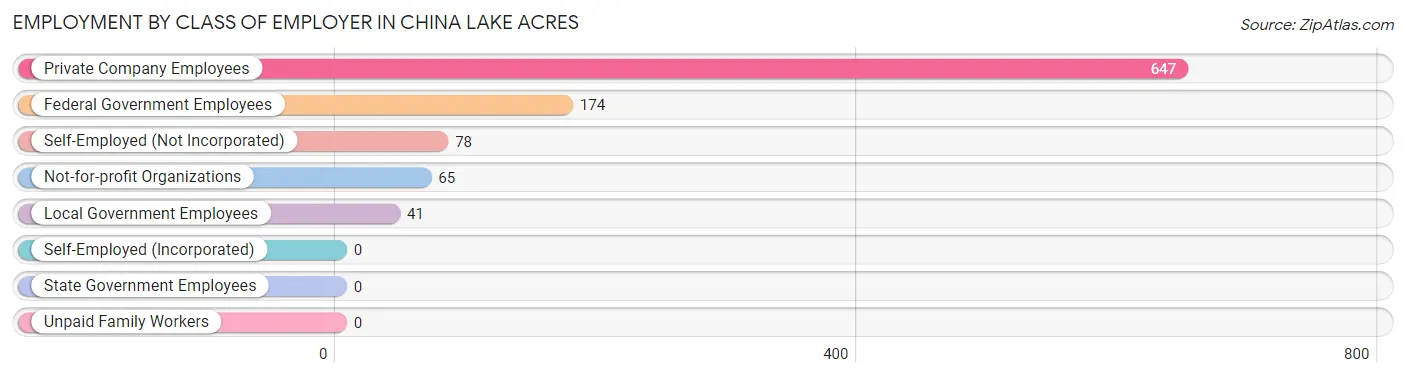
| Employer Class | # Employees | % Employees |
| Private Company Employees | 647 | 64.4% |
| Self-Employed (Incorporated) | 0 | 0.0% |
| Self-Employed (Not Incorporated) | 78 | 7.8% |
| Not-for-profit Organizations | 65 | 6.5% |
| Local Government Employees | 41 | 4.1% |
| State Government Employees | 0 | 0.0% |
| Federal Government Employees | 174 | 17.3% |
| Unpaid Family Workers | 0 | 0.0% |
| Total | 1,005 | 100.0% |
Employment Status by Age in China Lake Acres
According to the labor force statistics for China Lake Acres, out of the total population over 16 years of age (1,693), 63.7% or 1,078 individuals are in the labor force, with 6.8% or 73 of them unemployed. The age group with the highest labor force participation rate is 25 to 29 years, with 100.0% or 114 individuals in the labor force. Within the labor force, the 45 to 54 years age range has the highest percentage of unemployed individuals, with 49.0% or 73 of them being unemployed.
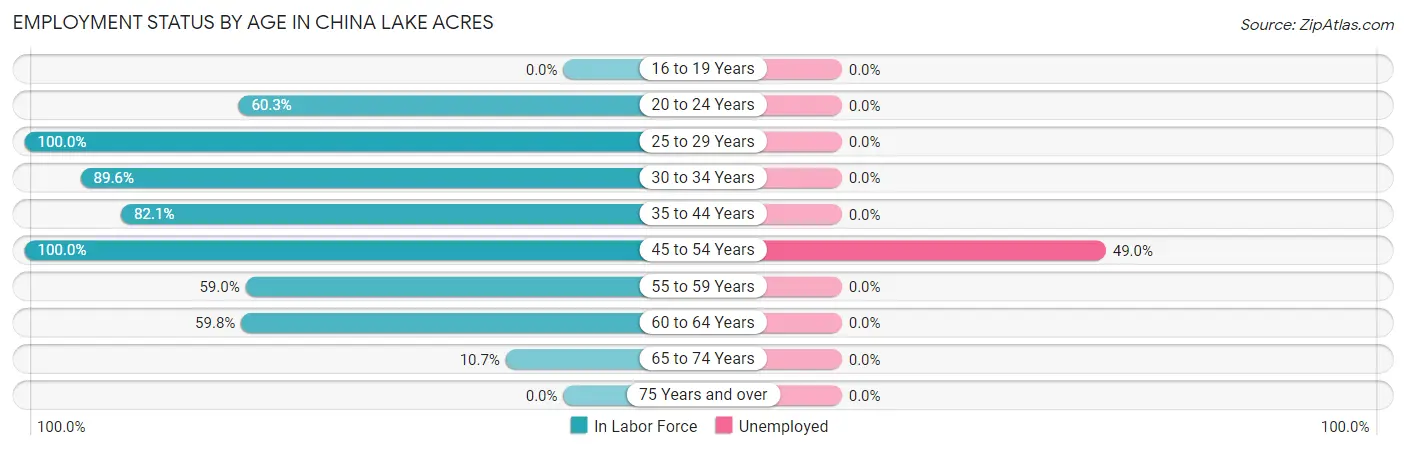
| Age Bracket | In Labor Force | Unemployed |
| 16 to 19 Years | 0 (0.0%) | 0 (0.0%) |
| 20 to 24 Years | 108 (60.3%) | 0 (0.0%) |
| 25 to 29 Years | 114 (100.0%) | 0 (0.0%) |
| 30 to 34 Years | 172 (89.6%) | 0 (0.0%) |
| 35 to 44 Years | 343 (82.1%) | 0 (0.0%) |
| 45 to 54 Years | 149 (100.0%) | 73 (49.0%) |
| 55 to 59 Years | 46 (59.0%) | 0 (0.0%) |
| 60 to 64 Years | 134 (59.8%) | 0 (0.0%) |
| 65 to 74 Years | 12 (10.7%) | 0 (0.0%) |
| 75 Years and over | 0 (0.0%) | 0 (0.0%) |
| Total | 1,078 (63.7%) | 73 (6.8%) |
Employment Status by Educational Attainment in China Lake Acres
According to labor force statistics for China Lake Acres, 81.5% of individuals (958) out of the total population between 25 and 64 years of age (1,175) are in the labor force, with 7.6% or 73 of them being unemployed. The group with the highest labor force participation rate are those with the educational attainment of high school diploma, with 100.0% or 284 individuals in the labor force. Within the labor force, individuals with high school diploma education have the highest percentage of unemployment, with 25.7% or 73 of them being unemployed.
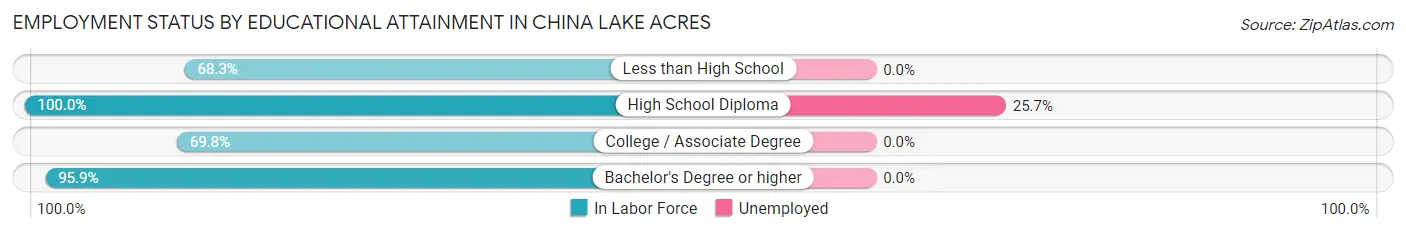
| Educational Attainment | In Labor Force | Unemployed |
| Less than High School | 205 (68.3%) | 0 (0.0%) |
| High School Diploma | 284 (100.0%) | 73 (25.7%) |
| College / Associate Degree | 261 (69.8%) | 0 (0.0%) |
| Bachelor's Degree or higher | 208 (95.9%) | 0 (0.0%) |
| Total | 958 (81.5%) | 89 (7.6%) |
Employment Occupations by Sex in China Lake Acres
Management, Business, Science and Arts Occupations
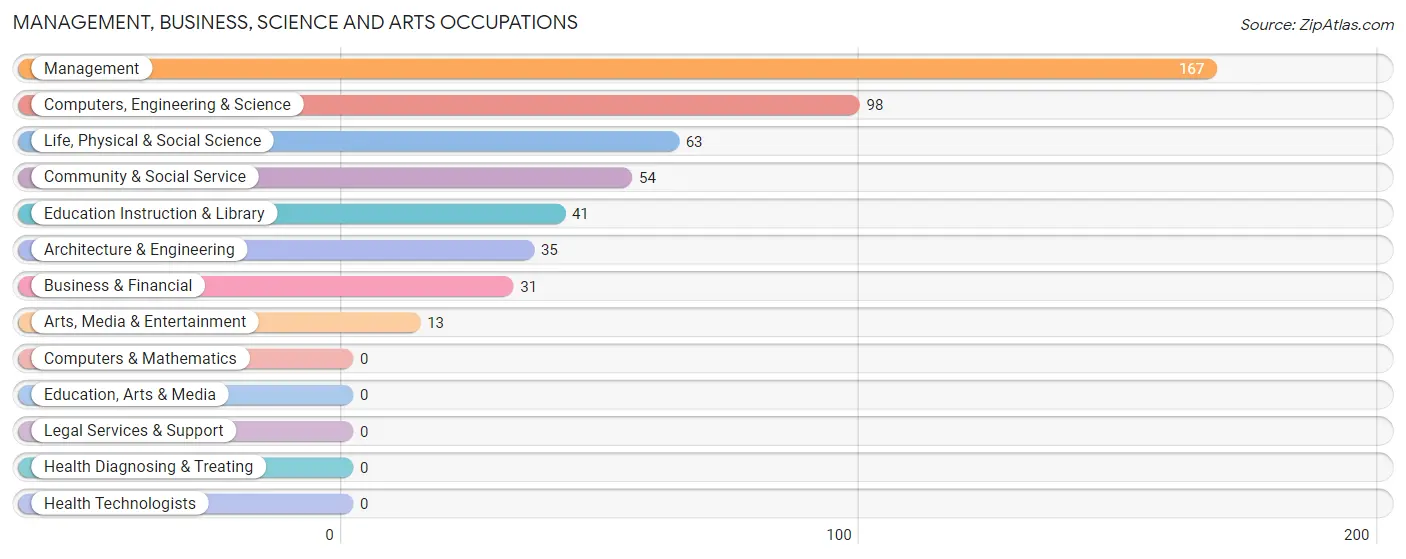
The most common Management, Business, Science and Arts occupations in China Lake Acres are Management (167 | 16.6%), Computers, Engineering & Science (98 | 9.8%), Life, Physical & Social Science (63 | 6.3%), Community & Social Service (54 | 5.4%), and Education Instruction & Library (41 | 4.1%).
Management, Business, Science and Arts Occupations by Sex
Within the Management, Business, Science and Arts occupations in China Lake Acres, the most male-oriented occupations are Life, Physical & Social Science (100.0%), Arts, Media & Entertainment (100.0%), and Computers, Engineering & Science (85.7%), while the most female-oriented occupations are Education Instruction & Library (100.0%), Community & Social Service (75.9%), and Business & Financial (61.3%).
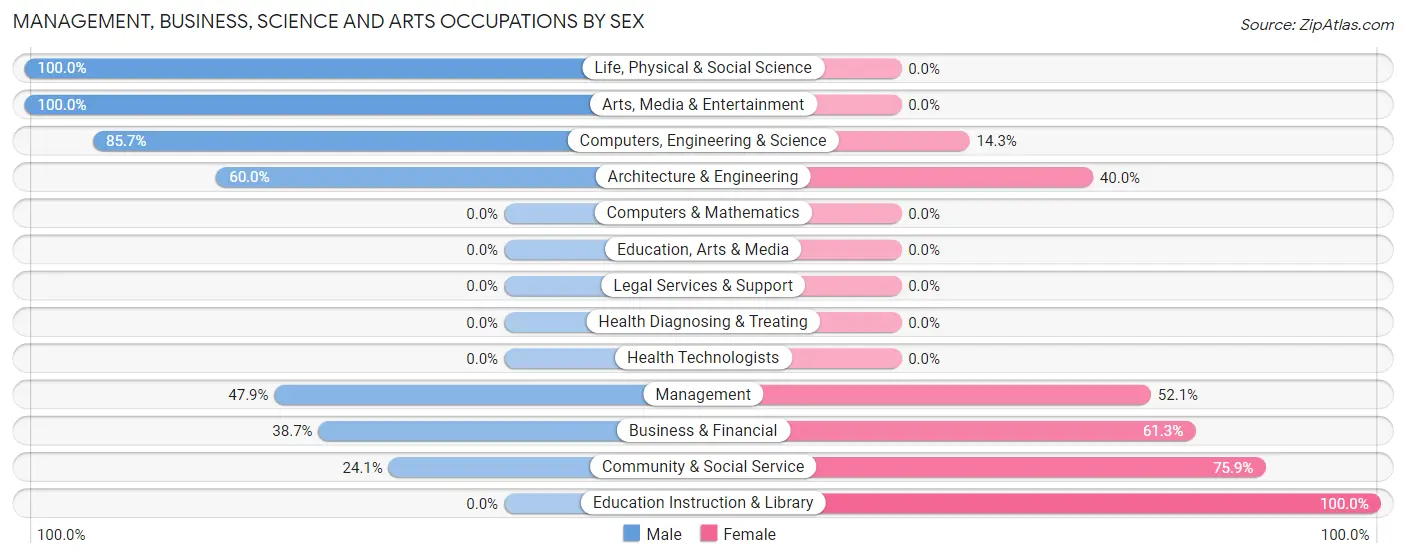
| Occupation | Male | Female |
| Management | 80 (47.9%) | 87 (52.1%) |
| Business & Financial | 12 (38.7%) | 19 (61.3%) |
| Computers, Engineering & Science | 84 (85.7%) | 14 (14.3%) |
| Computers & Mathematics | 0 (0.0%) | 0 (0.0%) |
| Architecture & Engineering | 21 (60.0%) | 14 (40.0%) |
| Life, Physical & Social Science | 63 (100.0%) | 0 (0.0%) |
| Community & Social Service | 13 (24.1%) | 41 (75.9%) |
| Education, Arts & Media | 0 (0.0%) | 0 (0.0%) |
| Legal Services & Support | 0 (0.0%) | 0 (0.0%) |
| Education Instruction & Library | 0 (0.0%) | 41 (100.0%) |
| Arts, Media & Entertainment | 13 (100.0%) | 0 (0.0%) |
| Health Diagnosing & Treating | 0 (0.0%) | 0 (0.0%) |
| Health Technologists | 0 (0.0%) | 0 (0.0%) |
| Total (Category) | 189 (54.0%) | 161 (46.0%) |
| Total (Overall) | 495 (49.2%) | 510 (50.7%) |
Services Occupations
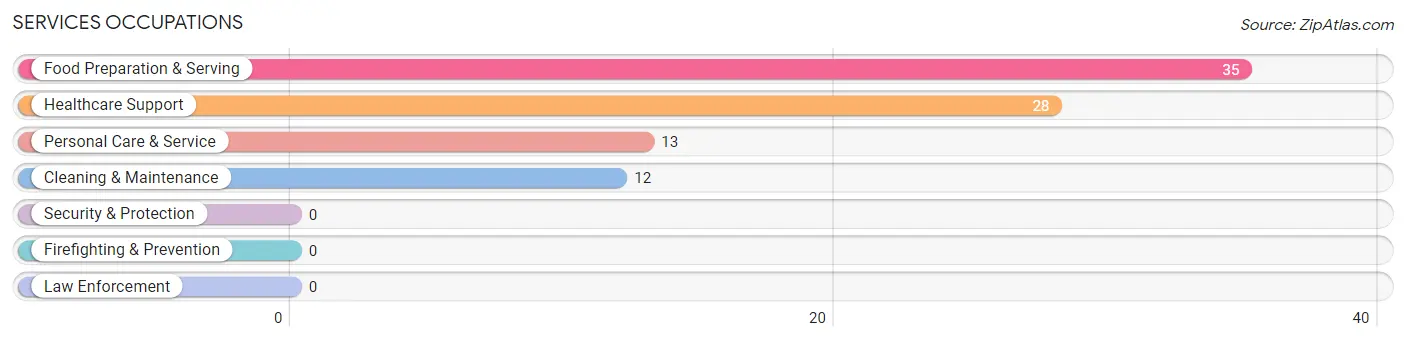
The most common Services occupations in China Lake Acres are Food Preparation & Serving (35 | 3.5%), Healthcare Support (28 | 2.8%), Personal Care & Service (13 | 1.3%), and Cleaning & Maintenance (12 | 1.2%).
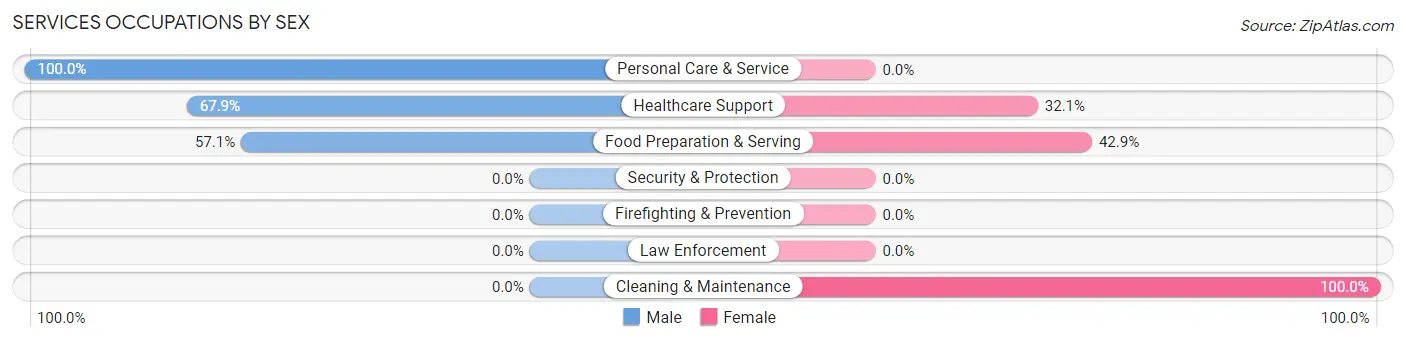
Services Occupations by Sex
Within the Services occupations in China Lake Acres, the most male-oriented occupations are Personal Care & Service (100.0%), Healthcare Support (67.9%), and Food Preparation & Serving (57.1%), while the most female-oriented occupations are Cleaning & Maintenance (100.0%), Food Preparation & Serving (42.9%), and Healthcare Support (32.1%).
| Occupation | Male | Female |
| Healthcare Support | 19 (67.9%) | 9 (32.1%) |
| Security & Protection | 0 (0.0%) | 0 (0.0%) |
| Firefighting & Prevention | 0 (0.0%) | 0 (0.0%) |
| Law Enforcement | 0 (0.0%) | 0 (0.0%) |
| Food Preparation & Serving | 20 (57.1%) | 15 (42.9%) |
| Cleaning & Maintenance | 0 (0.0%) | 12 (100.0%) |
| Personal Care & Service | 13 (100.0%) | 0 (0.0%) |
| Total (Category) | 52 (59.1%) | 36 (40.9%) |
| Total (Overall) | 495 (49.2%) | 510 (50.7%) |
Sales and Office Occupations
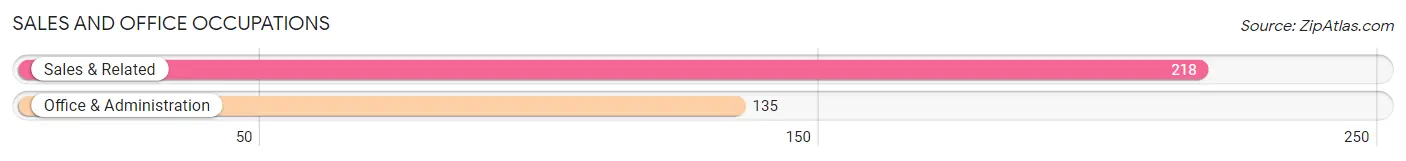
The most common Sales and Office occupations in China Lake Acres are Sales & Related (218 | 21.7%), and Office & Administration (135 | 13.4%).
Sales and Office Occupations by Sex

| Occupation | Male | Female |
| Sales & Related | 40 (18.3%) | 178 (81.7%) |
| Office & Administration | 0 (0.0%) | 135 (100.0%) |
| Total (Category) | 40 (11.3%) | 313 (88.7%) |
| Total (Overall) | 495 (49.2%) | 510 (50.7%) |
Natural Resources, Construction and Maintenance Occupations
The most common Natural Resources, Construction and Maintenance occupations in China Lake Acres are Construction & Extraction (41 | 4.1%), and Installation, Maintenance & Repair (37 | 3.7%).
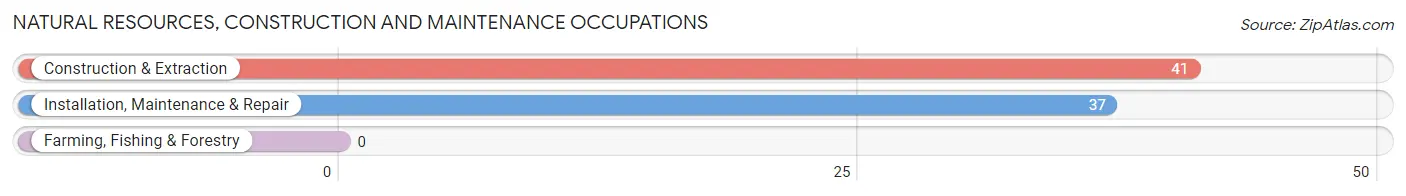
Natural Resources, Construction and Maintenance Occupations by Sex
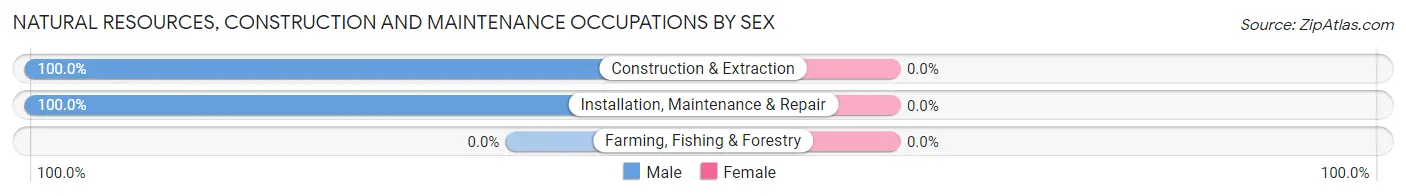
| Occupation | Male | Female |
| Farming, Fishing & Forestry | 0 (0.0%) | 0 (0.0%) |
| Construction & Extraction | 41 (100.0%) | 0 (0.0%) |
| Installation, Maintenance & Repair | 37 (100.0%) | 0 (0.0%) |
| Total (Category) | 78 (100.0%) | 0 (0.0%) |
| Total (Overall) | 495 (49.2%) | 510 (50.7%) |
Production, Transportation and Moving Occupations
The most common Production, Transportation and Moving occupations in China Lake Acres are Transportation (107 | 10.6%), and Production (29 | 2.9%).
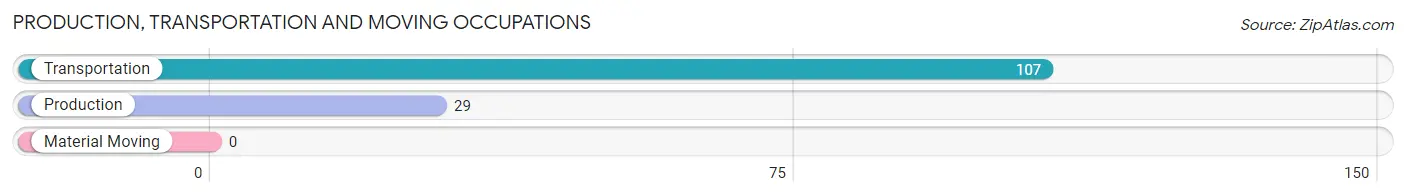
Production, Transportation and Moving Occupations by Sex
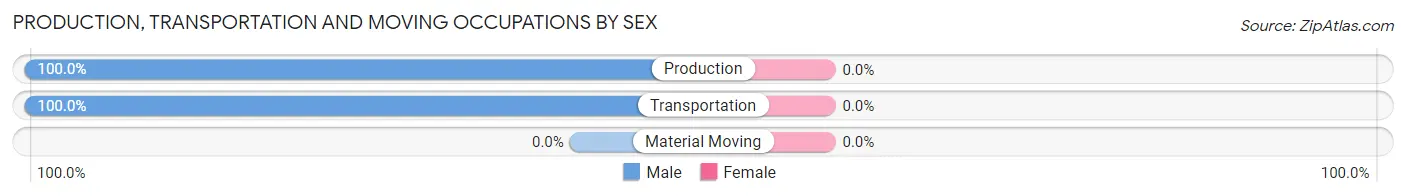
| Occupation | Male | Female |
| Production | 29 (100.0%) | 0 (0.0%) |
| Transportation | 107 (100.0%) | 0 (0.0%) |
| Material Moving | 0 (0.0%) | 0 (0.0%) |
| Total (Category) | 136 (100.0%) | 0 (0.0%) |
| Total (Overall) | 495 (49.2%) | 510 (50.7%) |
Employment Industries by Sex in China Lake Acres
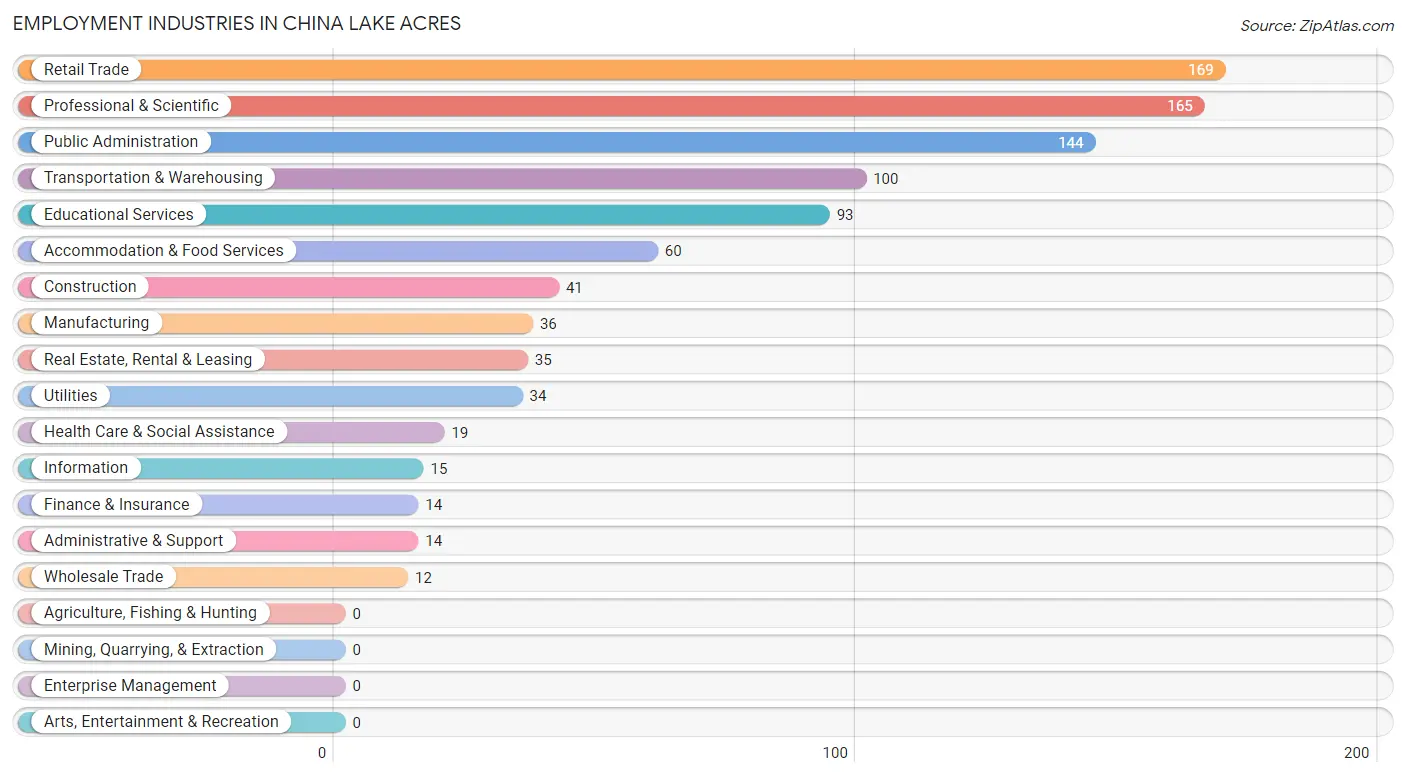
Employment Industries in China Lake Acres
The major employment industries in China Lake Acres include Retail Trade (169 | 16.8%), Professional & Scientific (165 | 16.4%), Public Administration (144 | 14.3%), Transportation & Warehousing (100 | 10.0%), and Educational Services (93 | 9.2%).
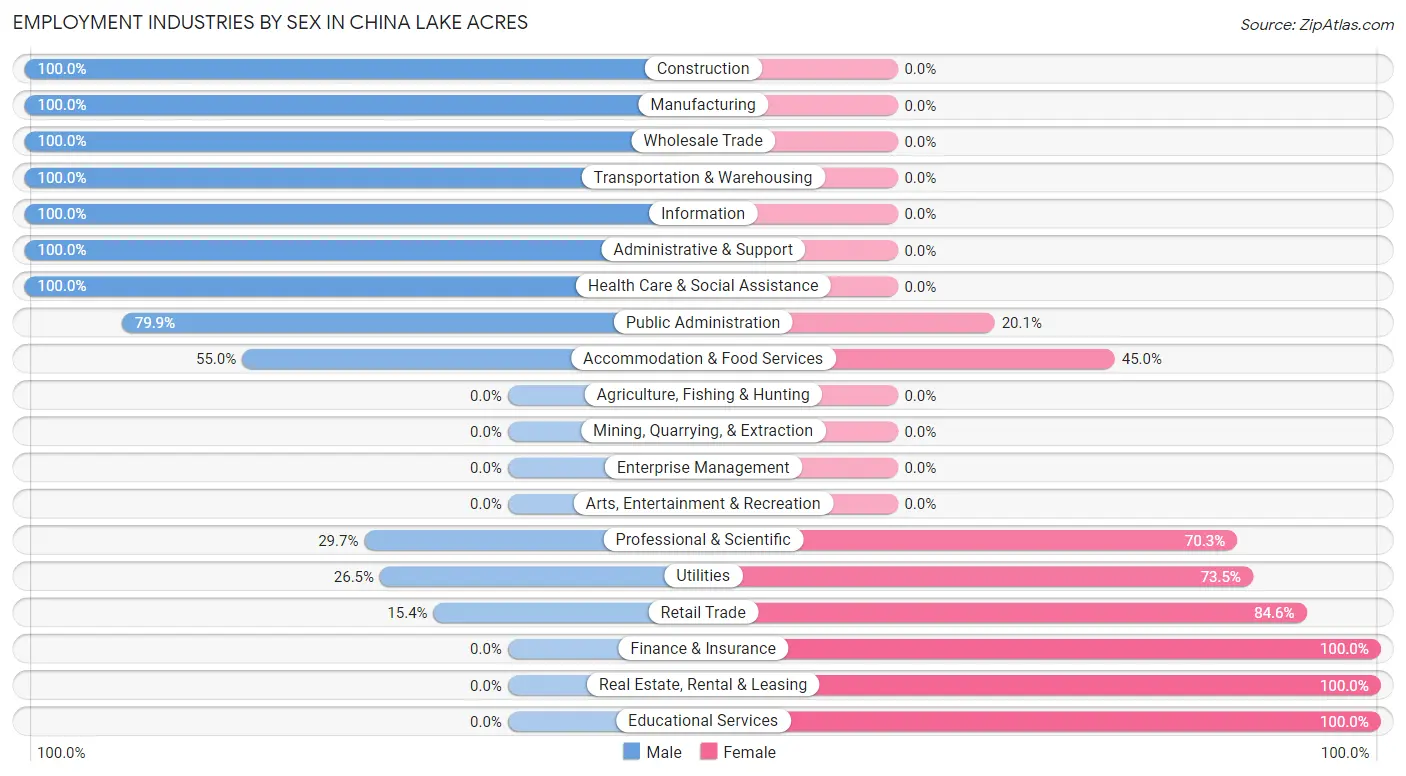
Employment Industries by Sex in China Lake Acres
The China Lake Acres industries that see more men than women are Construction (100.0%), Manufacturing (100.0%), and Wholesale Trade (100.0%), whereas the industries that tend to have a higher number of women are Finance & Insurance (100.0%), Real Estate, Rental & Leasing (100.0%), and Educational Services (100.0%).
| Industry | Male | Female |
| Agriculture, Fishing & Hunting | 0 (0.0%) | 0 (0.0%) |
| Mining, Quarrying, & Extraction | 0 (0.0%) | 0 (0.0%) |
| Construction | 41 (100.0%) | 0 (0.0%) |
| Manufacturing | 36 (100.0%) | 0 (0.0%) |
| Wholesale Trade | 12 (100.0%) | 0 (0.0%) |
| Retail Trade | 26 (15.4%) | 143 (84.6%) |
| Transportation & Warehousing | 100 (100.0%) | 0 (0.0%) |
| Utilities | 9 (26.5%) | 25 (73.5%) |
| Information | 15 (100.0%) | 0 (0.0%) |
| Finance & Insurance | 0 (0.0%) | 14 (100.0%) |
| Real Estate, Rental & Leasing | 0 (0.0%) | 35 (100.0%) |
| Professional & Scientific | 49 (29.7%) | 116 (70.3%) |
| Enterprise Management | 0 (0.0%) | 0 (0.0%) |
| Administrative & Support | 14 (100.0%) | 0 (0.0%) |
| Educational Services | 0 (0.0%) | 93 (100.0%) |
| Health Care & Social Assistance | 19 (100.0%) | 0 (0.0%) |
| Arts, Entertainment & Recreation | 0 (0.0%) | 0 (0.0%) |
| Accommodation & Food Services | 33 (55.0%) | 27 (45.0%) |
| Public Administration | 115 (79.9%) | 29 (20.1%) |
| Total | 495 (49.2%) | 510 (50.7%) |
Education in China Lake Acres
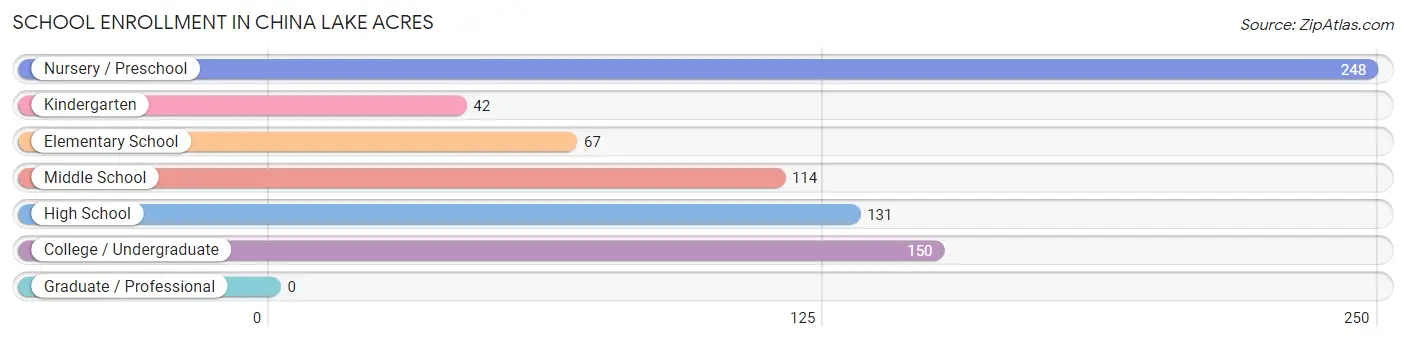
School Enrollment in China Lake Acres
The most common levels of schooling among the 752 students in China Lake Acres are nursery / preschool (248 | 33.0%), college / undergraduate (150 | 20.0%), and high school (131 | 17.4%).
| School Level | # Students | % Students |
| Nursery / Preschool | 248 | 33.0% |
| Kindergarten | 42 | 5.6% |
| Elementary School | 67 | 8.9% |
| Middle School | 114 | 15.2% |
| High School | 131 | 17.4% |
| College / Undergraduate | 150 | 20.0% |
| Graduate / Professional | 0 | 0.0% |
| Total | 752 | 100.0% |
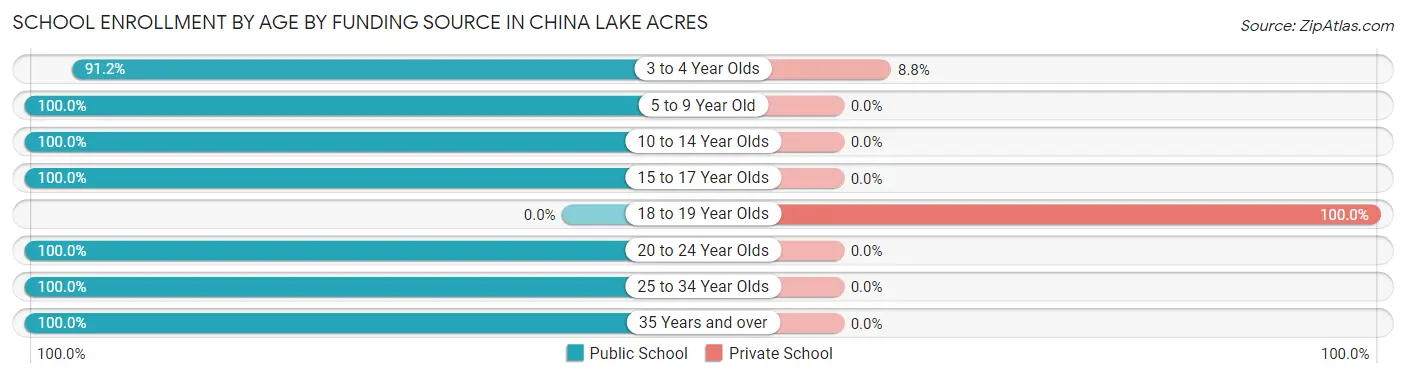
School Enrollment by Age by Funding Source in China Lake Acres
Out of a total of 752 students who are enrolled in schools in China Lake Acres, 30 (4.0%) attend a private institution, while the remaining 722 (96.0%) are enrolled in public schools. The age group of 18 to 19 year olds has the highest likelihood of being enrolled in private schools, with 6 (100.0% in the age bracket) enrolled. Conversely, the age group of 5 to 9 year old has the lowest likelihood of being enrolled in a private school, with 68 (100.0% in the age bracket) attending a public institution.
| Age Bracket | Public School | Private School |
| 3 to 4 Year Olds | 248 (91.2%) | 24 (8.8%) |
| 5 to 9 Year Old | 68 (100.0%) | 0 (0.0%) |
| 10 to 14 Year Olds | 131 (100.0%) | 0 (0.0%) |
| 15 to 17 Year Olds | 114 (100.0%) | 0 (0.0%) |
| 18 to 19 Year Olds | 0 (0.0%) | 6 (100.0%) |
| 20 to 24 Year Olds | 30 (100.0%) | 0 (0.0%) |
| 25 to 34 Year Olds | 14 (100.0%) | 0 (0.0%) |
| 35 Years and over | 117 (100.0%) | 0 (0.0%) |
| Total | 722 (96.0%) | 30 (4.0%) |
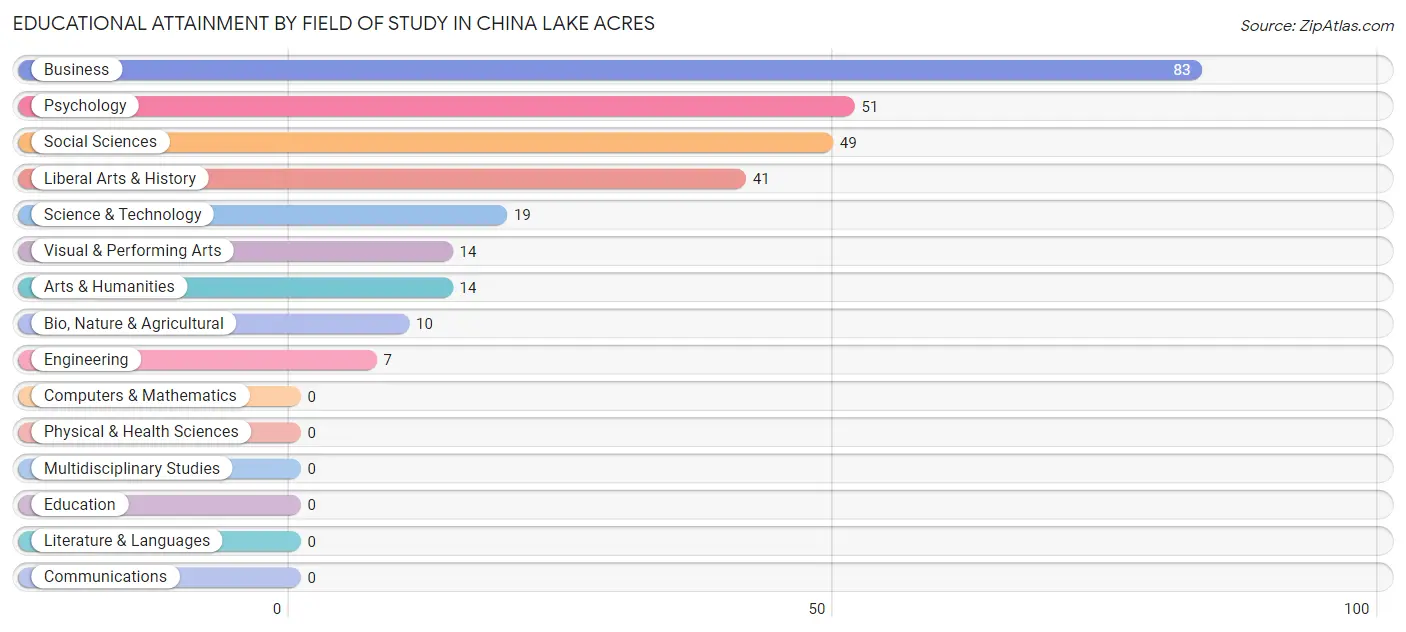
Educational Attainment by Field of Study in China Lake Acres
Business (83 | 28.8%), psychology (51 | 17.7%), social sciences (49 | 17.0%), liberal arts & history (41 | 14.2%), and science & technology (19 | 6.6%) are the most common fields of study among 288 individuals in China Lake Acres who have obtained a bachelor's degree or higher.
| Field of Study | # Graduates | % Graduates |
| Computers & Mathematics | 0 | 0.0% |
| Bio, Nature & Agricultural | 10 | 3.5% |
| Physical & Health Sciences | 0 | 0.0% |
| Psychology | 51 | 17.7% |
| Social Sciences | 49 | 17.0% |
| Engineering | 7 | 2.4% |
| Multidisciplinary Studies | 0 | 0.0% |
| Science & Technology | 19 | 6.6% |
| Business | 83 | 28.8% |
| Education | 0 | 0.0% |
| Literature & Languages | 0 | 0.0% |
| Liberal Arts & History | 41 | 14.2% |
| Visual & Performing Arts | 14 | 4.9% |
| Communications | 0 | 0.0% |
| Arts & Humanities | 14 | 4.9% |
| Total | 288 | 100.0% |
Transportation & Commute in China Lake Acres
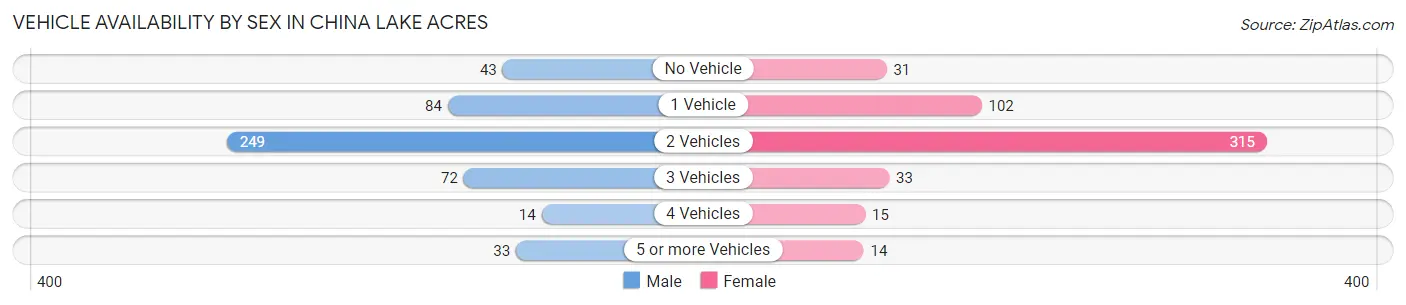
Vehicle Availability by Sex in China Lake Acres
The most prevalent vehicle ownership categories in China Lake Acres are males with 2 vehicles (249, accounting for 50.3%) and females with 2 vehicles (315, making up 48.8%).
| Vehicles Available | Male | Female |
| No Vehicle | 43 (8.7%) | 31 (6.1%) |
| 1 Vehicle | 84 (17.0%) | 102 (20.0%) |
| 2 Vehicles | 249 (50.3%) | 315 (61.8%) |
| 3 Vehicles | 72 (14.5%) | 33 (6.5%) |
| 4 Vehicles | 14 (2.8%) | 15 (2.9%) |
| 5 or more Vehicles | 33 (6.7%) | 14 (2.8%) |
| Total | 495 (100.0%) | 510 (100.0%) |
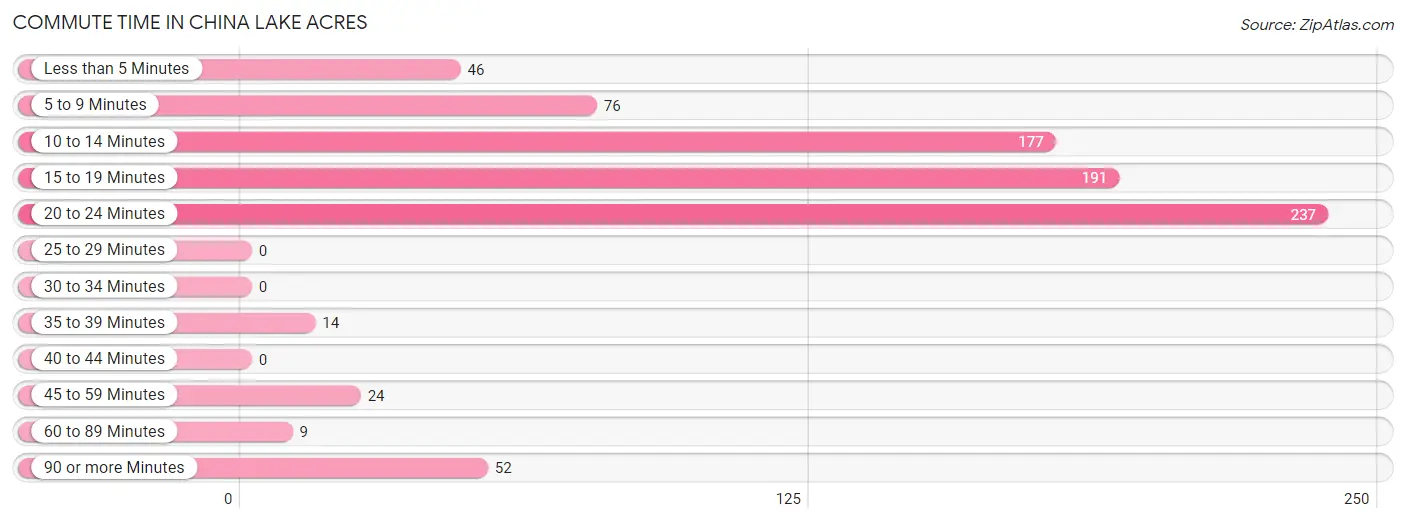
Commute Time in China Lake Acres
The most frequently occuring commute durations in China Lake Acres are 20 to 24 minutes (237 commuters, 28.7%), 15 to 19 minutes (191 commuters, 23.1%), and 10 to 14 minutes (177 commuters, 21.4%).
| Commute Time | # Commuters | % Commuters |
| Less than 5 Minutes | 46 | 5.6% |
| 5 to 9 Minutes | 76 | 9.2% |
| 10 to 14 Minutes | 177 | 21.4% |
| 15 to 19 Minutes | 191 | 23.1% |
| 20 to 24 Minutes | 237 | 28.7% |
| 25 to 29 Minutes | 0 | 0.0% |
| 30 to 34 Minutes | 0 | 0.0% |
| 35 to 39 Minutes | 14 | 1.7% |
| 40 to 44 Minutes | 0 | 0.0% |
| 45 to 59 Minutes | 24 | 2.9% |
| 60 to 89 Minutes | 9 | 1.1% |
| 90 or more Minutes | 52 | 6.3% |
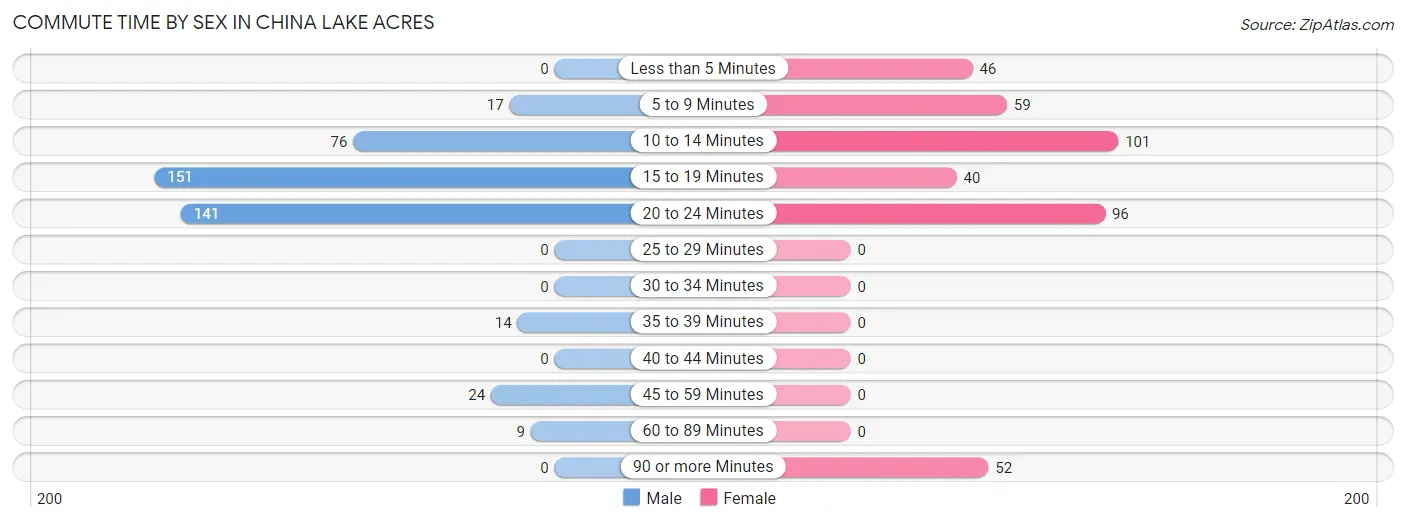
Commute Time by Sex in China Lake Acres
The most common commute times in China Lake Acres are 15 to 19 minutes (151 commuters, 34.9%) for males and 10 to 14 minutes (101 commuters, 25.6%) for females.
| Commute Time | Male | Female |
| Less than 5 Minutes | 0 (0.0%) | 46 (11.7%) |
| 5 to 9 Minutes | 17 (3.9%) | 59 (15.0%) |
| 10 to 14 Minutes | 76 (17.6%) | 101 (25.6%) |
| 15 to 19 Minutes | 151 (34.9%) | 40 (10.2%) |
| 20 to 24 Minutes | 141 (32.6%) | 96 (24.4%) |
| 25 to 29 Minutes | 0 (0.0%) | 0 (0.0%) |
| 30 to 34 Minutes | 0 (0.0%) | 0 (0.0%) |
| 35 to 39 Minutes | 14 (3.2%) | 0 (0.0%) |
| 40 to 44 Minutes | 0 (0.0%) | 0 (0.0%) |
| 45 to 59 Minutes | 24 (5.6%) | 0 (0.0%) |
| 60 to 89 Minutes | 9 (2.1%) | 0 (0.0%) |
| 90 or more Minutes | 0 (0.0%) | 52 (13.2%) |
Time of Departure to Work by Sex in China Lake Acres
The most frequent times of departure to work in China Lake Acres are 6:00 AM to 6:29 AM (173, 40.1%) for males and 6:30 AM to 6:59 AM (138, 35.0%) for females.
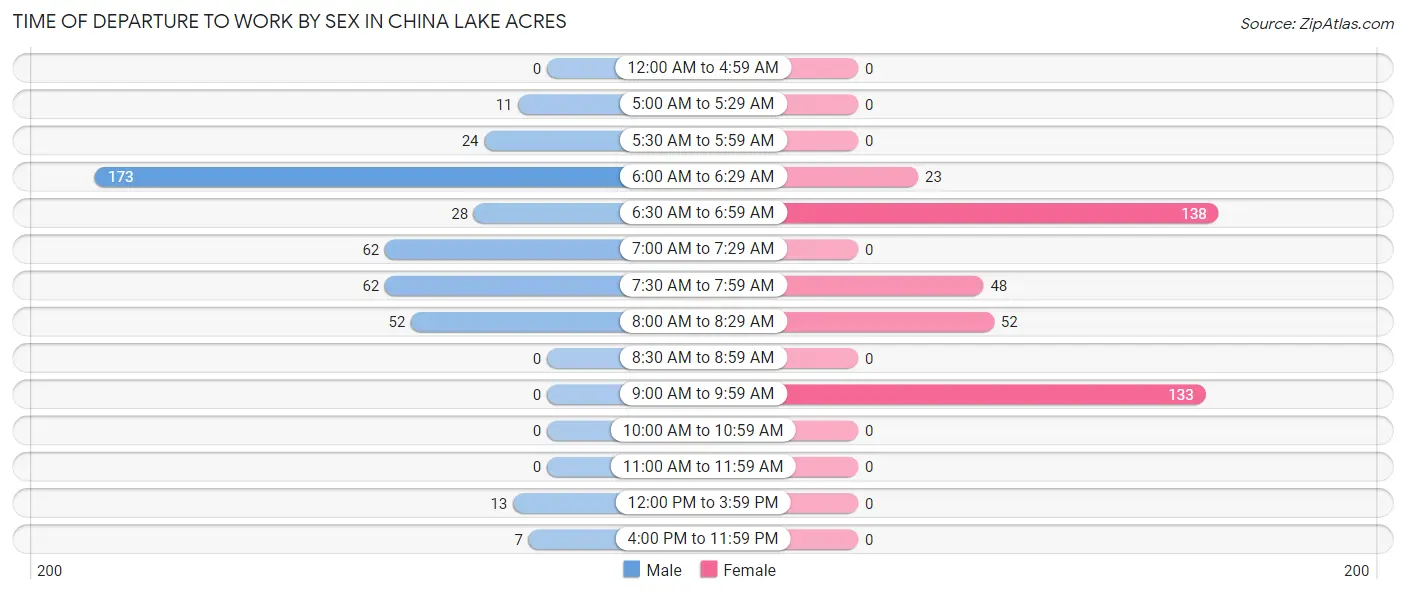
| Time of Departure | Male | Female |
| 12:00 AM to 4:59 AM | 0 (0.0%) | 0 (0.0%) |
| 5:00 AM to 5:29 AM | 11 (2.5%) | 0 (0.0%) |
| 5:30 AM to 5:59 AM | 24 (5.6%) | 0 (0.0%) |
| 6:00 AM to 6:29 AM | 173 (40.1%) | 23 (5.8%) |
| 6:30 AM to 6:59 AM | 28 (6.5%) | 138 (35.0%) |
| 7:00 AM to 7:29 AM | 62 (14.3%) | 0 (0.0%) |
| 7:30 AM to 7:59 AM | 62 (14.3%) | 48 (12.2%) |
| 8:00 AM to 8:29 AM | 52 (12.0%) | 52 (13.2%) |
| 8:30 AM to 8:59 AM | 0 (0.0%) | 0 (0.0%) |
| 9:00 AM to 9:59 AM | 0 (0.0%) | 133 (33.8%) |
| 10:00 AM to 10:59 AM | 0 (0.0%) | 0 (0.0%) |
| 11:00 AM to 11:59 AM | 0 (0.0%) | 0 (0.0%) |
| 12:00 PM to 3:59 PM | 13 (3.0%) | 0 (0.0%) |
| 4:00 PM to 11:59 PM | 7 (1.6%) | 0 (0.0%) |
| Total | 432 (100.0%) | 394 (100.0%) |
Housing Occupancy in China Lake Acres
Occupancy by Ownership in China Lake Acres
Of the total 820 dwellings in China Lake Acres, owner-occupied units account for 509 (62.1%), while renter-occupied units make up 311 (37.9%).
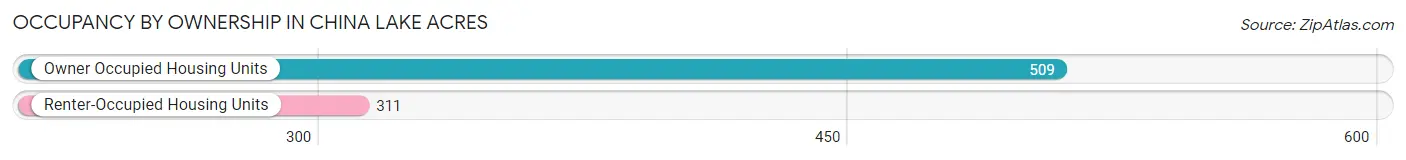
| Occupancy | # Housing Units | % Housing Units |
| Owner Occupied Housing Units | 509 | 62.1% |
| Renter-Occupied Housing Units | 311 | 37.9% |
| Total Occupied Housing Units | 820 | 100.0% |
Occupancy by Household Size in China Lake Acres
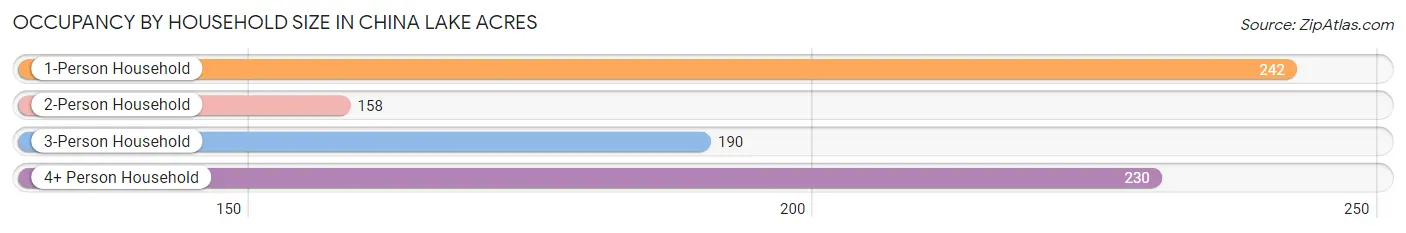
| Household Size | # Housing Units | % Housing Units |
| 1-Person Household | 242 | 29.5% |
| 2-Person Household | 158 | 19.3% |
| 3-Person Household | 190 | 23.2% |
| 4+ Person Household | 230 | 28.1% |
| Total Housing Units | 820 | 100.0% |
Occupancy by Ownership by Household Size in China Lake Acres
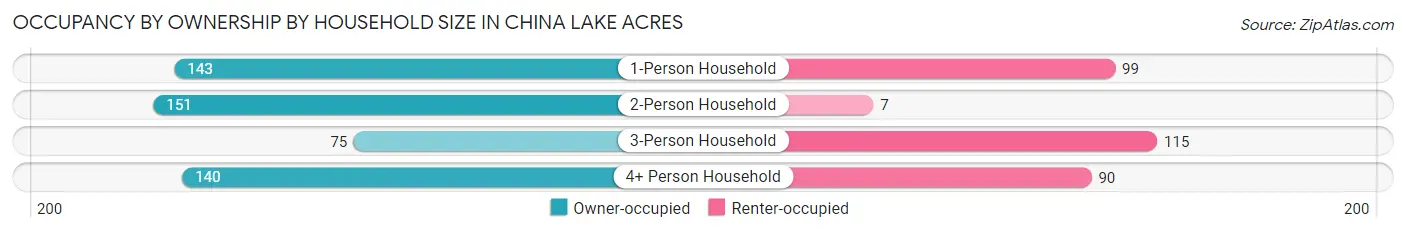
| Household Size | Owner-occupied | Renter-occupied |
| 1-Person Household | 143 (59.1%) | 99 (40.9%) |
| 2-Person Household | 151 (95.6%) | 7 (4.4%) |
| 3-Person Household | 75 (39.5%) | 115 (60.5%) |
| 4+ Person Household | 140 (60.9%) | 90 (39.1%) |
| Total Housing Units | 509 (62.1%) | 311 (37.9%) |
Occupancy by Educational Attainment in China Lake Acres
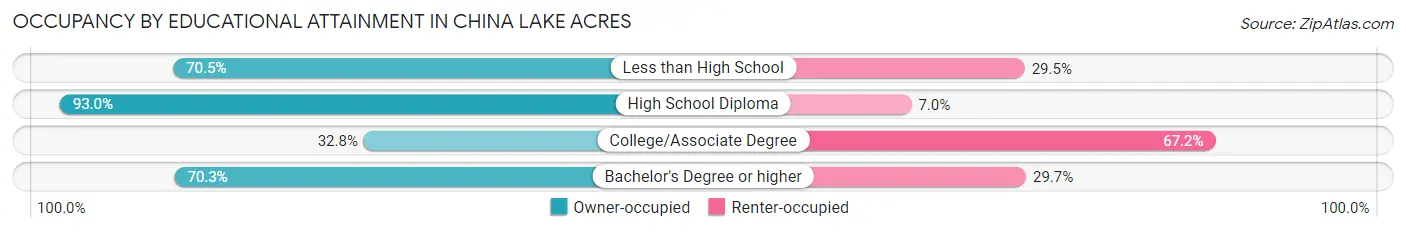
| Household Size | Owner-occupied | Renter-occupied |
| Less than High School | 91 (70.5%) | 38 (29.5%) |
| High School Diploma | 173 (93.0%) | 13 (7.0%) |
| College/Associate Degree | 96 (32.8%) | 197 (67.2%) |
| Bachelor's Degree or higher | 149 (70.3%) | 63 (29.7%) |
Occupancy by Age of Householder in China Lake Acres
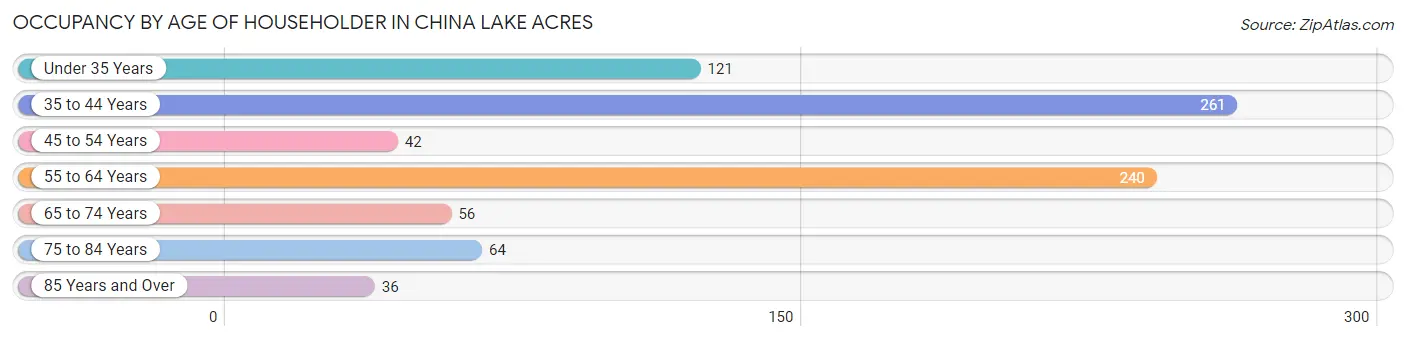
| Age Bracket | # Households | % Households |
| Under 35 Years | 121 | 14.8% |
| 35 to 44 Years | 261 | 31.8% |
| 45 to 54 Years | 42 | 5.1% |
| 55 to 64 Years | 240 | 29.3% |
| 65 to 74 Years | 56 | 6.8% |
| 75 to 84 Years | 64 | 7.8% |
| 85 Years and Over | 36 | 4.4% |
| Total | 820 | 100.0% |
Housing Finances in China Lake Acres
Median Income by Occupancy in China Lake Acres
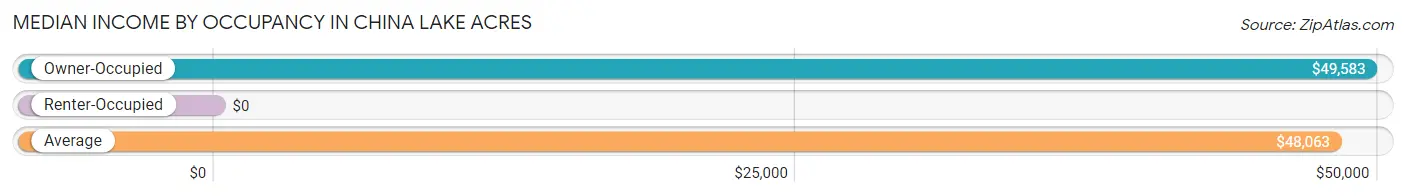
| Occupancy Type | # Households | Median Income |
| Owner-Occupied | 509 (62.1%) | $49,583 |
| Renter-Occupied | 311 (37.9%) | $0 |
| Average | 820 (100.0%) | $48,063 |
Occupancy by Householder Income Bracket in China Lake Acres
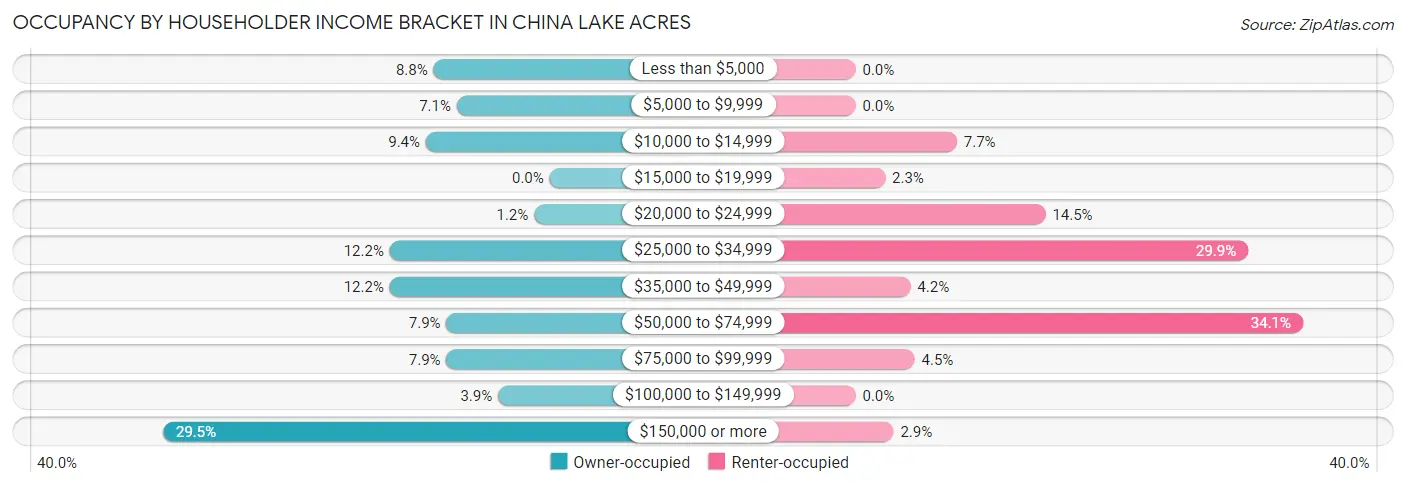
| Income Bracket | Owner-occupied | Renter-occupied |
| Less than $5,000 | 45 (8.8%) | 0 (0.0%) |
| $5,000 to $9,999 | 36 (7.1%) | 0 (0.0%) |
| $10,000 to $14,999 | 48 (9.4%) | 24 (7.7%) |
| $15,000 to $19,999 | 0 (0.0%) | 7 (2.2%) |
| $20,000 to $24,999 | 6 (1.2%) | 45 (14.5%) |
| $25,000 to $34,999 | 62 (12.2%) | 93 (29.9%) |
| $35,000 to $49,999 | 62 (12.2%) | 13 (4.2%) |
| $50,000 to $74,999 | 40 (7.9%) | 106 (34.1%) |
| $75,000 to $99,999 | 40 (7.9%) | 14 (4.5%) |
| $100,000 to $149,999 | 20 (3.9%) | 0 (0.0%) |
| $150,000 or more | 150 (29.5%) | 9 (2.9%) |
| Total | 509 (100.0%) | 311 (100.0%) |
Monthly Housing Cost Tiers in China Lake Acres
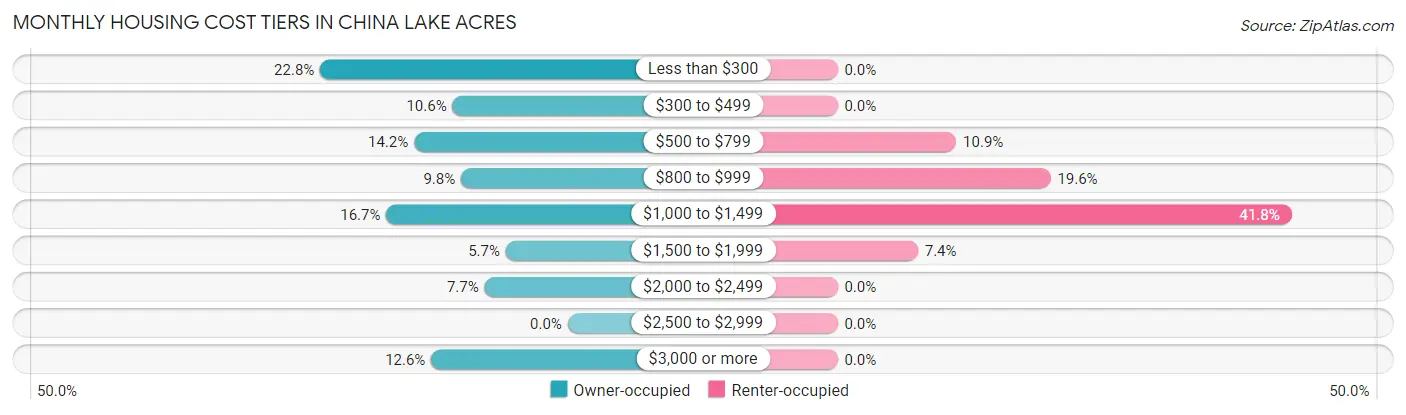
| Monthly Cost | Owner-occupied | Renter-occupied |
| Less than $300 | 116 (22.8%) | 0 (0.0%) |
| $300 to $499 | 54 (10.6%) | 0 (0.0%) |
| $500 to $799 | 72 (14.1%) | 34 (10.9%) |
| $800 to $999 | 50 (9.8%) | 61 (19.6%) |
| $1,000 to $1,499 | 85 (16.7%) | 130 (41.8%) |
| $1,500 to $1,999 | 29 (5.7%) | 23 (7.4%) |
| $2,000 to $2,499 | 39 (7.7%) | 0 (0.0%) |
| $2,500 to $2,999 | 0 (0.0%) | 0 (0.0%) |
| $3,000 or more | 64 (12.6%) | 0 (0.0%) |
| Total | 509 (100.0%) | 311 (100.0%) |
Physical Housing Characteristics in China Lake Acres
Housing Structures in China Lake Acres
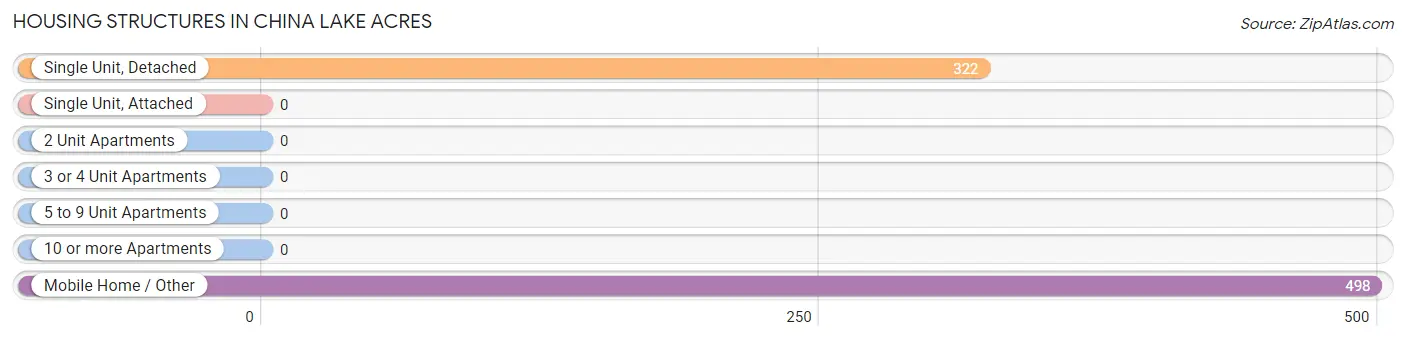
| Structure Type | # Housing Units | % Housing Units |
| Single Unit, Detached | 322 | 39.3% |
| Single Unit, Attached | 0 | 0.0% |
| 2 Unit Apartments | 0 | 0.0% |
| 3 or 4 Unit Apartments | 0 | 0.0% |
| 5 to 9 Unit Apartments | 0 | 0.0% |
| 10 or more Apartments | 0 | 0.0% |
| Mobile Home / Other | 498 | 60.7% |
| Total | 820 | 100.0% |
Housing Structures by Occupancy in China Lake Acres
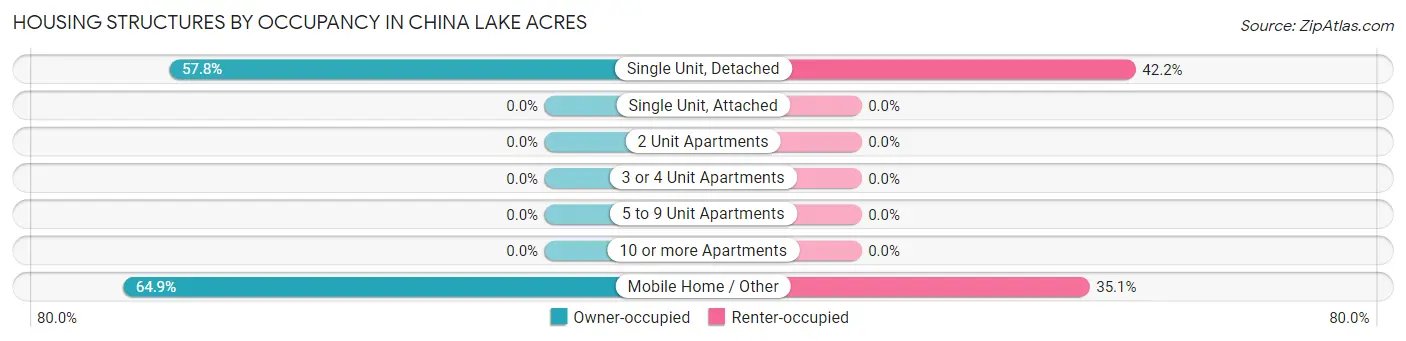
| Structure Type | Owner-occupied | Renter-occupied |
| Single Unit, Detached | 186 (57.8%) | 136 (42.2%) |
| Single Unit, Attached | 0 (0.0%) | 0 (0.0%) |
| 2 Unit Apartments | 0 (0.0%) | 0 (0.0%) |
| 3 or 4 Unit Apartments | 0 (0.0%) | 0 (0.0%) |
| 5 to 9 Unit Apartments | 0 (0.0%) | 0 (0.0%) |
| 10 or more Apartments | 0 (0.0%) | 0 (0.0%) |
| Mobile Home / Other | 323 (64.9%) | 175 (35.1%) |
| Total | 509 (62.1%) | 311 (37.9%) |
Housing Structures by Number of Rooms in China Lake Acres
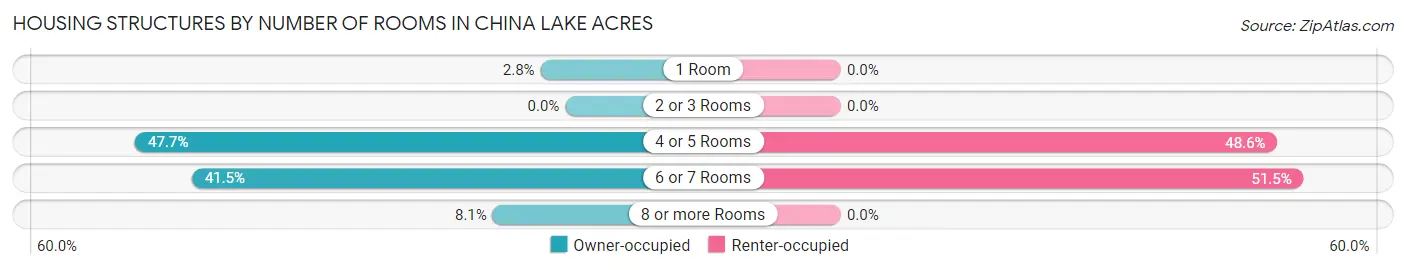
| Number of Rooms | Owner-occupied | Renter-occupied |
| 1 Room | 14 (2.8%) | 0 (0.0%) |
| 2 or 3 Rooms | 0 (0.0%) | 0 (0.0%) |
| 4 or 5 Rooms | 243 (47.7%) | 151 (48.5%) |
| 6 or 7 Rooms | 211 (41.4%) | 160 (51.4%) |
| 8 or more Rooms | 41 (8.1%) | 0 (0.0%) |
| Total | 509 (100.0%) | 311 (100.0%) |
Housing Structure by Heating Type in China Lake Acres
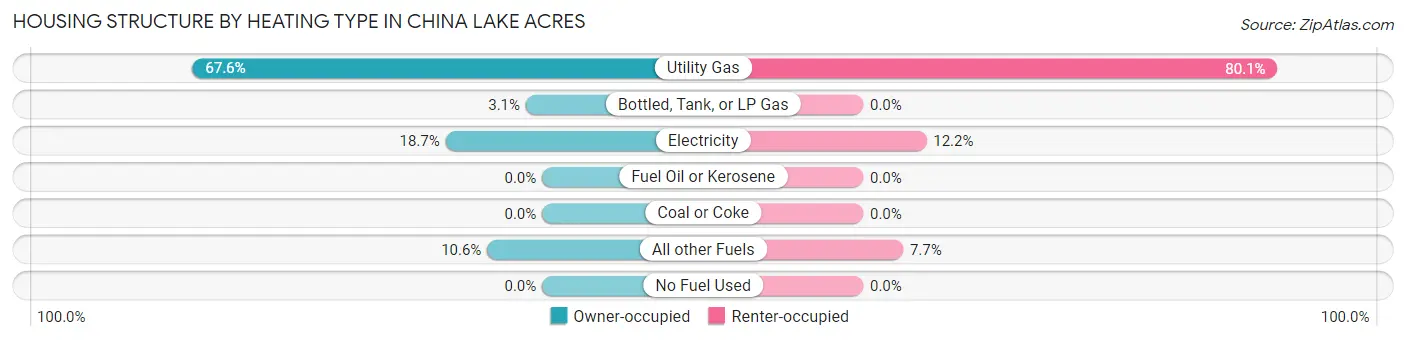
| Heating Type | Owner-occupied | Renter-occupied |
| Utility Gas | 344 (67.6%) | 249 (80.1%) |
| Bottled, Tank, or LP Gas | 16 (3.1%) | 0 (0.0%) |
| Electricity | 95 (18.7%) | 38 (12.2%) |
| Fuel Oil or Kerosene | 0 (0.0%) | 0 (0.0%) |
| Coal or Coke | 0 (0.0%) | 0 (0.0%) |
| All other Fuels | 54 (10.6%) | 24 (7.7%) |
| No Fuel Used | 0 (0.0%) | 0 (0.0%) |
| Total | 509 (100.0%) | 311 (100.0%) |
Household Vehicle Usage in China Lake Acres
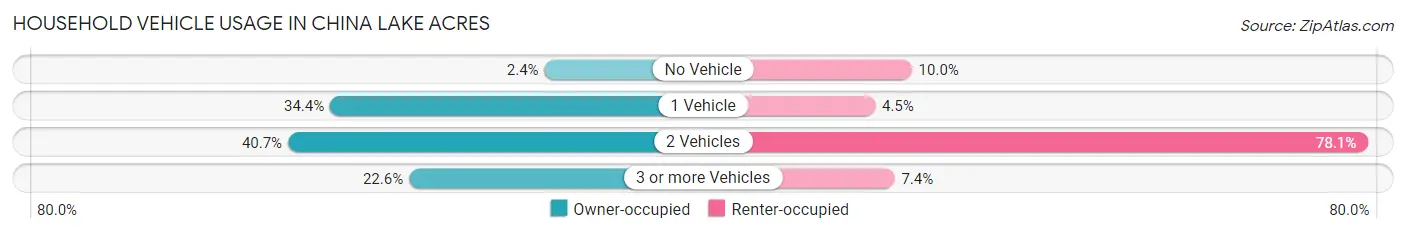
| Vehicles per Household | Owner-occupied | Renter-occupied |
| No Vehicle | 12 (2.4%) | 31 (10.0%) |
| 1 Vehicle | 175 (34.4%) | 14 (4.5%) |
| 2 Vehicles | 207 (40.7%) | 243 (78.1%) |
| 3 or more Vehicles | 115 (22.6%) | 23 (7.4%) |
| Total | 509 (100.0%) | 311 (100.0%) |
Real Estate & Mortgages in China Lake Acres
Real Estate and Mortgage Overview in China Lake Acres
| Characteristic | Without Mortgage | With Mortgage |
| Housing Units | 242 | 267 |
| Median Property Value | $108,000 | $188,400 |
| Median Household Income | - | - |
| Monthly Housing Costs | $321 | $64 |
| Real Estate Taxes | $658 | $0 |
Property Value by Mortgage Status in China Lake Acres
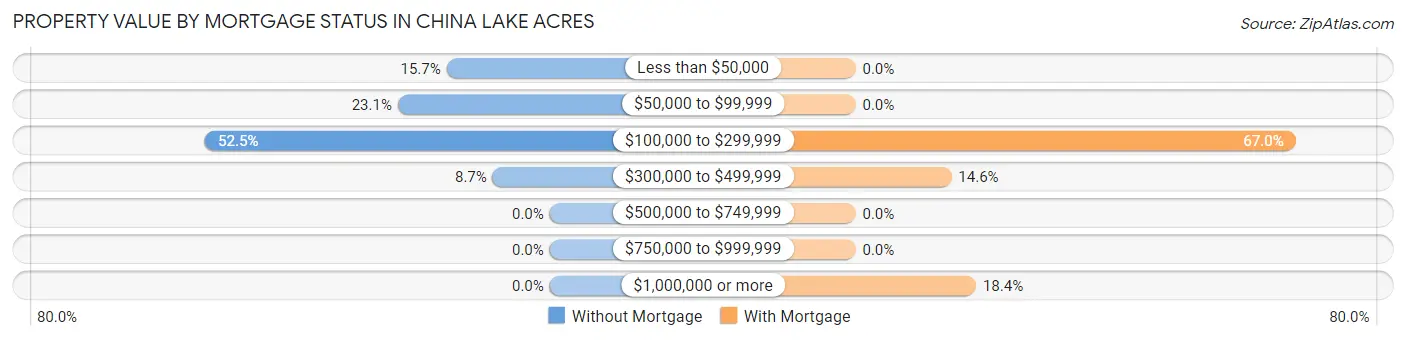
| Property Value | Without Mortgage | With Mortgage |
| Less than $50,000 | 38 (15.7%) | 0 (0.0%) |
| $50,000 to $99,999 | 56 (23.1%) | 0 (0.0%) |
| $100,000 to $299,999 | 127 (52.5%) | 179 (67.0%) |
| $300,000 to $499,999 | 21 (8.7%) | 39 (14.6%) |
| $500,000 to $749,999 | 0 (0.0%) | 0 (0.0%) |
| $750,000 to $999,999 | 0 (0.0%) | 0 (0.0%) |
| $1,000,000 or more | 0 (0.0%) | 49 (18.3%) |
| Total | 242 (100.0%) | 267 (100.0%) |
Household Income by Mortgage Status in China Lake Acres
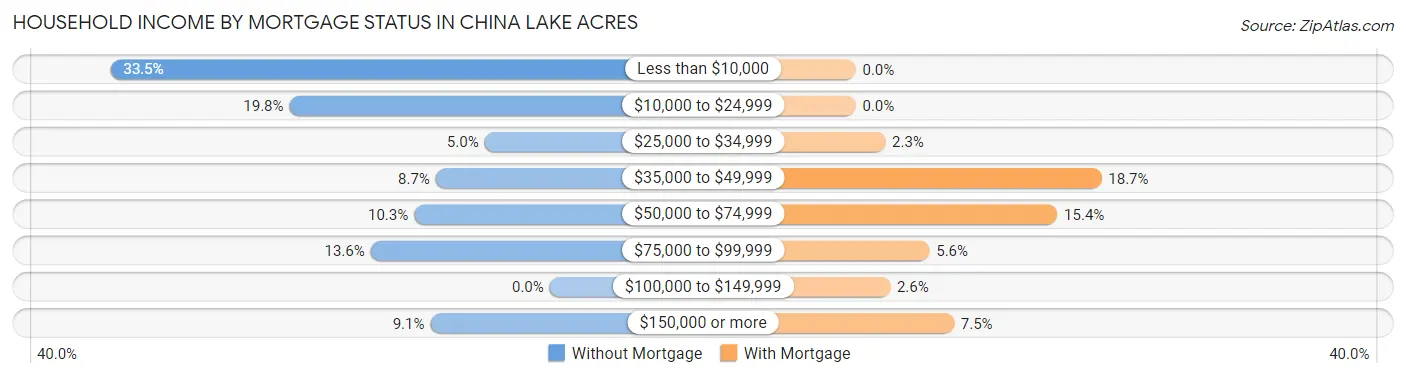
| Household Income | Without Mortgage | With Mortgage |
| Less than $10,000 | 81 (33.5%) | 0 (0.0%) |
| $10,000 to $24,999 | 48 (19.8%) | 0 (0.0%) |
| $25,000 to $34,999 | 12 (5.0%) | 6 (2.2%) |
| $35,000 to $49,999 | 21 (8.7%) | 50 (18.7%) |
| $50,000 to $74,999 | 25 (10.3%) | 41 (15.4%) |
| $75,000 to $99,999 | 33 (13.6%) | 15 (5.6%) |
| $100,000 to $149,999 | 0 (0.0%) | 7 (2.6%) |
| $150,000 or more | 22 (9.1%) | 20 (7.5%) |
| Total | 242 (100.0%) | 267 (100.0%) |
Property Value to Household Income Ratio in China Lake Acres
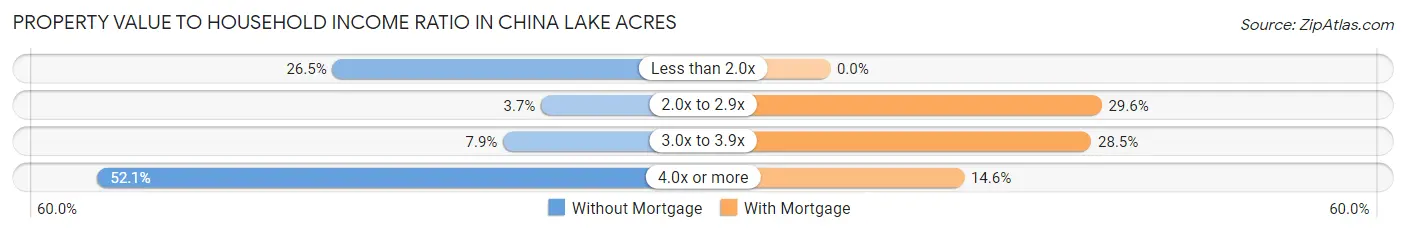
| Value-to-Income Ratio | Without Mortgage | With Mortgage |
| Less than 2.0x | 64 (26.5%) | 0 (0.0%) |
| 2.0x to 2.9x | 9 (3.7%) | 79 (29.6%) |
| 3.0x to 3.9x | 19 (7.9%) | 76 (28.5%) |
| 4.0x or more | 126 (52.1%) | 39 (14.6%) |
| Total | 242 (100.0%) | 267 (100.0%) |
Real Estate Taxes by Mortgage Status in China Lake Acres
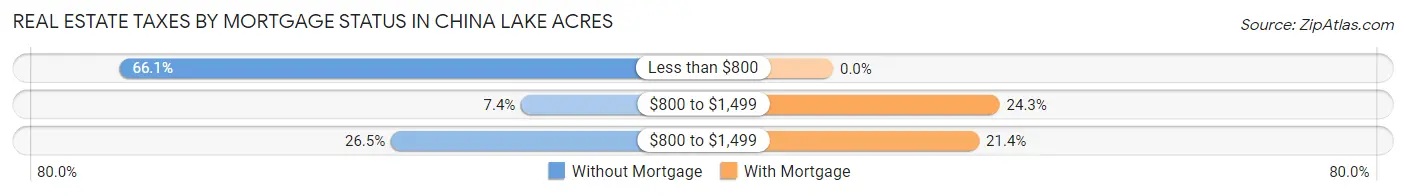
| Property Taxes | Without Mortgage | With Mortgage |
| Less than $800 | 160 (66.1%) | 0 (0.0%) |
| $800 to $1,499 | 18 (7.4%) | 65 (24.3%) |
| $800 to $1,499 | 64 (26.5%) | 57 (21.3%) |
| Total | 242 (100.0%) | 267 (100.0%) |
Health & Disability in China Lake Acres
Health Insurance Coverage by Age in China Lake Acres
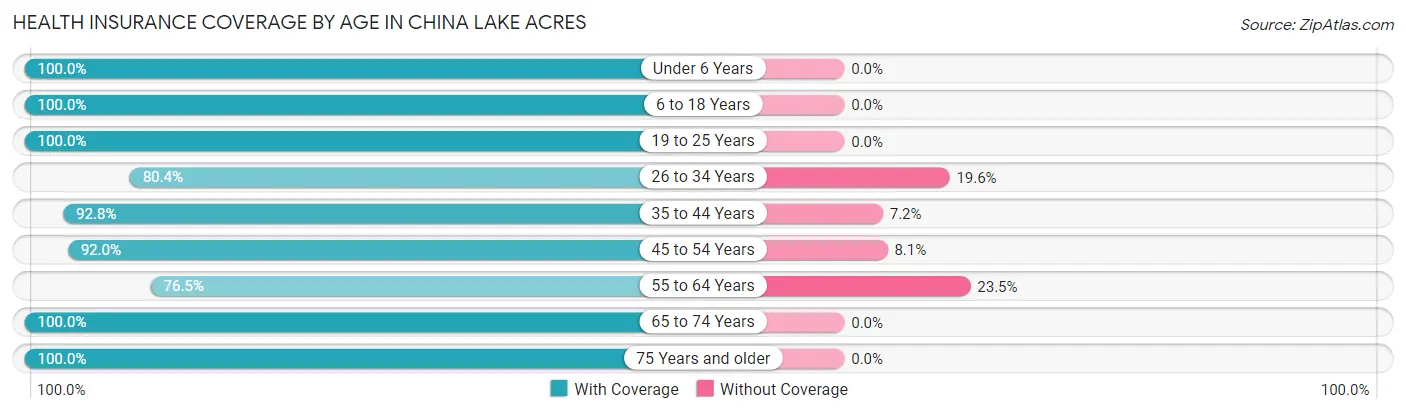
| Age Bracket | With Coverage | Without Coverage |
| Under 6 Years | 460 (100.0%) | 0 (0.0%) |
| 6 to 18 Years | 284 (100.0%) | 0 (0.0%) |
| 19 to 25 Years | 185 (100.0%) | 0 (0.0%) |
| 26 to 34 Years | 246 (80.4%) | 60 (19.6%) |
| 35 to 44 Years | 388 (92.8%) | 30 (7.2%) |
| 45 to 54 Years | 137 (91.9%) | 12 (8.1%) |
| 55 to 64 Years | 231 (76.5%) | 71 (23.5%) |
| 65 to 74 Years | 112 (100.0%) | 0 (0.0%) |
| 75 Years and older | 169 (100.0%) | 0 (0.0%) |
| Total | 2,212 (92.7%) | 173 (7.2%) |
Health Insurance Coverage by Citizenship Status in China Lake Acres

| Citizenship Status | With Coverage | Without Coverage |
| Native Born | 460 (100.0%) | 0 (0.0%) |
| Foreign Born, Citizen | 284 (100.0%) | 0 (0.0%) |
| Foreign Born, not a Citizen | 185 (100.0%) | 0 (0.0%) |
Health Insurance Coverage by Household Income in China Lake Acres
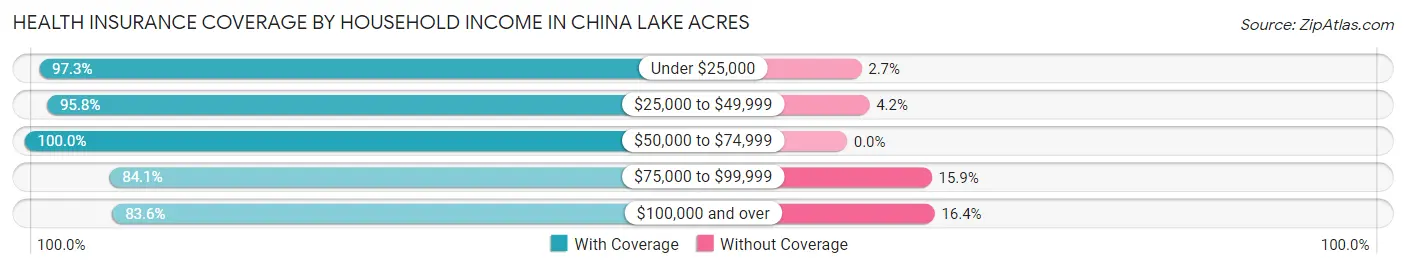
| Household Income | With Coverage | Without Coverage |
| Under $25,000 | 251 (97.3%) | 7 (2.7%) |
| $25,000 to $49,999 | 958 (95.8%) | 42 (4.2%) |
| $50,000 to $74,999 | 364 (100.0%) | 0 (0.0%) |
| $75,000 to $99,999 | 196 (84.1%) | 37 (15.9%) |
| $100,000 and over | 443 (83.6%) | 87 (16.4%) |
Public vs Private Health Insurance Coverage by Age in China Lake Acres
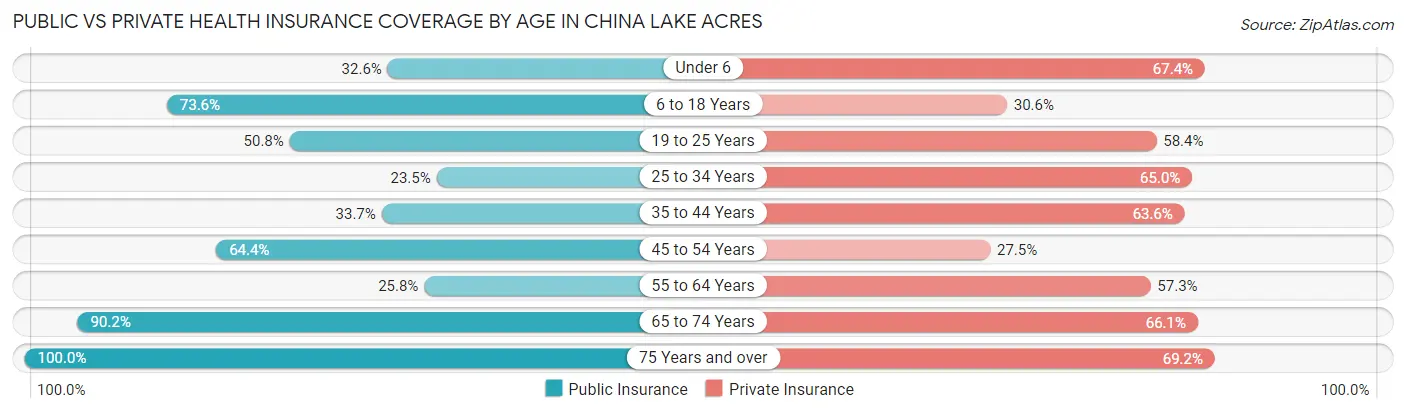
| Age Bracket | Public Insurance | Private Insurance |
| Under 6 | 150 (32.6%) | 310 (67.4%) |
| 6 to 18 Years | 209 (73.6%) | 87 (30.6%) |
| 19 to 25 Years | 94 (50.8%) | 108 (58.4%) |
| 25 to 34 Years | 72 (23.5%) | 199 (65.0%) |
| 35 to 44 Years | 141 (33.7%) | 266 (63.6%) |
| 45 to 54 Years | 96 (64.4%) | 41 (27.5%) |
| 55 to 64 Years | 78 (25.8%) | 173 (57.3%) |
| 65 to 74 Years | 101 (90.2%) | 74 (66.1%) |
| 75 Years and over | 169 (100.0%) | 117 (69.2%) |
| Total | 1,110 (46.5%) | 1,375 (57.7%) |
Disability Status by Sex by Age in China Lake Acres
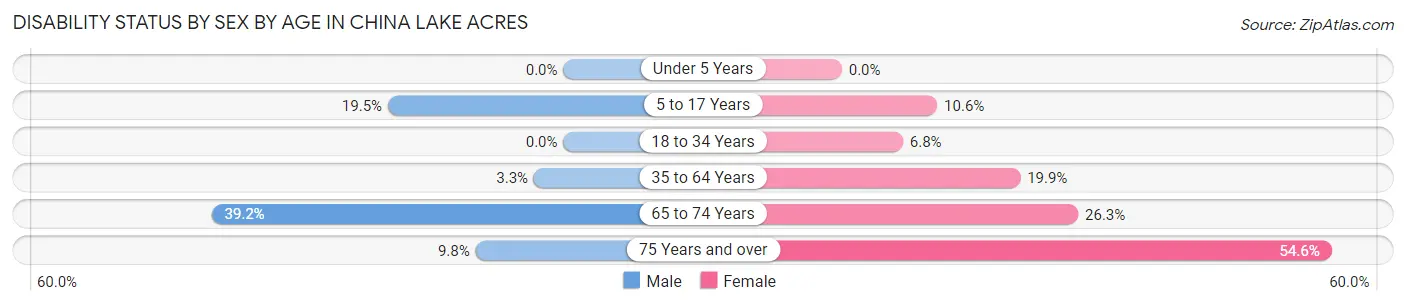
| Age Bracket | Male | Female |
| Under 5 Years | 0 (0.0%) | 0 (0.0%) |
| 5 to 17 Years | 17 (19.5%) | 24 (10.6%) |
| 18 to 34 Years | 0 (0.0%) | 14 (6.8%) |
| 35 to 64 Years | 13 (3.3%) | 94 (19.9%) |
| 65 to 74 Years | 29 (39.2%) | 10 (26.3%) |
| 75 Years and over | 9 (9.8%) | 42 (54.5%) |
Disability Class by Sex by Age in China Lake Acres
Disability Class: Hearing Difficulty
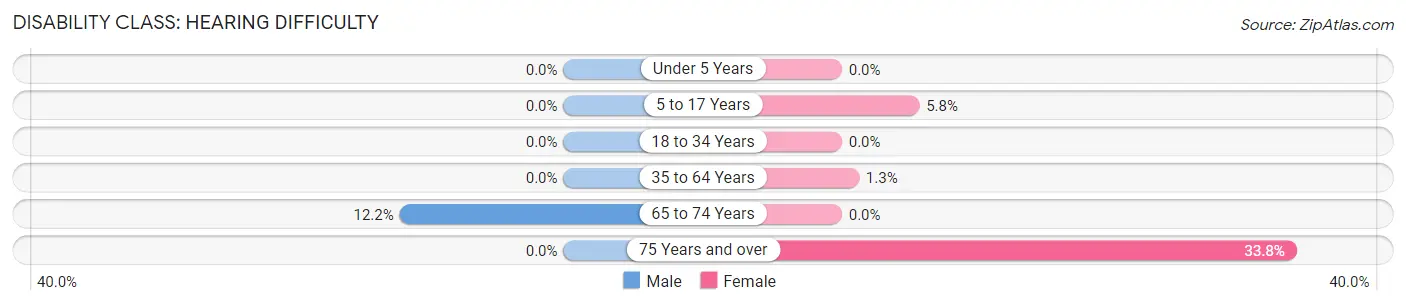
| Age Bracket | Male | Female |
| Under 5 Years | 0 (0.0%) | 0 (0.0%) |
| 5 to 17 Years | 0 (0.0%) | 13 (5.8%) |
| 18 to 34 Years | 0 (0.0%) | 0 (0.0%) |
| 35 to 64 Years | 0 (0.0%) | 6 (1.3%) |
| 65 to 74 Years | 9 (12.2%) | 0 (0.0%) |
| 75 Years and over | 0 (0.0%) | 26 (33.8%) |
Disability Class: Vision Difficulty
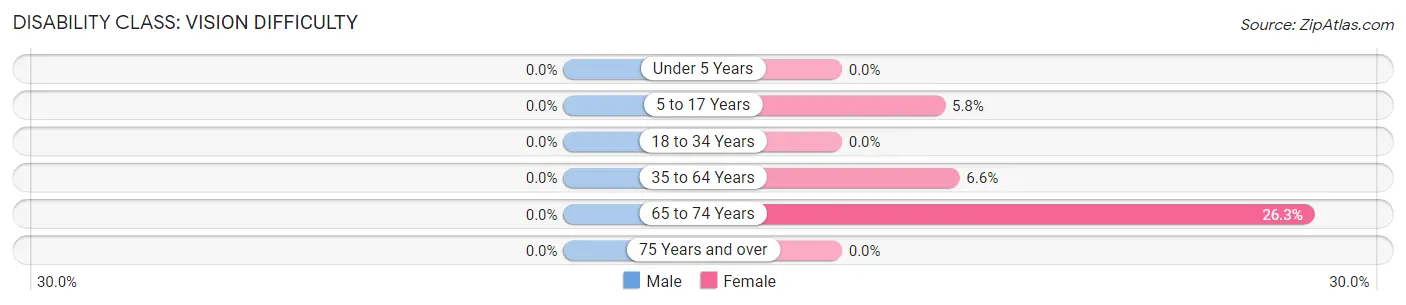
| Age Bracket | Male | Female |
| Under 5 Years | 0 (0.0%) | 0 (0.0%) |
| 5 to 17 Years | 0 (0.0%) | 13 (5.8%) |
| 18 to 34 Years | 0 (0.0%) | 0 (0.0%) |
| 35 to 64 Years | 0 (0.0%) | 31 (6.6%) |
| 65 to 74 Years | 0 (0.0%) | 10 (26.3%) |
| 75 Years and over | 0 (0.0%) | 0 (0.0%) |
Disability Class: Cognitive Difficulty
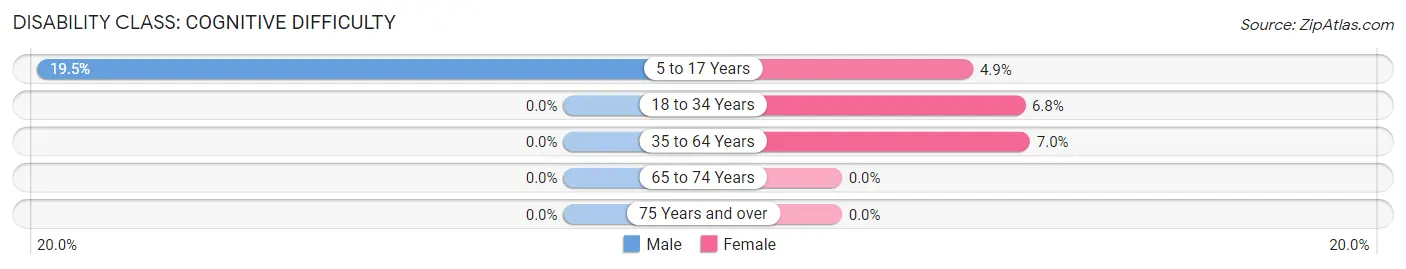
| Age Bracket | Male | Female |
| 5 to 17 Years | 17 (19.5%) | 11 (4.9%) |
| 18 to 34 Years | 0 (0.0%) | 14 (6.8%) |
| 35 to 64 Years | 0 (0.0%) | 33 (7.0%) |
| 65 to 74 Years | 0 (0.0%) | 0 (0.0%) |
| 75 Years and over | 0 (0.0%) | 0 (0.0%) |
Disability Class: Ambulatory Difficulty
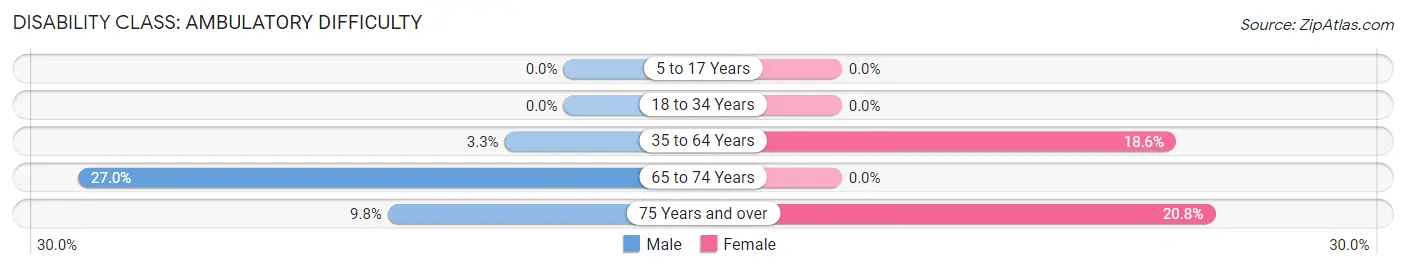
| Age Bracket | Male | Female |
| 5 to 17 Years | 0 (0.0%) | 0 (0.0%) |
| 18 to 34 Years | 0 (0.0%) | 0 (0.0%) |
| 35 to 64 Years | 13 (3.3%) | 88 (18.6%) |
| 65 to 74 Years | 20 (27.0%) | 0 (0.0%) |
| 75 Years and over | 9 (9.8%) | 16 (20.8%) |
Disability Class: Self-Care Difficulty
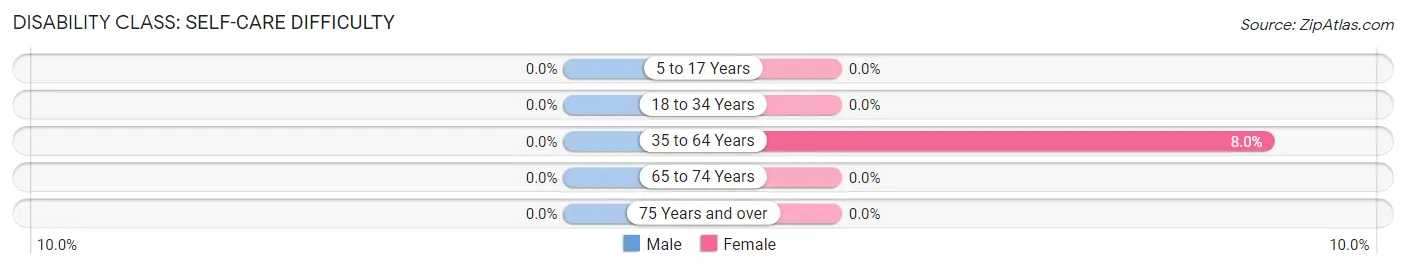
| Age Bracket | Male | Female |
| 5 to 17 Years | 0 (0.0%) | 0 (0.0%) |
| 18 to 34 Years | 0 (0.0%) | 0 (0.0%) |
| 35 to 64 Years | 0 (0.0%) | 38 (8.0%) |
| 65 to 74 Years | 0 (0.0%) | 0 (0.0%) |
| 75 Years and over | 0 (0.0%) | 0 (0.0%) |
Technology Access in China Lake Acres
Computing Device Access in China Lake Acres
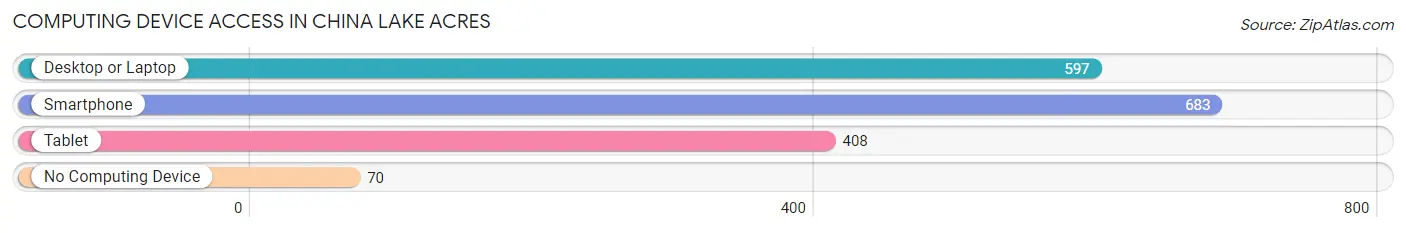
| Device Type | # Households | % Households |
| Desktop or Laptop | 597 | 72.8% |
| Smartphone | 683 | 83.3% |
| Tablet | 408 | 49.8% |
| No Computing Device | 70 | 8.5% |
| Total | 820 | 100.0% |
Internet Access in China Lake Acres
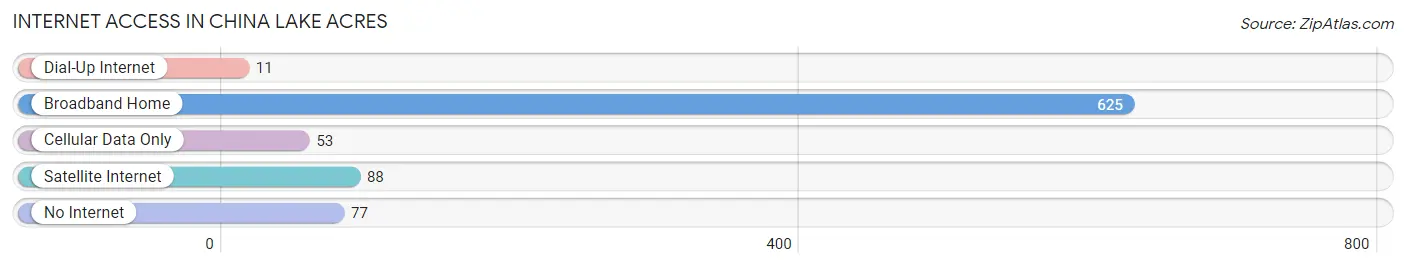
| Internet Type | # Households | % Households |
| Dial-Up Internet | 11 | 1.3% |
| Broadband Home | 625 | 76.2% |
| Cellular Data Only | 53 | 6.5% |
| Satellite Internet | 88 | 10.7% |
| No Internet | 77 | 9.4% |
| Total | 820 | 100.0% |
China Lake Acres Summary
Introduction
Located in the Mojave Desert of California, China Lake Acres is a small unincorporated community in Kern County. It is situated in the Indian Wells Valley, approximately 10 miles east of the city of Ridgecrest. The community is home to a population of approximately 1,000 people, and is known for its rural atmosphere and small-town charm.
History
The area that is now known as China Lake Acres was first settled in the late 1800s by ranchers and farmers. The area was originally known as “Indian Wells Valley”, and was home to a number of Native American tribes, including the Kawaiisu, Kitanemuk, and Tubatulabal. In the early 1900s, the area was developed for agriculture, and the first post office was established in the area in 1910.
In the 1940s, the area was chosen as the site for the Naval Air Weapons Station China Lake, a military base that was used for weapons testing and research. The base was established in 1943, and the surrounding area was renamed “China Lake Acres”. The base has since become one of the largest employers in the area, and has had a significant impact on the local economy.
Geography
China Lake Acres is located in the Mojave Desert of California, in the Indian Wells Valley. The area is characterized by its dry climate and sparse vegetation. The average annual temperature is around 70 degrees Fahrenheit, and the average annual precipitation is around 4 inches. The area is surrounded by mountains, including the Sierra Nevada to the west and the White Mountains to the east.
Economy
The economy of China Lake Acres is largely driven by the Naval Air Weapons Station China Lake. The base is one of the largest employers in the area, and provides jobs for a large number of local residents. Other major employers in the area include the China Lake Acres School District, the China Lake Acres Fire Department, and the China Lake Acres Chamber of Commerce.
In addition to the base, the area is also home to a number of small businesses, including restaurants, retail stores, and service providers. The area is also home to a number of tourist attractions, including the China Lake Acres Museum and the China Lake Acres Golf Course.
Demographics
As of the 2010 census, the population of China Lake Acres was 1,000. The racial makeup of the area was 79.2% White, 8.2% African American, 0.7% Native American, 0.7% Asian, 0.2% Pacific Islander, and 10.8% from other races. The median household income was $45,000, and the median age was 37.
Conclusion
China Lake Acres is a small unincorporated community in Kern County, California. It is situated in the Indian Wells Valley, and is home to a population of approximately 1,000 people. The area is largely driven by the Naval Air Weapons Station China Lake, which is one of the largest employers in the area. The area is also home to a number of small businesses, and is known for its rural atmosphere and small-town charm.
Common Questions
What is Per Capita Income in China Lake Acres?
Per Capita income in China Lake Acres is $41,585.
What is the Median Family Income in China Lake Acres?
Median Family Income in China Lake Acres is $68,007.
What is the Median Household income in China Lake Acres?
Median Household Income in China Lake Acres is $48,063.
What is Income or Wage Gap in China Lake Acres?
Income or Wage Gap in China Lake Acres is 38.4%.
Women in China Lake Acres earn 61.6 cents for every dollar earned by a man.
What is Family Income Deficit in China Lake Acres?
Family Income Deficit in China Lake Acres is $11,368.
Families that are below poverty line in China Lake Acres earn $11,368 less on average than the poverty threshold level.
What is Inequality or Gini Index in China Lake Acres?
Inequality or Gini Index in China Lake Acres is 0.65.
What is the Total Population of China Lake Acres?
Total Population of China Lake Acres is 2,385.
What is the Total Male Population of China Lake Acres?
Total Male Population of China Lake Acres is 1,039.
What is the Total Female Population of China Lake Acres?
Total Female Population of China Lake Acres is 1,346.
What is the Ratio of Males per 100 Females in China Lake Acres?
There are 77.19 Males per 100 Females in China Lake Acres.
What is the Ratio of Females per 100 Males in China Lake Acres?
There are 129.55 Females per 100 Males in China Lake Acres.
What is the Median Population Age in China Lake Acres?
Median Population Age in China Lake Acres is 34.7 Years.
What is the Average Family Size in China Lake Acres
Average Family Size in China Lake Acres is 3.1 People.
What is the Average Household Size in China Lake Acres
Average Household Size in China Lake Acres is 2.9 People.
How Large is the Labor Force in China Lake Acres?
There are 1,078 People in the Labor Forcein in China Lake Acres.
What is the Percentage of People in the Labor Force in China Lake Acres?
63.7% of People are in the Labor Force in China Lake Acres.
What is the Unemployment Rate in China Lake Acres?
Unemployment Rate in China Lake Acres is 6.8%.