Cities with the Highest Percentage of Population Employed in Life, Physical & Social Science in Illinois
RELATED REPORTS & OPTIONS
Life, Physical & Social Science
Illinois
Compare Cities
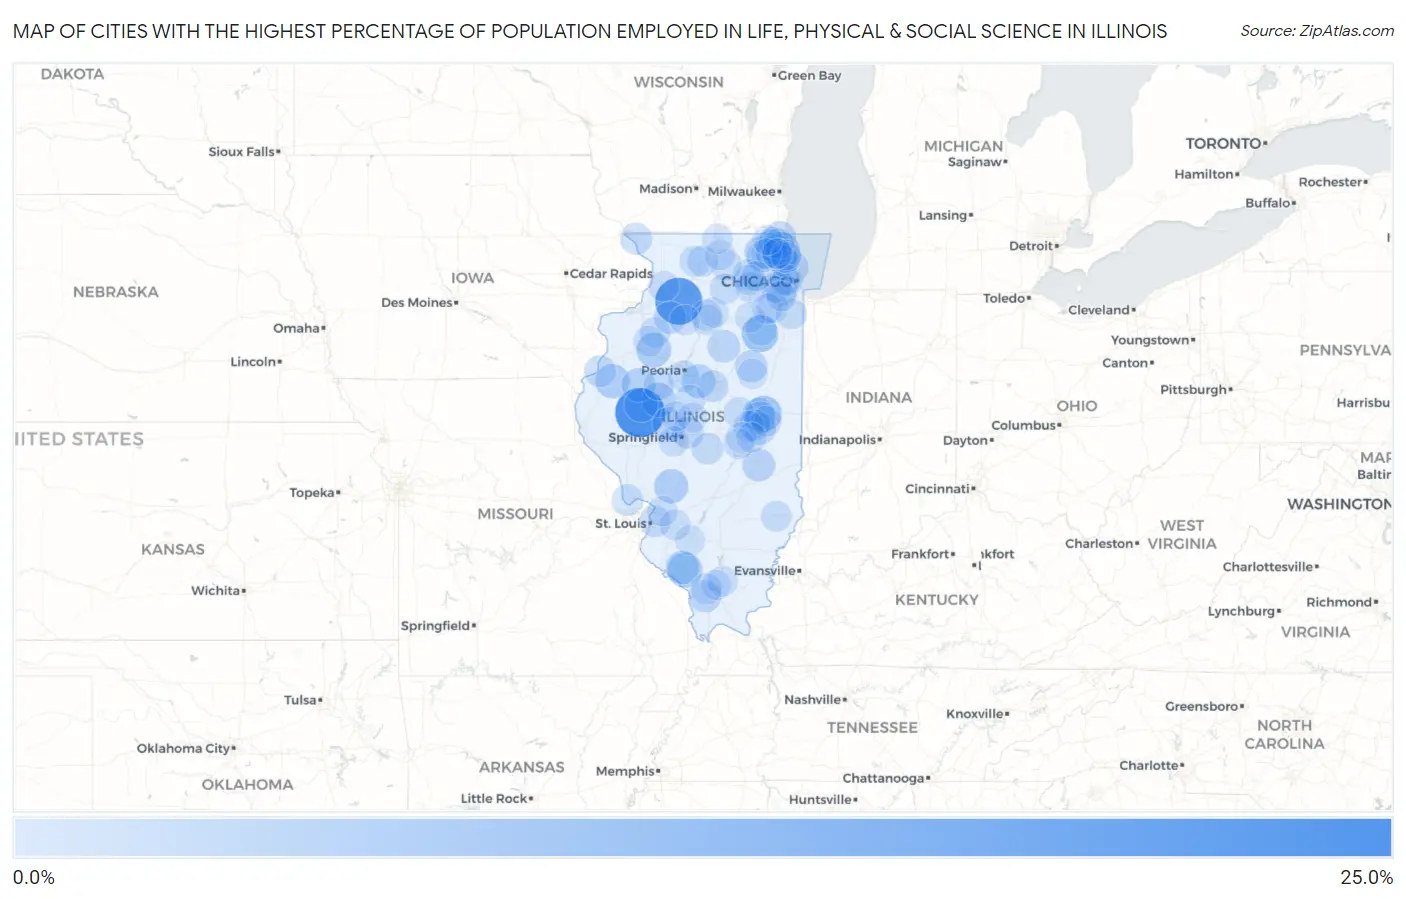
Map of Cities with the Highest Percentage of Population Employed in Life, Physical & Social Science in Illinois
0.0%
25.0%
Cities with the Highest Percentage of Population Employed in Life, Physical & Social Science in Illinois
| City | % Employed | vs State | vs National | |
| 1. | Browning | 20.9% | 0.98%(+20.0)#1 | 1.1%(+19.8)#70 |
| 2. | Deer Grove | 18.5% | 0.98%(+17.5)#2 | 1.1%(+17.4)#82 |
| 3. | Bonnie Brae | 9.1% | 0.98%(+8.08)#3 | 1.1%(+7.97)#279 |
| 4. | East Brooklyn | 8.0% | 0.98%(+7.02)#4 | 1.1%(+6.91)#343 |
| 5. | Urbana | 7.5% | 0.98%(+6.56)#5 | 1.1%(+6.44)#375 |
| 6. | Knollwood | 6.6% | 0.98%(+5.57)#6 | 1.1%(+5.46)#493 |
| 7. | Willisville | 6.5% | 0.98%(+5.56)#7 | 1.1%(+5.45)#496 |
| 8. | Oak Run | 6.2% | 0.98%(+5.27)#8 | 1.1%(+5.16)#541 |
| 9. | Havana | 6.1% | 0.98%(+5.10)#9 | 1.1%(+4.98)#566 |
| 10. | Blandinsville | 5.9% | 0.98%(+4.92)#10 | 1.1%(+4.81)#597 |
| 11. | Gillespie | 5.8% | 0.98%(+4.80)#11 | 1.1%(+4.69)#618 |
| 12. | Marietta | 5.6% | 0.98%(+4.58)#12 | 1.1%(+4.46)#658 |
| 13. | Astoria | 5.5% | 0.98%(+4.55)#13 | 1.1%(+4.43)#663 |
| 14. | Heritage Lake | 5.3% | 0.98%(+4.36)#14 | 1.1%(+4.24)#709 |
| 15. | Percy | 5.1% | 0.98%(+4.11)#15 | 1.1%(+3.99)#768 |
| 16. | Oakwood Hills | 4.9% | 0.98%(+3.94)#16 | 1.1%(+3.83)#809 |
| 17. | Lake Petersburg | 4.9% | 0.98%(+3.93)#17 | 1.1%(+3.82)#814 |
| 18. | Indian Head Park | 4.8% | 0.98%(+3.83)#18 | 1.1%(+3.72)#843 |
| 19. | Arbury Hills | 4.7% | 0.98%(+3.68)#19 | 1.1%(+3.57)#887 |
| 20. | Lerna | 4.5% | 0.98%(+3.57)#20 | 1.1%(+3.45)#930 |
| 21. | Long Point | 4.3% | 0.98%(+3.37)#21 | 1.1%(+3.26)#1,021 |
| 22. | Wadsworth | 4.2% | 0.98%(+3.20)#22 | 1.1%(+3.09)#1,088 |
| 23. | Mineral | 4.2% | 0.98%(+3.19)#23 | 1.1%(+3.08)#1,091 |
| 24. | Makanda | 4.1% | 0.98%(+3.08)#24 | 1.1%(+2.96)#1,135 |
| 25. | Plum Valley | 4.0% | 0.98%(+3.06)#25 | 1.1%(+2.95)#1,141 |
| 26. | Forrest | 4.0% | 0.98%(+3.06)#26 | 1.1%(+2.95)#1,144 |
| 27. | Champaign | 3.9% | 0.98%(+2.90)#27 | 1.1%(+2.79)#1,236 |
| 28. | Pesotum | 3.9% | 0.98%(+2.89)#28 | 1.1%(+2.78)#1,240 |
| 29. | Evanston | 3.9% | 0.98%(+2.88)#29 | 1.1%(+2.77)#1,244 |
| 30. | Spaulding | 3.8% | 0.98%(+2.78)#30 | 1.1%(+2.67)#1,292 |
| 31. | Twin Grove | 3.7% | 0.98%(+2.71)#31 | 1.1%(+2.60)#1,340 |
| 32. | Savoy | 3.6% | 0.98%(+2.66)#32 | 1.1%(+2.55)#1,375 |
| 33. | Forest Lake | 3.6% | 0.98%(+2.66)#33 | 1.1%(+2.54)#1,387 |
| 34. | Lomax | 3.6% | 0.98%(+2.59)#34 | 1.1%(+2.48)#1,419 |
| 35. | Galena | 3.6% | 0.98%(+2.58)#35 | 1.1%(+2.47)#1,434 |
| 36. | Fox River Grove | 3.5% | 0.98%(+2.55)#36 | 1.1%(+2.44)#1,454 |
| 37. | Riverwoods | 3.5% | 0.98%(+2.53)#37 | 1.1%(+2.42)#1,474 |
| 38. | Hawthorn Woods | 3.4% | 0.98%(+2.43)#38 | 1.1%(+2.32)#1,545 |
| 39. | Stonington | 3.4% | 0.98%(+2.40)#39 | 1.1%(+2.29)#1,558 |
| 40. | Hainesville | 3.4% | 0.98%(+2.40)#40 | 1.1%(+2.29)#1,562 |
| 41. | Fairmont City | 3.4% | 0.98%(+2.38)#41 | 1.1%(+2.27)#1,571 |
| 42. | Lily Lake | 3.3% | 0.98%(+2.35)#42 | 1.1%(+2.24)#1,593 |
| 43. | Brussels | 3.2% | 0.98%(+2.25)#43 | 1.1%(+2.13)#1,681 |
| 44. | Prestbury | 3.1% | 0.98%(+2.17)#44 | 1.1%(+2.05)#1,743 |
| 45. | Marquette Heights | 3.1% | 0.98%(+2.11)#45 | 1.1%(+2.00)#1,801 |
| 46. | Braceville | 3.1% | 0.98%(+2.08)#46 | 1.1%(+1.97)#1,836 |
| 47. | Ingalls Park | 3.1% | 0.98%(+2.08)#47 | 1.1%(+1.97)#1,841 |
| 48. | Leaf River | 2.9% | 0.98%(+1.94)#48 | 1.1%(+1.83)#1,951 |
| 49. | Sadorus | 2.9% | 0.98%(+1.89)#49 | 1.1%(+1.78)#1,991 |
| 50. | Oak Park | 2.8% | 0.98%(+1.87)#50 | 1.1%(+1.76)#2,021 |
| 51. | University Park | 2.8% | 0.98%(+1.84)#51 | 1.1%(+1.72)#2,066 |
| 52. | Kirkland | 2.8% | 0.98%(+1.81)#52 | 1.1%(+1.70)#2,104 |
| 53. | Cherry | 2.8% | 0.98%(+1.80)#53 | 1.1%(+1.69)#2,118 |
| 54. | River Forest | 2.8% | 0.98%(+1.79)#54 | 1.1%(+1.67)#2,135 |
| 55. | Carbondale | 2.7% | 0.98%(+1.77)#55 | 1.1%(+1.65)#2,161 |
| 56. | Libertyville | 2.7% | 0.98%(+1.77)#56 | 1.1%(+1.65)#2,162 |
| 57. | De Land | 2.7% | 0.98%(+1.72)#57 | 1.1%(+1.61)#2,221 |
| 58. | Byron | 2.7% | 0.98%(+1.70)#58 | 1.1%(+1.59)#2,241 |
| 59. | Holcomb | 2.7% | 0.98%(+1.69)#59 | 1.1%(+1.58)#2,252 |
| 60. | Shabbona | 2.7% | 0.98%(+1.68)#60 | 1.1%(+1.56)#2,275 |
| 61. | Ivesdale | 2.7% | 0.98%(+1.68)#61 | 1.1%(+1.56)#2,277 |
| 62. | Summerfield | 2.6% | 0.98%(+1.63)#62 | 1.1%(+1.52)#2,347 |
| 63. | Hammond | 2.6% | 0.98%(+1.63)#63 | 1.1%(+1.51)#2,352 |
| 64. | Philo | 2.6% | 0.98%(+1.60)#64 | 1.1%(+1.48)#2,396 |
| 65. | Claremont | 2.6% | 0.98%(+1.59)#65 | 1.1%(+1.47)#2,410 |
| 66. | Bishop Hill | 2.6% | 0.98%(+1.59)#66 | 1.1%(+1.47)#2,411 |
| 67. | Westmont | 2.6% | 0.98%(+1.58)#67 | 1.1%(+1.47)#2,418 |
| 68. | Third Lake | 2.6% | 0.98%(+1.58)#68 | 1.1%(+1.46)#2,425 |
| 69. | Northbrook | 2.5% | 0.98%(+1.57)#69 | 1.1%(+1.46)#2,437 |
| 70. | Morrison | 2.5% | 0.98%(+1.56)#70 | 1.1%(+1.45)#2,461 |
| 71. | Indian Creek | 2.5% | 0.98%(+1.55)#71 | 1.1%(+1.44)#2,479 |
| 72. | Gurnee | 2.5% | 0.98%(+1.54)#72 | 1.1%(+1.43)#2,490 |
| 73. | St David | 2.5% | 0.98%(+1.53)#73 | 1.1%(+1.42)#2,505 |
| 74. | Oneida | 2.5% | 0.98%(+1.49)#74 | 1.1%(+1.37)#2,581 |
| 75. | Johnston City | 2.5% | 0.98%(+1.48)#75 | 1.1%(+1.36)#2,596 |
| 76. | Dalzell | 2.4% | 0.98%(+1.47)#76 | 1.1%(+1.36)#2,609 |
| 77. | Lovington | 2.4% | 0.98%(+1.43)#77 | 1.1%(+1.32)#2,662 |
| 78. | Highland Park | 2.4% | 0.98%(+1.43)#78 | 1.1%(+1.32)#2,669 |
| 79. | Strawn | 2.4% | 0.98%(+1.40)#79 | 1.1%(+1.29)#2,723 |
| 80. | Rockdale | 2.4% | 0.98%(+1.40)#80 | 1.1%(+1.29)#2,725 |
| 81. | Highwood | 2.4% | 0.98%(+1.38)#81 | 1.1%(+1.27)#2,753 |
| 82. | Emden | 2.3% | 0.98%(+1.33)#82 | 1.1%(+1.22)#2,837 |
| 83. | Palos Park | 2.3% | 0.98%(+1.32)#83 | 1.1%(+1.20)#2,856 |
| 84. | Cherry Valley | 2.3% | 0.98%(+1.31)#84 | 1.1%(+1.20)#2,862 |
| 85. | Roscoe | 2.3% | 0.98%(+1.31)#85 | 1.1%(+1.19)#2,873 |
| 86. | Curran | 2.3% | 0.98%(+1.29)#86 | 1.1%(+1.18)#2,904 |
| 87. | Wyanet | 2.3% | 0.98%(+1.28)#87 | 1.1%(+1.16)#2,935 |
| 88. | Elburn | 2.2% | 0.98%(+1.26)#88 | 1.1%(+1.15)#2,972 |
| 89. | Garrett | 2.2% | 0.98%(+1.20)#89 | 1.1%(+1.08)#3,093 |
| 90. | Tower Lakes | 2.2% | 0.98%(+1.19)#90 | 1.1%(+1.08)#3,100 |
| 91. | Edwardsville | 2.2% | 0.98%(+1.17)#91 | 1.1%(+1.06)#3,130 |
| 92. | Addieville | 2.2% | 0.98%(+1.17)#92 | 1.1%(+1.06)#3,131 |
| 93. | Vernon Hills | 2.1% | 0.98%(+1.16)#93 | 1.1%(+1.05)#3,146 |
| 94. | Troy Grove | 2.1% | 0.98%(+1.12)#94 | 1.1%(+1.01)#3,230 |
| 95. | Energy | 2.1% | 0.98%(+1.12)#95 | 1.1%(+1.00)#3,236 |
| 96. | Greenview | 2.1% | 0.98%(+1.11)#96 | 1.1%(+0.997)#3,249 |
| 97. | Fox Lake Hills | 2.1% | 0.98%(+1.11)#97 | 1.1%(+0.996)#3,251 |
| 98. | St Charles | 2.1% | 0.98%(+1.10)#98 | 1.1%(+0.988)#3,268 |
| 99. | Broadwell | 2.0% | 0.98%(+1.06)#99 | 1.1%(+0.950)#3,347 |
| 100. | Morris | 2.0% | 0.98%(+1.03)#100 | 1.1%(+0.921)#3,402 |
Common Questions
What are the Top 10 Cities with the Highest Percentage of Population Employed in Life, Physical & Social Science in Illinois?
Top 10 Cities with the Highest Percentage of Population Employed in Life, Physical & Social Science in Illinois are:
#1
20.9%
#2
18.5%
#3
8.0%
#4
7.5%
#5
6.6%
#6
6.5%
#7
6.2%
#8
6.1%
#9
5.9%
#10
5.8%
What city has the Highest Percentage of Population Employed in Life, Physical & Social Science in Illinois?
Browning has the Highest Percentage of Population Employed in Life, Physical & Social Science in Illinois with 20.9%.
What is the Percentage of Population Employed in Life, Physical & Social Science in the State of Illinois?
Percentage of Population Employed in Life, Physical & Social Science in Illinois is 0.98%.
What is the Percentage of Population Employed in Life, Physical & Social Science in the United States?
Percentage of Population Employed in Life, Physical & Social Science in the United States is 1.1%.