Cities with the Highest Percentage of Population Employed in Life, Physical & Social Science in South Dakota
RELATED REPORTS & OPTIONS
Life, Physical & Social Science
South Dakota
Compare Cities
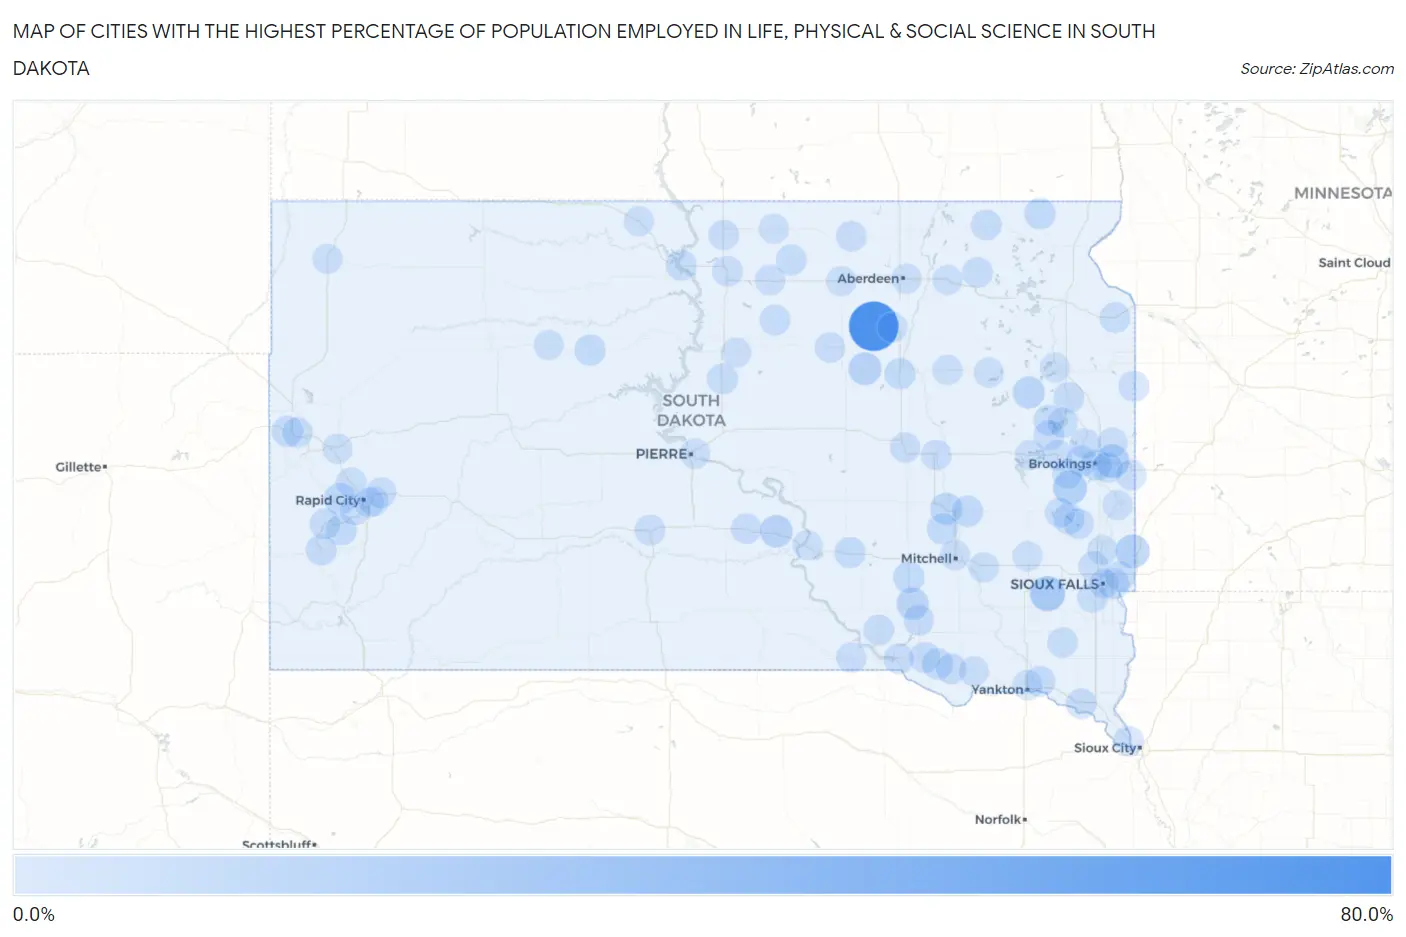
Map of Cities with the Highest Percentage of Population Employed in Life, Physical & Social Science in South Dakota
0.0%
80.0%
Cities with the Highest Percentage of Population Employed in Life, Physical & Social Science in South Dakota
| City | % Employed | vs State | vs National | |
| 1. | Chelsea | 75.7% | 1.2%(+74.5)#1 | 1.1%(+74.6)#4 |
| 2. | Oahe Acres | 19.7% | 1.2%(+18.6)#2 | 1.1%(+18.6)#77 |
| 3. | Monroe | 19.1% | 1.2%(+17.9)#3 | 1.1%(+18.0)#79 |
| 4. | Sherman | 14.3% | 1.2%(+13.1)#4 | 1.1%(+13.2)#130 |
| 5. | Nunda | 14.3% | 1.2%(+13.1)#5 | 1.1%(+13.2)#132 |
| 6. | Bushnell | 13.3% | 1.2%(+12.2)#6 | 1.1%(+12.2)#150 |
| 7. | Rockham | 11.1% | 1.2%(+9.95)#7 | 1.1%(+10.0)#198 |
| 8. | Reliance | 10.3% | 1.2%(+9.10)#8 | 1.1%(+9.17)#218 |
| 9. | Corsica | 8.5% | 1.2%(+7.31)#9 | 1.1%(+7.38)#312 |
| 10. | Hazel | 8.1% | 1.2%(+6.90)#10 | 1.1%(+6.97)#336 |
| 11. | Forestburg | 7.4% | 1.2%(+6.25)#11 | 1.1%(+6.32)#386 |
| 12. | Johnson Siding | 6.9% | 1.2%(+5.71)#12 | 1.1%(+5.78)#447 |
| 13. | Artesian | 5.8% | 1.2%(+4.61)#13 | 1.1%(+4.68)#620 |
| 14. | Stickney | 5.6% | 1.2%(+4.45)#14 | 1.1%(+4.52)#648 |
| 15. | Veblen | 5.3% | 1.2%(+4.10)#15 | 1.1%(+4.17)#731 |
| 16. | North Spearfish | 5.2% | 1.2%(+4.01)#16 | 1.1%(+4.08)#750 |
| 17. | Lake Madison | 4.8% | 1.2%(+3.68)#17 | 1.1%(+3.75)#832 |
| 18. | Letcher | 4.7% | 1.2%(+3.49)#18 | 1.1%(+3.56)#891 |
| 19. | Brookings | 4.6% | 1.2%(+3.48)#19 | 1.1%(+3.55)#896 |
| 20. | Dante | 4.6% | 1.2%(+3.46)#20 | 1.1%(+3.52)#905 |
| 21. | Kimball | 4.6% | 1.2%(+3.40)#21 | 1.1%(+3.47)#923 |
| 22. | Redfield | 4.5% | 1.2%(+3.33)#22 | 1.1%(+3.40)#954 |
| 23. | North Eagle Butte | 4.5% | 1.2%(+3.33)#23 | 1.1%(+3.40)#956 |
| 24. | Keystone | 4.2% | 1.2%(+3.03)#24 | 1.1%(+3.10)#1,084 |
| 25. | Volga | 4.1% | 1.2%(+2.90)#25 | 1.1%(+2.96)#1,133 |
| 26. | Pine Lakes Addition | 4.0% | 1.2%(+2.86)#26 | 1.1%(+2.93)#1,149 |
| 27. | Agar | 3.8% | 1.2%(+2.69)#27 | 1.1%(+2.76)#1,252 |
| 28. | Wagner | 3.7% | 1.2%(+2.53)#28 | 1.1%(+2.59)#1,343 |
| 29. | Mobridge | 3.6% | 1.2%(+2.49)#29 | 1.1%(+2.56)#1,369 |
| 30. | Custer | 3.5% | 1.2%(+2.37)#30 | 1.1%(+2.44)#1,452 |
| 31. | Tolstoy | 3.4% | 1.2%(+2.29)#31 | 1.1%(+2.36)#1,522 |
| 32. | Armour | 3.3% | 1.2%(+2.17)#32 | 1.1%(+2.24)#1,584 |
| 33. | Mission Hill | 3.3% | 1.2%(+2.15)#33 | 1.1%(+2.22)#1,606 |
| 34. | Avon | 3.3% | 1.2%(+2.14)#34 | 1.1%(+2.21)#1,617 |
| 35. | Vermillion | 3.3% | 1.2%(+2.13)#35 | 1.1%(+2.20)#1,622 |
| 36. | Castlewood | 3.3% | 1.2%(+2.13)#36 | 1.1%(+2.20)#1,626 |
| 37. | Hosmer | 3.2% | 1.2%(+2.07)#37 | 1.1%(+2.13)#1,680 |
| 38. | Hill City | 3.2% | 1.2%(+2.06)#38 | 1.1%(+2.13)#1,690 |
| 39. | Lake Norden | 3.0% | 1.2%(+1.85)#39 | 1.1%(+1.92)#1,876 |
| 40. | Britton | 3.0% | 1.2%(+1.79)#40 | 1.1%(+1.86)#1,924 |
| 41. | Geddes | 2.8% | 1.2%(+1.66)#41 | 1.1%(+1.73)#2,060 |
| 42. | Pierpont | 2.8% | 1.2%(+1.62)#42 | 1.1%(+1.69)#2,122 |
| 43. | Milbank | 2.8% | 1.2%(+1.59)#43 | 1.1%(+1.66)#2,149 |
| 44. | Aurora | 2.7% | 1.2%(+1.51)#44 | 1.1%(+1.58)#2,249 |
| 45. | Mound City | 2.6% | 1.2%(+1.47)#45 | 1.1%(+1.54)#2,312 |
| 46. | Elkton | 2.6% | 1.2%(+1.40)#46 | 1.1%(+1.47)#2,406 |
| 47. | Badger | 2.6% | 1.2%(+1.40)#47 | 1.1%(+1.47)#2,409 |
| 48. | Kennebec | 2.5% | 1.2%(+1.37)#48 | 1.1%(+1.44)#2,473 |
| 49. | Murdo | 2.5% | 1.2%(+1.36)#49 | 1.1%(+1.43)#2,488 |
| 50. | Selby | 2.5% | 1.2%(+1.33)#50 | 1.1%(+1.40)#2,535 |
| 51. | Leola | 2.5% | 1.2%(+1.33)#51 | 1.1%(+1.40)#2,541 |
| 52. | Bonesteel | 2.2% | 1.2%(+1.09)#52 | 1.1%(+1.16)#2,954 |
| 53. | Pickstown | 2.2% | 1.2%(+1.06)#53 | 1.1%(+1.13)#3,001 |
| 54. | Huron | 2.2% | 1.2%(+1.02)#54 | 1.1%(+1.09)#3,072 |
| 55. | Gary | 2.2% | 1.2%(+0.990)#55 | 1.1%(+1.06)#3,132 |
| 56. | North Sioux City | 2.0% | 1.2%(+0.889)#56 | 1.1%(+0.958)#3,324 |
| 57. | Brant Lake | 2.0% | 1.2%(+0.881)#57 | 1.1%(+0.950)#3,350 |
| 58. | Bowdle | 2.0% | 1.2%(+0.860)#58 | 1.1%(+0.929)#3,390 |
| 59. | Crooks | 2.0% | 1.2%(+0.832)#59 | 1.1%(+0.901)#3,442 |
| 60. | Spearfish | 2.0% | 1.2%(+0.824)#60 | 1.1%(+0.893)#3,456 |
| 61. | Colonial Pine Hills | 1.9% | 1.2%(+0.787)#61 | 1.1%(+0.857)#3,548 |
| 62. | Tea | 1.9% | 1.2%(+0.778)#62 | 1.1%(+0.847)#3,567 |
| 63. | Arlington | 1.9% | 1.2%(+0.718)#63 | 1.1%(+0.787)#3,722 |
| 64. | Box Elder | 1.9% | 1.2%(+0.707)#64 | 1.1%(+0.776)#3,750 |
| 65. | Summerset | 1.9% | 1.2%(+0.701)#65 | 1.1%(+0.770)#3,764 |
| 66. | Faulkton | 1.9% | 1.2%(+0.698)#66 | 1.1%(+0.767)#3,772 |
| 67. | Alexandria | 1.7% | 1.2%(+0.568)#67 | 1.1%(+0.637)#4,127 |
| 68. | Wolsey | 1.7% | 1.2%(+0.559)#68 | 1.1%(+0.628)#4,165 |
| 69. | Lake Poinsett | 1.7% | 1.2%(+0.544)#69 | 1.1%(+0.614)#4,204 |
| 70. | Viborg | 1.6% | 1.2%(+0.475)#70 | 1.1%(+0.544)#4,389 |
| 71. | Brandon | 1.6% | 1.2%(+0.423)#71 | 1.1%(+0.492)#4,548 |
| 72. | Bruce | 1.6% | 1.2%(+0.415)#72 | 1.1%(+0.484)#4,577 |
| 73. | Gettysburg | 1.4% | 1.2%(+0.191)#73 | 1.1%(+0.260)#5,440 |
| 74. | Doland | 1.3% | 1.2%(+0.173)#74 | 1.1%(+0.242)#5,517 |
| 75. | Baltic | 1.3% | 1.2%(+0.134)#75 | 1.1%(+0.203)#5,706 |
| 76. | Northville | 1.3% | 1.2%(+0.106)#76 | 1.1%(+0.175)#5,841 |
| 77. | Ipswich | 1.2% | 1.2%(+0.059)#77 | 1.1%(+0.129)#6,030 |
| 78. | Mclaughlin | 1.2% | 1.2%(+0.059)#78 | 1.1%(+0.129)#6,033 |
| 79. | Sinai | 1.2% | 1.2%(+0.045)#79 | 1.1%(+0.114)#6,108 |
| 80. | Lake Preston | 1.2% | 1.2%(+0.026)#80 | 1.1%(+0.095)#6,201 |
| 81. | Rapid City | 1.2% | 1.2%(+0.013)#81 | 1.1%(+0.083)#6,269 |
| 82. | Tyndall | 1.1% | 1.2%(-0.011)#82 | 1.1%(+0.059)#6,367 |
| 83. | Aberdeen | 1.1% | 1.2%(-0.030)#83 | 1.1%(+0.040)#6,461 |
| 84. | Eureka | 1.1% | 1.2%(-0.036)#84 | 1.1%(+0.033)#6,493 |
| 85. | Pierre | 1.1% | 1.2%(-0.065)#85 | 1.1%(+0.004)#6,673 |
| 86. | Clark | 1.1% | 1.2%(-0.071)#86 | 1.1%(-0.002)#6,703 |
| 87. | Sturgis | 1.1% | 1.2%(-0.082)#87 | 1.1%(-0.012)#6,762 |
| 88. | Rapid Valley | 1.1% | 1.2%(-0.091)#88 | 1.1%(-0.021)#6,795 |
| 89. | Madison | 1.1% | 1.2%(-0.099)#89 | 1.1%(-0.030)#6,841 |
| 90. | Dupree | 1.0% | 1.2%(-0.113)#90 | 1.1%(-0.044)#6,899 |
| 91. | White | 1.0% | 1.2%(-0.143)#91 | 1.1%(-0.074)#7,064 |
| 92. | Groton | 1.0% | 1.2%(-0.154)#92 | 1.1%(-0.085)#7,136 |
| 93. | Buffalo | 0.98% | 1.2%(-0.180)#93 | 1.1%(-0.111)#7,303 |
| 94. | Flandreau | 0.97% | 1.2%(-0.194)#94 | 1.1%(-0.125)#7,393 |
| 95. | Yankton | 0.97% | 1.2%(-0.195)#95 | 1.1%(-0.125)#7,399 |
| 96. | Watertown | 0.96% | 1.2%(-0.195)#96 | 1.1%(-0.126)#7,402 |
| 97. | Mitchell | 0.96% | 1.2%(-0.200)#97 | 1.1%(-0.131)#7,439 |
| 98. | Chamberlain | 0.93% | 1.2%(-0.231)#98 | 1.1%(-0.162)#7,625 |
| 99. | Sioux Falls | 0.89% | 1.2%(-0.268)#99 | 1.1%(-0.199)#7,873 |
| 100. | Salem | 0.88% | 1.2%(-0.280)#100 | 1.1%(-0.211)#7,951 |
Common Questions
What are the Top 10 Cities with the Highest Percentage of Population Employed in Life, Physical & Social Science in South Dakota?
Top 10 Cities with the Highest Percentage of Population Employed in Life, Physical & Social Science in South Dakota are:
What city has the Highest Percentage of Population Employed in Life, Physical & Social Science in South Dakota?
Chelsea has the Highest Percentage of Population Employed in Life, Physical & Social Science in South Dakota with 75.7%.
What is the Percentage of Population Employed in Life, Physical & Social Science in the State of South Dakota?
Percentage of Population Employed in Life, Physical & Social Science in South Dakota is 1.2%.
What is the Percentage of Population Employed in Life, Physical & Social Science in the United States?
Percentage of Population Employed in Life, Physical & Social Science in the United States is 1.1%.