Cities with the Highest Percentage of Population Employed in Life, Physical & Social Science in Wisconsin
RELATED REPORTS & OPTIONS
Life, Physical & Social Science
Wisconsin
Compare Cities
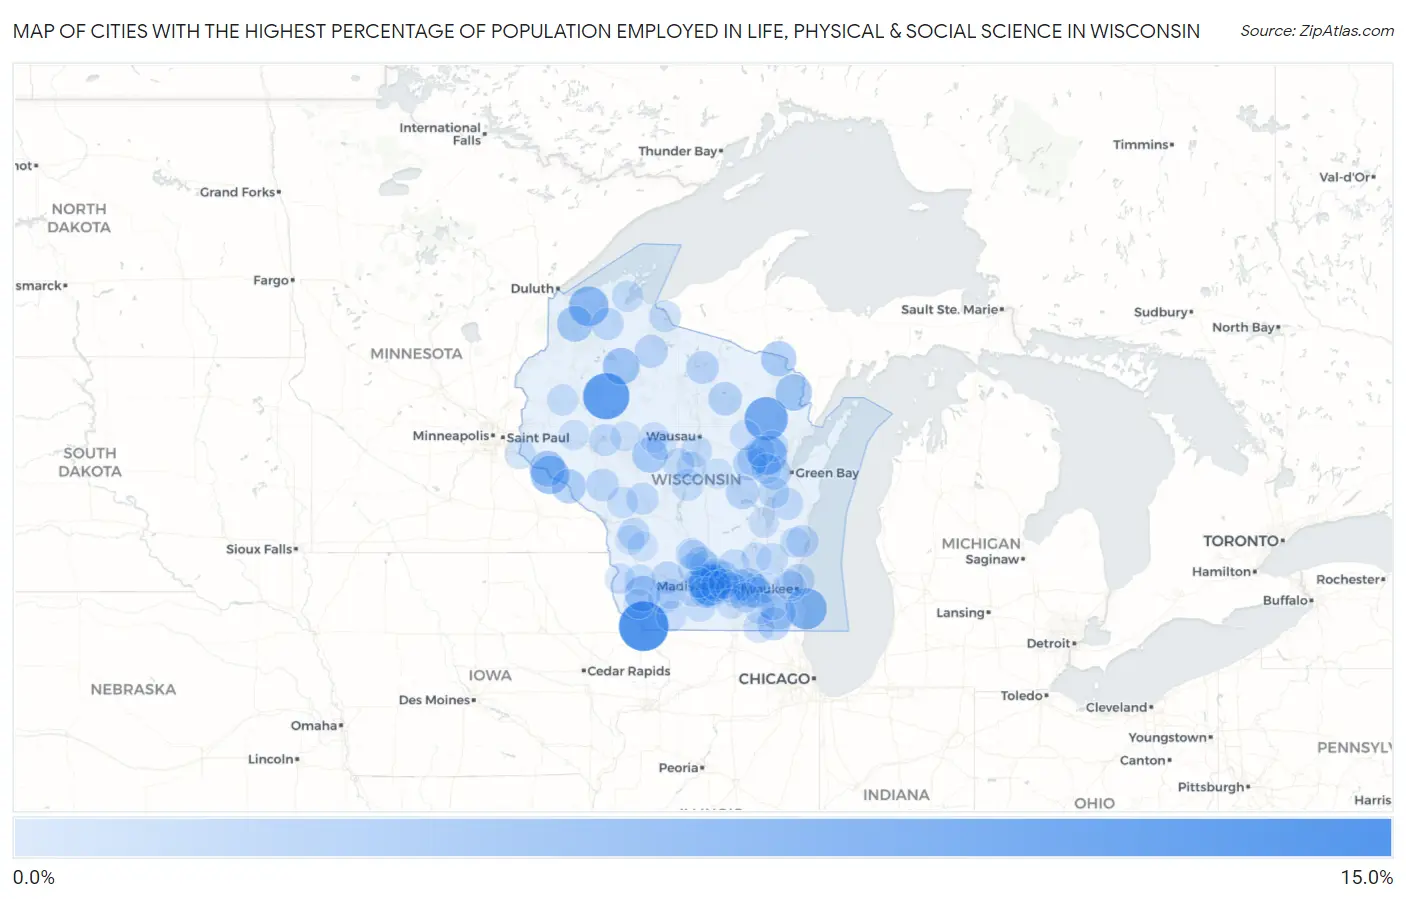
Map of Cities with the Highest Percentage of Population Employed in Life, Physical & Social Science in Wisconsin
0.0%
15.0%
Cities with the Highest Percentage of Population Employed in Life, Physical & Social Science in Wisconsin
| City | % Employed | vs State | vs National | |
| 1. | Sandy Hook | 14.7% | 1.2%(+13.5)#1 | 1.1%(+13.6)#122 |
| 2. | Bruce | 12.5% | 1.2%(+11.3)#2 | 1.1%(+11.4)#166 |
| 3. | Mountain | 10.4% | 1.2%(+9.28)#3 | 1.1%(+9.34)#214 |
| 4. | Shorewood Hills | 9.0% | 1.2%(+7.89)#4 | 1.1%(+7.96)#280 |
| 5. | Wind Point | 8.9% | 1.2%(+7.79)#5 | 1.1%(+7.86)#286 |
| 6. | Brule | 8.0% | 1.2%(+6.89)#6 | 1.1%(+6.96)#338 |
| 7. | Bonduel | 7.7% | 1.2%(+6.58)#7 | 1.1%(+6.65)#360 |
| 8. | Stockholm | 7.1% | 1.2%(+5.98)#8 | 1.1%(+6.05)#417 |
| 9. | Winter | 6.1% | 1.2%(+4.90)#9 | 1.1%(+4.97)#571 |
| 10. | Amberg | 5.9% | 1.2%(+4.72)#10 | 1.1%(+4.79)#601 |
| 11. | Maiden Rock | 5.5% | 1.2%(+4.30)#11 | 1.1%(+4.36)#681 |
| 12. | Solon Springs | 5.4% | 1.2%(+4.25)#12 | 1.1%(+4.32)#692 |
| 13. | Shopiere | 5.4% | 1.2%(+4.20)#13 | 1.1%(+4.27)#704 |
| 14. | Middleton | 5.3% | 1.2%(+4.18)#14 | 1.1%(+4.25)#706 |
| 15. | Fennimore | 5.3% | 1.2%(+4.17)#15 | 1.1%(+4.24)#710 |
| 16. | Loyal | 5.3% | 1.2%(+4.11)#16 | 1.1%(+4.18)#728 |
| 17. | Florence | 5.1% | 1.2%(+3.99)#17 | 1.1%(+4.06)#757 |
| 18. | Helenville | 5.0% | 1.2%(+3.88)#18 | 1.1%(+3.95)#778 |
| 19. | Madison | 4.6% | 1.2%(+3.41)#19 | 1.1%(+3.48)#920 |
| 20. | Alma | 4.5% | 1.2%(+3.39)#20 | 1.1%(+3.45)#926 |
| 21. | Seymour | 4.5% | 1.2%(+3.33)#21 | 1.1%(+3.40)#955 |
| 22. | Maple Bluff | 4.4% | 1.2%(+3.23)#22 | 1.1%(+3.30)#999 |
| 23. | Rochester | 4.4% | 1.2%(+3.21)#23 | 1.1%(+3.28)#1,010 |
| 24. | Clintonville | 4.0% | 1.2%(+2.87)#24 | 1.1%(+2.94)#1,146 |
| 25. | Elcho | 4.0% | 1.2%(+2.84)#25 | 1.1%(+2.91)#1,169 |
| 26. | Johnson Creek | 3.9% | 1.2%(+2.79)#26 | 1.1%(+2.85)#1,197 |
| 27. | Fremont | 3.8% | 1.2%(+2.67)#27 | 1.1%(+2.74)#1,257 |
| 28. | Sun Prairie | 3.7% | 1.2%(+2.53)#28 | 1.1%(+2.59)#1,344 |
| 29. | Lake Ivanhoe | 3.6% | 1.2%(+2.49)#29 | 1.1%(+2.56)#1,373 |
| 30. | Butternut | 3.6% | 1.2%(+2.43)#30 | 1.1%(+2.50)#1,403 |
| 31. | Lake Ripley | 3.6% | 1.2%(+2.42)#31 | 1.1%(+2.49)#1,410 |
| 32. | Lake Tomahawk | 3.5% | 1.2%(+2.37)#32 | 1.1%(+2.44)#1,461 |
| 33. | Whitehall | 3.4% | 1.2%(+2.21)#33 | 1.1%(+2.28)#1,563 |
| 34. | Drummond | 3.3% | 1.2%(+2.10)#34 | 1.1%(+2.17)#1,646 |
| 35. | Lone Rock | 3.2% | 1.2%(+2.04)#35 | 1.1%(+2.11)#1,695 |
| 36. | Waunakee | 3.1% | 1.2%(+1.94)#36 | 1.1%(+2.01)#1,794 |
| 37. | Gibbsville | 3.1% | 1.2%(+1.90)#37 | 1.1%(+1.97)#1,837 |
| 38. | Fox Point | 3.0% | 1.2%(+1.89)#38 | 1.1%(+1.96)#1,851 |
| 39. | Potter | 3.0% | 1.2%(+1.83)#39 | 1.1%(+1.89)#1,897 |
| 40. | Millston | 3.0% | 1.2%(+1.83)#40 | 1.1%(+1.89)#1,898 |
| 41. | Lake Wissota | 2.9% | 1.2%(+1.79)#41 | 1.1%(+1.86)#1,928 |
| 42. | Lake Mills | 2.9% | 1.2%(+1.77)#42 | 1.1%(+1.83)#1,945 |
| 43. | Cashton | 2.9% | 1.2%(+1.70)#43 | 1.1%(+1.77)#2,003 |
| 44. | Montreal | 2.8% | 1.2%(+1.69)#44 | 1.1%(+1.76)#2,015 |
| 45. | Linden | 2.8% | 1.2%(+1.67)#45 | 1.1%(+1.74)#2,032 |
| 46. | Lake Wisconsin | 2.8% | 1.2%(+1.66)#46 | 1.1%(+1.73)#2,062 |
| 47. | Fitchburg | 2.8% | 1.2%(+1.61)#47 | 1.1%(+1.68)#2,129 |
| 48. | Port Edwards | 2.8% | 1.2%(+1.60)#48 | 1.1%(+1.67)#2,137 |
| 49. | Kimberly | 2.8% | 1.2%(+1.60)#49 | 1.1%(+1.67)#2,140 |
| 50. | Rome | 2.7% | 1.2%(+1.53)#50 | 1.1%(+1.60)#2,232 |
| 51. | Mosinee | 2.7% | 1.2%(+1.50)#51 | 1.1%(+1.57)#2,256 |
| 52. | Prairie Du Sac | 2.7% | 1.2%(+1.50)#52 | 1.1%(+1.57)#2,257 |
| 53. | Deforest | 2.7% | 1.2%(+1.50)#53 | 1.1%(+1.57)#2,268 |
| 54. | Pulcifer | 2.6% | 1.2%(+1.47)#54 | 1.1%(+1.54)#2,310 |
| 55. | Lodi | 2.6% | 1.2%(+1.46)#55 | 1.1%(+1.53)#2,327 |
| 56. | West Baraboo | 2.6% | 1.2%(+1.42)#56 | 1.1%(+1.48)#2,393 |
| 57. | Almena | 2.6% | 1.2%(+1.40)#57 | 1.1%(+1.47)#2,423 |
| 58. | Melrose | 2.6% | 1.2%(+1.40)#58 | 1.1%(+1.46)#2,426 |
| 59. | Mission | 2.5% | 1.2%(+1.34)#59 | 1.1%(+1.41)#2,523 |
| 60. | Washburn | 2.5% | 1.2%(+1.34)#60 | 1.1%(+1.41)#2,526 |
| 61. | Boscobel | 2.5% | 1.2%(+1.33)#61 | 1.1%(+1.39)#2,544 |
| 62. | Embarrass | 2.5% | 1.2%(+1.33)#62 | 1.1%(+1.39)#2,547 |
| 63. | New Glarus | 2.5% | 1.2%(+1.30)#63 | 1.1%(+1.37)#2,593 |
| 64. | Mount Horeb | 2.4% | 1.2%(+1.29)#64 | 1.1%(+1.36)#2,606 |
| 65. | Columbus | 2.4% | 1.2%(+1.29)#65 | 1.1%(+1.35)#2,613 |
| 66. | Auburndale | 2.4% | 1.2%(+1.28)#66 | 1.1%(+1.35)#2,622 |
| 67. | Allenton | 2.4% | 1.2%(+1.27)#67 | 1.1%(+1.34)#2,628 |
| 68. | Prescott | 2.4% | 1.2%(+1.26)#68 | 1.1%(+1.33)#2,650 |
| 69. | Verona | 2.4% | 1.2%(+1.25)#69 | 1.1%(+1.32)#2,670 |
| 70. | Cross Plains | 2.3% | 1.2%(+1.16)#70 | 1.1%(+1.23)#2,827 |
| 71. | Walworth | 2.3% | 1.2%(+1.16)#71 | 1.1%(+1.22)#2,832 |
| 72. | Monona | 2.3% | 1.2%(+1.15)#72 | 1.1%(+1.22)#2,835 |
| 73. | Wauwatosa | 2.2% | 1.2%(+1.01)#73 | 1.1%(+1.08)#3,095 |
| 74. | Adell | 2.2% | 1.2%(+0.996)#74 | 1.1%(+1.06)#3,123 |
| 75. | Summit | 2.1% | 1.2%(+0.976)#75 | 1.1%(+1.04)#3,157 |
| 76. | Darlington | 2.1% | 1.2%(+0.972)#76 | 1.1%(+1.04)#3,166 |
| 77. | Horicon | 2.1% | 1.2%(+0.972)#77 | 1.1%(+1.04)#3,167 |
| 78. | Lauderdale Lakes | 2.1% | 1.2%(+0.951)#78 | 1.1%(+1.02)#3,206 |
| 79. | Deerfield | 2.1% | 1.2%(+0.935)#79 | 1.1%(+1.00)#3,240 |
| 80. | Curtiss | 2.0% | 1.2%(+0.882)#80 | 1.1%(+0.950)#3,343 |
| 81. | Neopit | 2.0% | 1.2%(+0.871)#81 | 1.1%(+0.940)#3,368 |
| 82. | Eastman | 2.0% | 1.2%(+0.868)#82 | 1.1%(+0.936)#3,372 |
| 83. | Nichols | 2.0% | 1.2%(+0.868)#83 | 1.1%(+0.936)#3,374 |
| 84. | Van Dyne | 2.0% | 1.2%(+0.864)#84 | 1.1%(+0.932)#3,380 |
| 85. | Dodgeville | 2.0% | 1.2%(+0.860)#85 | 1.1%(+0.929)#3,394 |
| 86. | Cottage Grove | 2.0% | 1.2%(+0.850)#86 | 1.1%(+0.918)#3,405 |
| 87. | Nelsonville | 2.0% | 1.2%(+0.841)#87 | 1.1%(+0.909)#3,427 |
| 88. | Lancaster | 2.0% | 1.2%(+0.834)#88 | 1.1%(+0.902)#3,439 |
| 89. | Potter Lake | 2.0% | 1.2%(+0.832)#89 | 1.1%(+0.900)#3,443 |
| 90. | Shawano | 2.0% | 1.2%(+0.799)#90 | 1.1%(+0.868)#3,525 |
| 91. | Edgerton | 1.9% | 1.2%(+0.784)#91 | 1.1%(+0.852)#3,555 |
| 92. | Baraboo | 1.9% | 1.2%(+0.772)#92 | 1.1%(+0.841)#3,582 |
| 93. | Fort Atkinson | 1.9% | 1.2%(+0.772)#93 | 1.1%(+0.841)#3,583 |
| 94. | Stanley | 1.9% | 1.2%(+0.760)#94 | 1.1%(+0.828)#3,609 |
| 95. | Tainter Lake | 1.9% | 1.2%(+0.732)#95 | 1.1%(+0.800)#3,683 |
| 96. | Butler | 1.9% | 1.2%(+0.707)#96 | 1.1%(+0.776)#3,752 |
| 97. | La Farge | 1.9% | 1.2%(+0.706)#97 | 1.1%(+0.775)#3,756 |
| 98. | Westby | 1.9% | 1.2%(+0.694)#98 | 1.1%(+0.762)#3,785 |
| 99. | Junction City | 1.9% | 1.2%(+0.693)#99 | 1.1%(+0.761)#3,792 |
| 100. | Unity | 1.8% | 1.2%(+0.684)#100 | 1.1%(+0.752)#3,817 |
Common Questions
What are the Top 10 Cities with the Highest Percentage of Population Employed in Life, Physical & Social Science in Wisconsin?
Top 10 Cities with the Highest Percentage of Population Employed in Life, Physical & Social Science in Wisconsin are:
#1
14.7%
#2
12.5%
#3
10.4%
#4
9.0%
#5
8.9%
#6
8.0%
#7
7.7%
#8
7.1%
#9
6.1%
#10
5.9%
What city has the Highest Percentage of Population Employed in Life, Physical & Social Science in Wisconsin?
Sandy Hook has the Highest Percentage of Population Employed in Life, Physical & Social Science in Wisconsin with 14.7%.
What is the Percentage of Population Employed in Life, Physical & Social Science in the State of Wisconsin?
Percentage of Population Employed in Life, Physical & Social Science in Wisconsin is 1.2%.
What is the Percentage of Population Employed in Life, Physical & Social Science in the United States?
Percentage of Population Employed in Life, Physical & Social Science in the United States is 1.1%.