Cities with the Highest Percentage of Population Employed in Life, Physical & Social Science in Utah
RELATED REPORTS & OPTIONS
Life, Physical & Social Science
Utah
Compare Cities
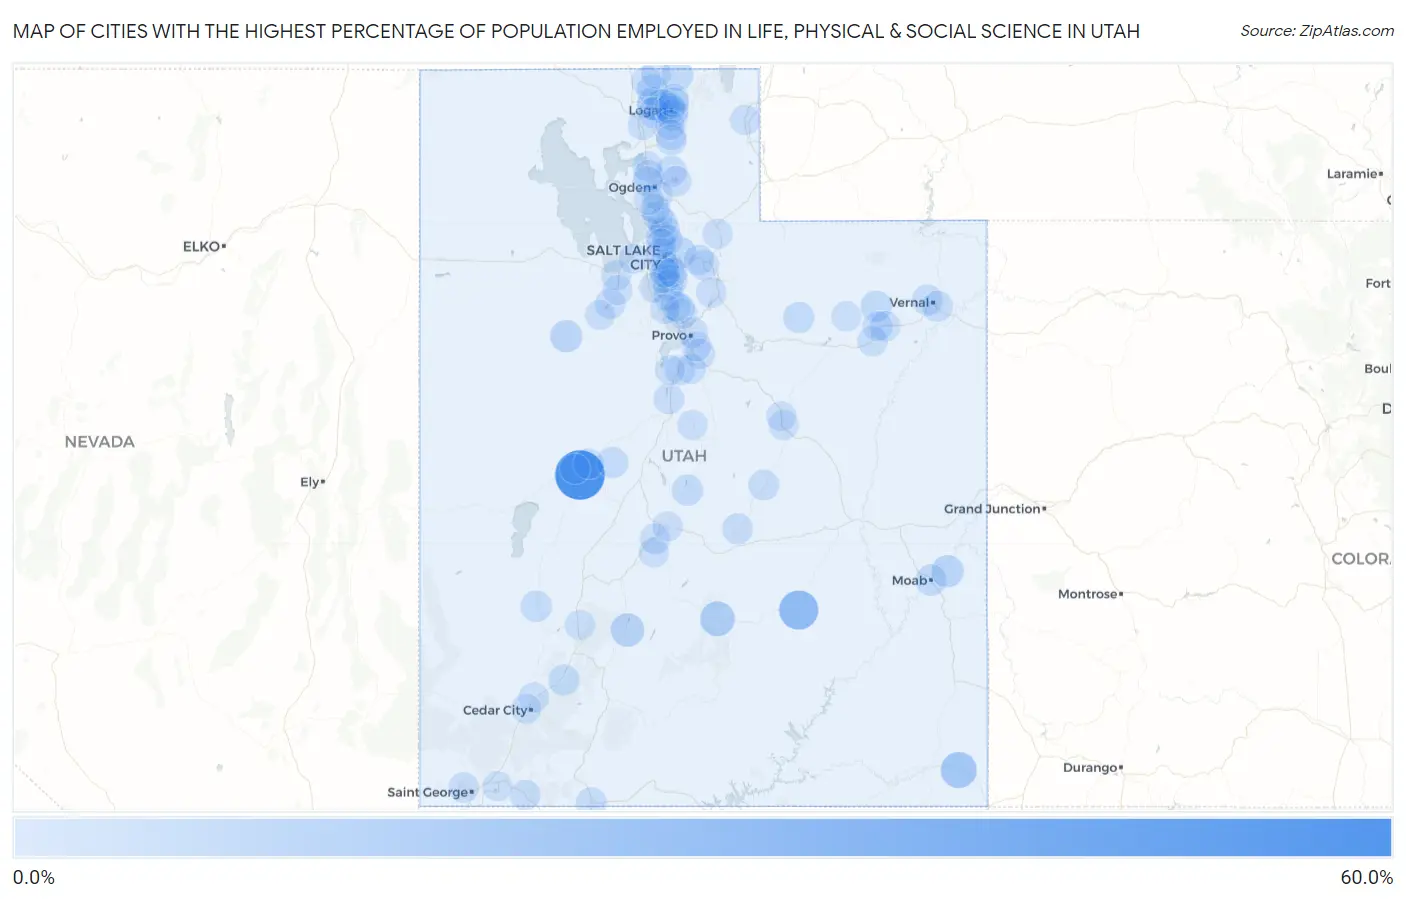
Map of Cities with the Highest Percentage of Population Employed in Life, Physical & Social Science in Utah
0.0%
60.0%
Cities with the Highest Percentage of Population Employed in Life, Physical & Social Science in Utah
| City | % Employed | vs State | vs National | |
| 1. | Oasis | 55.0% | 1.0%(+54.0)#1 | 1.1%(+53.9)#11 |
| 2. | Hanksville | 25.3% | 1.0%(+24.2)#2 | 1.1%(+24.2)#52 |
| 3. | Montezuma Creek | 16.4% | 1.0%(+15.4)#3 | 1.1%(+15.3)#101 |
| 4. | Torrey | 12.8% | 1.0%(+11.8)#4 | 1.1%(+11.7)#162 |
| 5. | Benson | 9.7% | 1.0%(+8.65)#5 | 1.1%(+8.59)#243 |
| 6. | Peter | 9.3% | 1.0%(+8.30)#6 | 1.1%(+8.23)#264 |
| 7. | Junction | 9.3% | 1.0%(+8.24)#7 | 1.1%(+8.17)#267 |
| 8. | Castle Valley | 6.4% | 1.0%(+5.39)#8 | 1.1%(+5.33)#511 |
| 9. | Dugway | 6.1% | 1.0%(+5.09)#9 | 1.1%(+5.02)#559 |
| 10. | Emigration Canyon | 5.1% | 1.0%(+4.10)#10 | 1.1%(+4.03)#763 |
| 11. | Cove | 4.8% | 1.0%(+3.80)#11 | 1.1%(+3.73)#838 |
| 12. | Moab | 4.0% | 1.0%(+3.00)#12 | 1.1%(+2.93)#1,147 |
| 13. | Neola | 4.0% | 1.0%(+3.00)#13 | 1.1%(+2.93)#1,148 |
| 14. | Sterling | 4.0% | 1.0%(+2.94)#14 | 1.1%(+2.88)#1,189 |
| 15. | Milford | 3.9% | 1.0%(+2.89)#15 | 1.1%(+2.82)#1,219 |
| 16. | Newton | 3.6% | 1.0%(+2.61)#16 | 1.1%(+2.54)#1,388 |
| 17. | Oak City | 3.4% | 1.0%(+2.34)#17 | 1.1%(+2.28)#1,568 |
| 18. | Paragonah | 3.2% | 1.0%(+2.22)#18 | 1.1%(+2.15)#1,664 |
| 19. | Tabiona | 3.1% | 1.0%(+2.10)#19 | 1.1%(+2.03)#1,770 |
| 20. | Providence | 3.1% | 1.0%(+2.08)#20 | 1.1%(+2.01)#1,797 |
| 21. | Maeser | 3.0% | 1.0%(+1.95)#21 | 1.1%(+1.89)#1,899 |
| 22. | River Heights | 2.9% | 1.0%(+1.91)#22 | 1.1%(+1.84)#1,935 |
| 23. | Naples | 2.8% | 1.0%(+1.81)#23 | 1.1%(+1.75)#2,028 |
| 24. | Wolf Creek | 2.7% | 1.0%(+1.72)#24 | 1.1%(+1.65)#2,163 |
| 25. | Mendon | 2.7% | 1.0%(+1.68)#25 | 1.1%(+1.61)#2,219 |
| 26. | Kanab | 2.5% | 1.0%(+1.44)#26 | 1.1%(+1.37)#2,578 |
| 27. | Castle Dale | 2.4% | 1.0%(+1.37)#27 | 1.1%(+1.30)#2,692 |
| 28. | Millcreek | 2.3% | 1.0%(+1.31)#28 | 1.1%(+1.24)#2,802 |
| 29. | Emery | 2.3% | 1.0%(+1.26)#29 | 1.1%(+1.19)#2,872 |
| 30. | Avon | 2.2% | 1.0%(+1.19)#30 | 1.1%(+1.12)#3,016 |
| 31. | Sigurd | 2.2% | 1.0%(+1.17)#31 | 1.1%(+1.10)#3,049 |
| 32. | Delta | 2.2% | 1.0%(+1.17)#32 | 1.1%(+1.10)#3,053 |
| 33. | Snyderville | 2.2% | 1.0%(+1.14)#33 | 1.1%(+1.08)#3,107 |
| 34. | Salt Lake City | 2.2% | 1.0%(+1.14)#34 | 1.1%(+1.07)#3,111 |
| 35. | West Bountiful | 2.1% | 1.0%(+1.11)#35 | 1.1%(+1.04)#3,158 |
| 36. | Mona | 2.1% | 1.0%(+1.08)#36 | 1.1%(+1.01)#3,221 |
| 37. | Midway | 2.0% | 1.0%(+1.00)#37 | 1.1%(+0.933)#3,377 |
| 38. | Logan | 2.0% | 1.0%(+0.974)#38 | 1.1%(+0.907)#3,431 |
| 39. | Cottonwood Heights | 2.0% | 1.0%(+0.959)#39 | 1.1%(+0.892)#3,464 |
| 40. | Ballard | 2.0% | 1.0%(+0.946)#40 | 1.1%(+0.878)#3,501 |
| 41. | Apple Valley | 2.0% | 1.0%(+0.937)#41 | 1.1%(+0.870)#3,514 |
| 42. | Stockton | 1.9% | 1.0%(+0.916)#42 | 1.1%(+0.849)#3,563 |
| 43. | Summit Park | 1.9% | 1.0%(+0.857)#43 | 1.1%(+0.790)#3,716 |
| 44. | Huntsville | 1.8% | 1.0%(+0.739)#44 | 1.1%(+0.671)#4,032 |
| 45. | Spring Lake | 1.6% | 1.0%(+0.596)#45 | 1.1%(+0.529)#4,440 |
| 46. | Kaysville | 1.6% | 1.0%(+0.538)#46 | 1.1%(+0.470)#4,620 |
| 47. | South Salt Lake | 1.6% | 1.0%(+0.536)#47 | 1.1%(+0.468)#4,627 |
| 48. | Santa Clara | 1.5% | 1.0%(+0.465)#48 | 1.1%(+0.398)#4,900 |
| 49. | Provo | 1.5% | 1.0%(+0.464)#49 | 1.1%(+0.397)#4,902 |
| 50. | Centerville | 1.5% | 1.0%(+0.443)#50 | 1.1%(+0.375)#4,987 |
| 51. | South Ogden | 1.5% | 1.0%(+0.442)#51 | 1.1%(+0.375)#4,992 |
| 52. | Myton | 1.4% | 1.0%(+0.405)#52 | 1.1%(+0.338)#5,150 |
| 53. | Randolph | 1.4% | 1.0%(+0.366)#53 | 1.1%(+0.298)#5,281 |
| 54. | Stansbury Park | 1.4% | 1.0%(+0.342)#54 | 1.1%(+0.275)#5,366 |
| 55. | Bountiful | 1.4% | 1.0%(+0.338)#55 | 1.1%(+0.270)#5,389 |
| 56. | Sandy | 1.3% | 1.0%(+0.325)#56 | 1.1%(+0.257)#5,458 |
| 57. | Mapleton | 1.3% | 1.0%(+0.293)#57 | 1.1%(+0.226)#5,597 |
| 58. | Beaver | 1.3% | 1.0%(+0.276)#58 | 1.1%(+0.209)#5,676 |
| 59. | Enoch | 1.3% | 1.0%(+0.273)#59 | 1.1%(+0.205)#5,693 |
| 60. | Coalville | 1.3% | 1.0%(+0.268)#60 | 1.1%(+0.201)#5,714 |
| 61. | Carbonville | 1.3% | 1.0%(+0.257)#61 | 1.1%(+0.189)#5,763 |
| 62. | Clarkston | 1.3% | 1.0%(+0.255)#62 | 1.1%(+0.187)#5,775 |
| 63. | Altamont | 1.3% | 1.0%(+0.251)#63 | 1.1%(+0.183)#5,794 |
| 64. | Woodland Hills | 1.2% | 1.0%(+0.151)#64 | 1.1%(+0.084)#6,263 |
| 65. | Glenwood | 1.1% | 1.0%(+0.126)#65 | 1.1%(+0.059)#6,371 |
| 66. | Draper | 1.1% | 1.0%(+0.116)#66 | 1.1%(+0.048)#6,420 |
| 67. | Hyde Park | 1.1% | 1.0%(+0.113)#67 | 1.1%(+0.045)#6,439 |
| 68. | Pleasant Grove | 1.1% | 1.0%(+0.088)#68 | 1.1%(+0.021)#6,562 |
| 69. | South Willard | 1.1% | 1.0%(+0.086)#69 | 1.1%(+0.019)#6,587 |
| 70. | North Logan | 1.1% | 1.0%(+0.085)#70 | 1.1%(+0.018)#6,591 |
| 71. | Midvale | 1.1% | 1.0%(+0.078)#71 | 1.1%(+0.010)#6,626 |
| 72. | Rush Valley | 1.1% | 1.0%(+0.076)#72 | 1.1%(+0.008)#6,645 |
| 73. | South Jordan | 1.1% | 1.0%(+0.055)#73 | 1.1%(-0.013)#6,765 |
| 74. | Springville | 1.1% | 1.0%(+0.039)#74 | 1.1%(-0.028)#6,835 |
| 75. | Holladay | 1.1% | 1.0%(+0.033)#75 | 1.1%(-0.035)#6,854 |
| 76. | Salina | 1.0% | 1.0%(+0.024)#76 | 1.1%(-0.044)#6,894 |
| 77. | Paradise | 1.0% | 1.0%(+0.024)#77 | 1.1%(-0.044)#6,897 |
| 78. | White | 1.0% | 1.0%(+0.014)#78 | 1.1%(-0.054)#6,947 |
| 79. | Cedar Hills | 1.0% | 1.0%(+0.005)#79 | 1.1%(-0.062)#7,000 |
| 80. | Cedar City | 1.0% | 1.0%(-0.010)#80 | 1.1%(-0.077)#7,087 |
| 81. | Honeyville | 1.0% | 1.0%(-0.016)#81 | 1.1%(-0.084)#7,127 |
| 82. | Farr West | 1.0% | 1.0%(-0.016)#82 | 1.1%(-0.084)#7,130 |
| 83. | Highland | 1.0% | 1.0%(-0.019)#83 | 1.1%(-0.087)#7,148 |
| 84. | Murray | 1.0% | 1.0%(-0.023)#84 | 1.1%(-0.091)#7,169 |
| 85. | Farmington | 0.99% | 1.0%(-0.038)#85 | 1.1%(-0.105)#7,265 |
| 86. | Fountain Green | 0.97% | 1.0%(-0.051)#86 | 1.1%(-0.119)#7,352 |
| 87. | Lehi | 0.96% | 1.0%(-0.061)#87 | 1.1%(-0.129)#7,424 |
| 88. | Tooele | 0.95% | 1.0%(-0.072)#88 | 1.1%(-0.139)#7,492 |
| 89. | Marriott Slaterville | 0.95% | 1.0%(-0.072)#89 | 1.1%(-0.139)#7,493 |
| 90. | Hurricane | 0.95% | 1.0%(-0.077)#90 | 1.1%(-0.145)#7,522 |
| 91. | Genola | 0.94% | 1.0%(-0.081)#91 | 1.1%(-0.149)#7,544 |
| 92. | Roosevelt | 0.92% | 1.0%(-0.107)#92 | 1.1%(-0.174)#7,717 |
| 93. | Layton | 0.91% | 1.0%(-0.115)#93 | 1.1%(-0.183)#7,769 |
| 94. | Hinckley | 0.90% | 1.0%(-0.118)#94 | 1.1%(-0.186)#7,786 |
| 95. | North Salt Lake | 0.90% | 1.0%(-0.124)#95 | 1.1%(-0.192)#7,824 |
| 96. | Helper | 0.87% | 1.0%(-0.151)#96 | 1.1%(-0.219)#7,998 |
| 97. | Hyrum | 0.87% | 1.0%(-0.152)#97 | 1.1%(-0.219)#7,999 |
| 98. | Cornish | 0.87% | 1.0%(-0.154)#98 | 1.1%(-0.221)#8,019 |
| 99. | Sunset | 0.86% | 1.0%(-0.163)#99 | 1.1%(-0.230)#8,067 |
| 100. | Magna | 0.85% | 1.0%(-0.172)#100 | 1.1%(-0.239)#8,126 |
Common Questions
What are the Top 10 Cities with the Highest Percentage of Population Employed in Life, Physical & Social Science in Utah?
Top 10 Cities with the Highest Percentage of Population Employed in Life, Physical & Social Science in Utah are:
#1
55.0%
#2
25.3%
#3
16.4%
#4
12.8%
#5
9.7%
#6
9.3%
#7
9.3%
#8
6.4%
#9
6.1%
#10
5.1%
What city has the Highest Percentage of Population Employed in Life, Physical & Social Science in Utah?
Oasis has the Highest Percentage of Population Employed in Life, Physical & Social Science in Utah with 55.0%.
What is the Percentage of Population Employed in Life, Physical & Social Science in the State of Utah?
Percentage of Population Employed in Life, Physical & Social Science in Utah is 1.0%.
What is the Percentage of Population Employed in Life, Physical & Social Science in the United States?
Percentage of Population Employed in Life, Physical & Social Science in the United States is 1.1%.