Zip Codes with the Highest Percentage of Population Employed in Life, Physical & Social Science in Glendale, CA
RELATED REPORTS & OPTIONS
Life, Physical & Social Science
Glendale
Compare Zip Codes
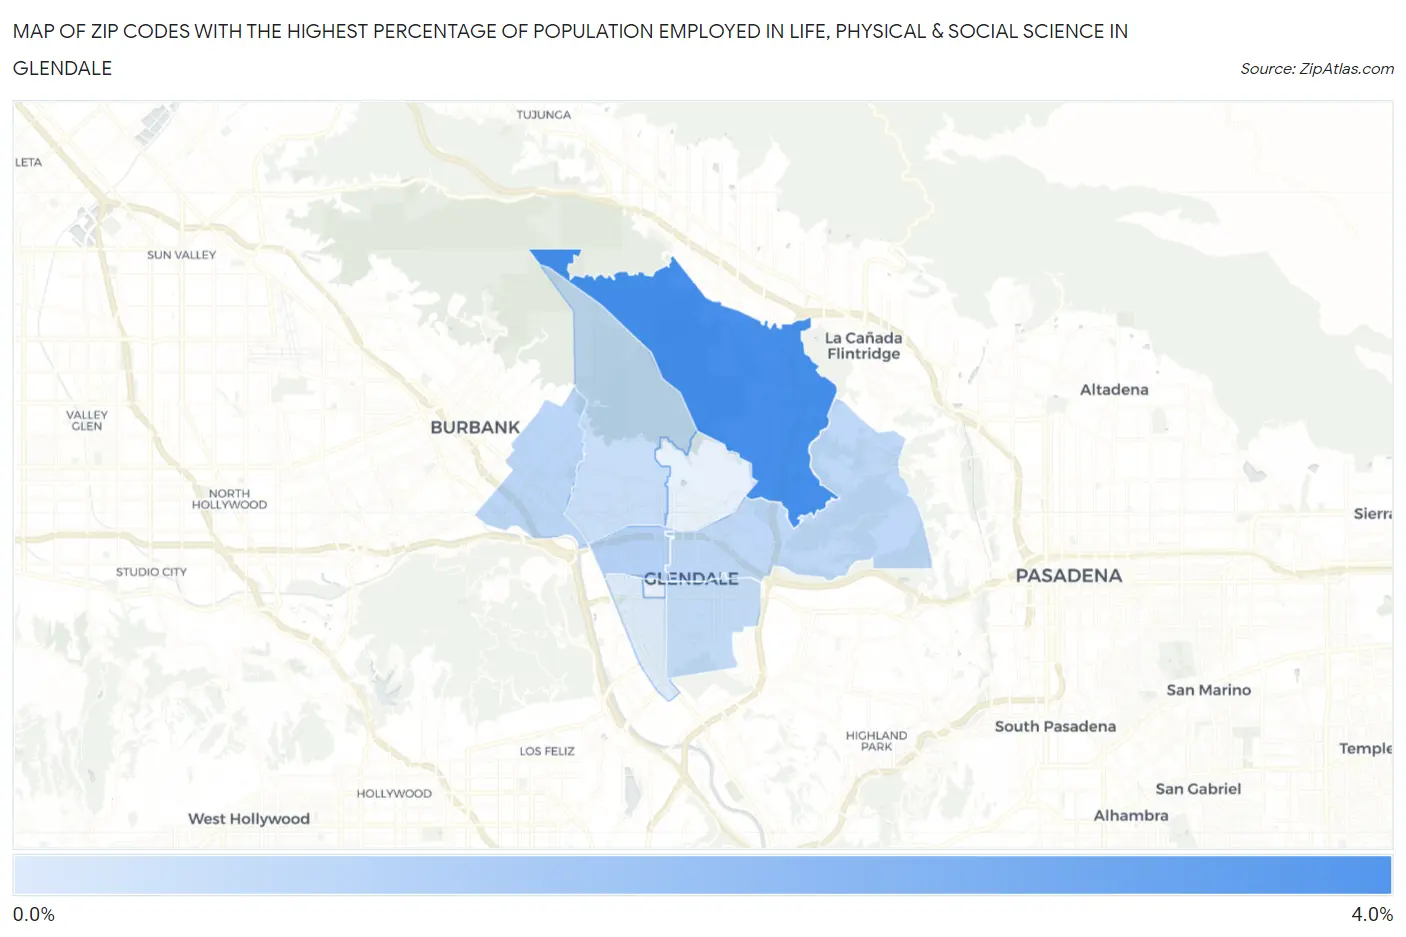
Map of Zip Codes with the Highest Percentage of Population Employed in Life, Physical & Social Science in Glendale
0.34%
3.5%
Zip Codes with the Highest Percentage of Population Employed in Life, Physical & Social Science in Glendale, CA
| Zip Code | % Employed | vs State | vs National | |
| 1. | 91208 | 3.5% | 1.3%(+2.15)#146 | 1.1%(+2.36)#1,457 |
| 2. | 91203 | 1.1% | 1.3%(-0.160)#655 | 1.1%(+0.057)#7,874 |
| 3. | 91201 | 1.1% | 1.3%(-0.255)#712 | 1.1%(-0.038)#8,598 |
| 4. | 91206 | 0.96% | 1.3%(-0.351)#766 | 1.1%(-0.134)#9,434 |
| 5. | 91205 | 0.86% | 1.3%(-0.451)#838 | 1.1%(-0.234)#10,412 |
| 6. | 91202 | 0.75% | 1.3%(-0.553)#914 | 1.1%(-0.336)#11,454 |
| 7. | 91204 | 0.34% | 1.3%(-0.968)#1,173 | 1.1%(-0.751)#16,544 |
1
Common Questions
What are the Top 5 Zip Codes with the Highest Percentage of Population Employed in Life, Physical & Social Science in Glendale, CA?
Top 5 Zip Codes with the Highest Percentage of Population Employed in Life, Physical & Social Science in Glendale, CA are:
What zip code has the Highest Percentage of Population Employed in Life, Physical & Social Science in Glendale, CA?
91208 has the Highest Percentage of Population Employed in Life, Physical & Social Science in Glendale, CA with 3.5%.
What is the Percentage of Population Employed in Life, Physical & Social Science in Glendale, CA?
Percentage of Population Employed in Life, Physical & Social Science in Glendale is 1.2%.
What is the Percentage of Population Employed in Life, Physical & Social Science in California?
Percentage of Population Employed in Life, Physical & Social Science in California is 1.3%.
What is the Percentage of Population Employed in Life, Physical & Social Science in the United States?
Percentage of Population Employed in Life, Physical & Social Science in the United States is 1.1%.