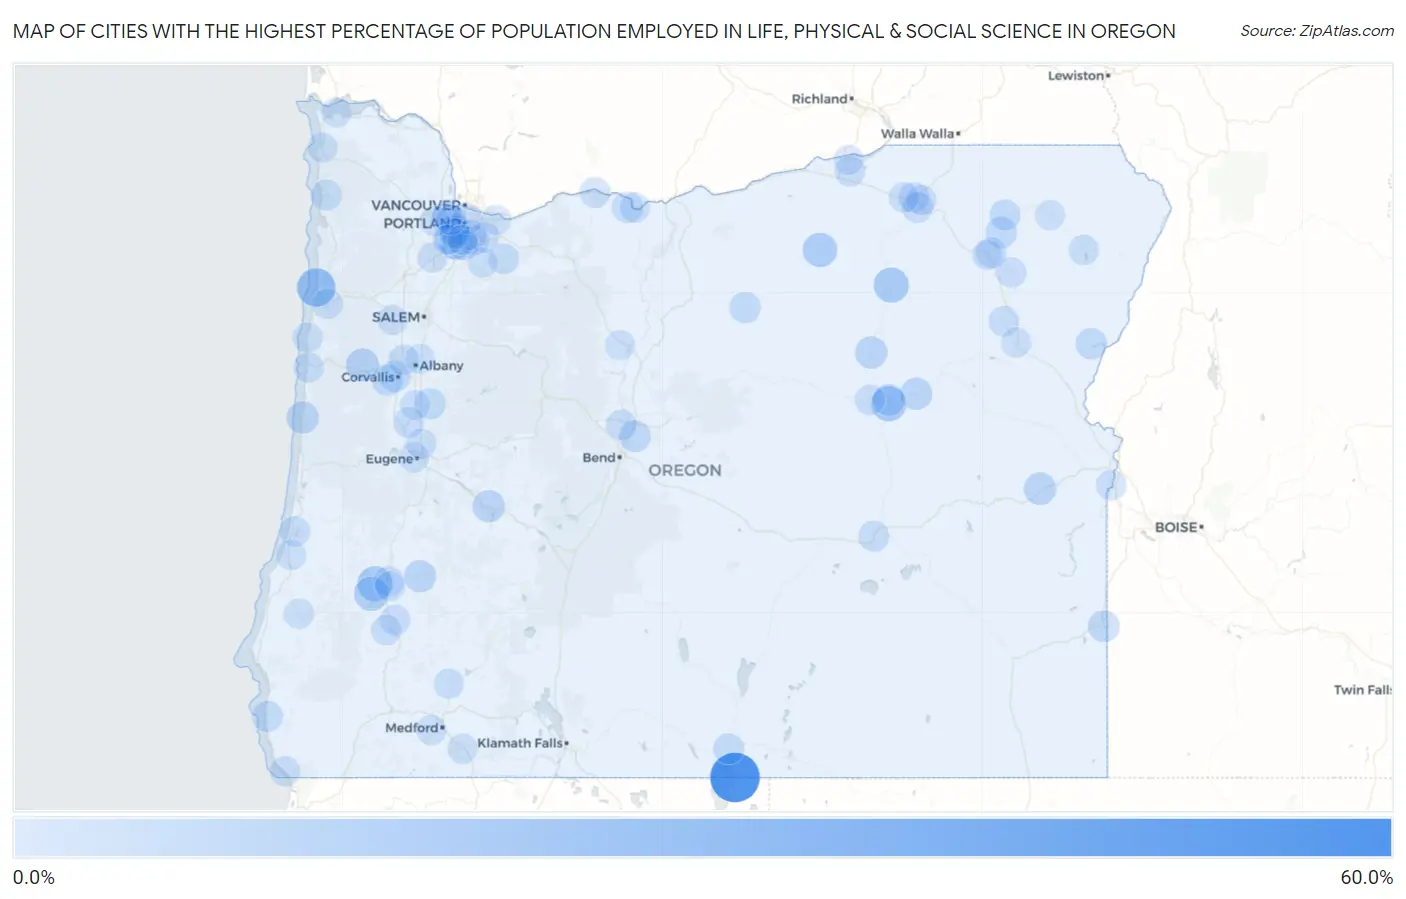
Cities with the Highest Percentage of Population Employed in Life, Physical & Social Science in Oregon
RELATED REPORTS & OPTIONS
Life, Physical & Social Science
Oregon
Compare Cities
Map of Cities with the Highest Percentage of Population Employed in Life, Physical & Social Science in Oregon
0.0%
60.0%
Cities with the Highest Percentage of Population Employed in Life, Physical & Social Science in Oregon
| City | % Employed | vs State | vs National | |
| 1. | New Pine Creek | 54.3% | 1.3%(+53.0)#1 | 1.1%(+53.2)#12 |
| 2. | Fort Klamath | 43.8% | 1.3%(+42.5)#2 | 1.1%(+42.7)#22 |
| 3. | Gilchrist | 31.5% | 1.3%(+30.2)#3 | 1.1%(+30.4)#42 |
| 4. | Neskowin | 23.0% | 1.3%(+21.7)#4 | 1.1%(+21.9)#61 |
| 5. | Canyon City | 14.3% | 1.3%(+13.0)#5 | 1.1%(+13.2)#127 |
| 6. | Melrose | 14.3% | 1.3%(+13.0)#6 | 1.1%(+13.2)#128 |
| 7. | Ukiah | 14.1% | 1.3%(+12.9)#7 | 1.1%(+13.0)#138 |
| 8. | Heppner | 12.3% | 1.3%(+11.1)#8 | 1.1%(+11.2)#167 |
| 9. | Lookingglass | 12.1% | 1.3%(+10.8)#9 | 1.1%(+11.0)#172 |
| 10. | Saunders Lake | 9.8% | 1.3%(+8.56)#10 | 1.1%(+8.75)#234 |
| 11. | Summit | 9.1% | 1.3%(+7.81)#11 | 1.1%(+8.00)#275 |
| 12. | Harper | 7.1% | 1.3%(+5.87)#12 | 1.1%(+6.05)#416 |
| 13. | Oakridge | 7.0% | 1.3%(+5.68)#13 | 1.1%(+5.86)#439 |
| 14. | Yachats | 6.8% | 1.3%(+5.56)#14 | 1.1%(+5.74)#452 |
| 15. | Long Creek | 6.8% | 1.3%(+5.54)#15 | 1.1%(+5.73)#455 |
| 16. | Prairie City | 6.6% | 1.3%(+5.29)#16 | 1.1%(+5.47)#489 |
| 17. | Glide | 6.2% | 1.3%(+4.97)#17 | 1.1%(+5.16)#540 |
| 18. | John Day | 5.7% | 1.3%(+4.41)#18 | 1.1%(+4.60)#635 |
| 19. | Pronghorn | 5.5% | 1.3%(+4.23)#19 | 1.1%(+4.41)#667 |
| 20. | Jordan Valley | 5.2% | 1.3%(+3.92)#20 | 1.1%(+4.10)#746 |
| 21. | Richland | 4.9% | 1.3%(+3.60)#21 | 1.1%(+3.79)#819 |
| 22. | Fossil | 4.7% | 1.3%(+3.37)#22 | 1.1%(+3.56)#889 |
| 23. | Corvallis | 4.5% | 1.3%(+3.26)#23 | 1.1%(+3.45)#942 |
| 24. | Philomath | 4.5% | 1.3%(+3.24)#24 | 1.1%(+3.42)#946 |
| 25. | Imbler | 4.4% | 1.3%(+3.16)#25 | 1.1%(+3.34)#980 |
| 26. | Chenoweth | 4.3% | 1.3%(+2.98)#26 | 1.1%(+3.17)#1,054 |
| 27. | Green Meadows | 4.0% | 1.3%(+2.70)#27 | 1.1%(+2.88)#1,184 |
| 28. | Gold Beach | 3.8% | 1.3%(+2.54)#28 | 1.1%(+2.73)#1,267 |
| 29. | Brownsville | 3.6% | 1.3%(+2.34)#29 | 1.1%(+2.52)#1,396 |
| 30. | Lakeview | 3.5% | 1.3%(+2.21)#30 | 1.1%(+2.39)#1,494 |
| 31. | Elgin | 3.4% | 1.3%(+2.17)#31 | 1.1%(+2.36)#1,512 |
| 32. | Durham | 3.3% | 1.3%(+2.04)#32 | 1.1%(+2.22)#1,604 |
| 33. | Hood River | 3.2% | 1.3%(+1.95)#33 | 1.1%(+2.13)#1,683 |
| 34. | Knappa | 3.2% | 1.3%(+1.93)#34 | 1.1%(+2.12)#1,691 |
| 35. | Wheeler | 3.2% | 1.3%(+1.91)#35 | 1.1%(+2.09)#1,707 |
| 36. | Hines | 3.1% | 1.3%(+1.86)#36 | 1.1%(+2.04)#1,755 |
| 37. | Island City | 3.1% | 1.3%(+1.84)#37 | 1.1%(+2.03)#1,775 |
| 38. | Harrisburg | 3.1% | 1.3%(+1.82)#38 | 1.1%(+2.00)#1,800 |
| 39. | Tutuilla | 3.0% | 1.3%(+1.77)#39 | 1.1%(+1.95)#1,854 |
| 40. | Oak Hills | 2.9% | 1.3%(+1.65)#40 | 1.1%(+1.84)#1,943 |
| 41. | Rivergrove | 2.9% | 1.3%(+1.63)#41 | 1.1%(+1.81)#1,964 |
| 42. | Adair Village | 2.8% | 1.3%(+1.57)#42 | 1.1%(+1.76)#2,019 |
| 43. | Eagle Crest | 2.7% | 1.3%(+1.44)#43 | 1.1%(+1.62)#2,206 |
| 44. | Juniper Canyon | 2.6% | 1.3%(+1.34)#44 | 1.1%(+1.52)#2,335 |
| 45. | Estacada | 2.6% | 1.3%(+1.29)#45 | 1.1%(+1.48)#2,402 |
| 46. | Garden Home Whitford | 2.5% | 1.3%(+1.27)#46 | 1.1%(+1.46)#2,440 |
| 47. | Myrtle Creek | 2.5% | 1.3%(+1.21)#47 | 1.1%(+1.40)#2,534 |
| 48. | Haines | 2.4% | 1.3%(+1.10)#48 | 1.1%(+1.29)#2,717 |
| 49. | Riddle | 2.3% | 1.3%(+1.02)#49 | 1.1%(+1.20)#2,858 |
| 50. | Raleigh Hills | 2.3% | 1.3%(+1.02)#50 | 1.1%(+1.20)#2,859 |
| 51. | Rose Lodge | 2.1% | 1.3%(+0.848)#51 | 1.1%(+1.03)#3,179 |
| 52. | Nyssa | 2.1% | 1.3%(+0.837)#52 | 1.1%(+1.02)#3,195 |
| 53. | Eugene | 2.1% | 1.3%(+0.798)#53 | 1.1%(+0.983)#3,273 |
| 54. | Riverside | 2.1% | 1.3%(+0.796)#54 | 1.1%(+0.982)#3,277 |
| 55. | Oatfield | 2.1% | 1.3%(+0.779)#55 | 1.1%(+0.964)#3,304 |
| 56. | Lakeside | 2.0% | 1.3%(+0.747)#56 | 1.1%(+0.933)#3,378 |
| 57. | Harbor | 2.0% | 1.3%(+0.744)#57 | 1.1%(+0.929)#3,385 |
| 58. | Mount Vernon | 2.0% | 1.3%(+0.723)#58 | 1.1%(+0.909)#3,422 |
| 59. | Milwaukie | 2.0% | 1.3%(+0.689)#59 | 1.1%(+0.875)#3,506 |
| 60. | Happy Valley | 1.9% | 1.3%(+0.664)#60 | 1.1%(+0.849)#3,562 |
| 61. | Portland | 1.9% | 1.3%(+0.628)#61 | 1.1%(+0.814)#3,641 |
| 62. | Newport | 1.9% | 1.3%(+0.628)#62 | 1.1%(+0.813)#3,642 |
| 63. | Dallas | 1.9% | 1.3%(+0.617)#63 | 1.1%(+0.802)#3,674 |
| 64. | Bethany | 1.9% | 1.3%(+0.577)#64 | 1.1%(+0.763)#3,784 |
| 65. | Marlene | 1.8% | 1.3%(+0.567)#65 | 1.1%(+0.753)#3,813 |
| 66. | Roseburg North | 1.8% | 1.3%(+0.492)#66 | 1.1%(+0.678)#4,018 |
| 67. | Stafford | 1.8% | 1.3%(+0.490)#67 | 1.1%(+0.676)#4,023 |
| 68. | Shady Cove | 1.7% | 1.3%(+0.471)#68 | 1.1%(+0.657)#4,079 |
| 69. | La Grande | 1.7% | 1.3%(+0.453)#69 | 1.1%(+0.638)#4,123 |
| 70. | Tigard | 1.7% | 1.3%(+0.442)#70 | 1.1%(+0.628)#4,166 |
| 71. | Union | 1.7% | 1.3%(+0.439)#71 | 1.1%(+0.625)#4,175 |
| 72. | Joseph | 1.7% | 1.3%(+0.418)#72 | 1.1%(+0.604)#4,231 |
| 73. | Mission | 1.7% | 1.3%(+0.413)#73 | 1.1%(+0.598)#4,249 |
| 74. | Hermiston | 1.6% | 1.3%(+0.372)#74 | 1.1%(+0.557)#4,358 |
| 75. | Myrtle Point | 1.6% | 1.3%(+0.344)#75 | 1.1%(+0.529)#4,435 |
| 76. | Troutdale | 1.6% | 1.3%(+0.325)#76 | 1.1%(+0.510)#4,490 |
| 77. | Ashland | 1.6% | 1.3%(+0.314)#77 | 1.1%(+0.500)#4,521 |
| 78. | Wallowa | 1.6% | 1.3%(+0.306)#78 | 1.1%(+0.491)#4,550 |
| 79. | Metzger | 1.5% | 1.3%(+0.255)#79 | 1.1%(+0.441)#4,724 |
| 80. | Hillsboro | 1.5% | 1.3%(+0.243)#80 | 1.1%(+0.428)#4,772 |
| 81. | Jacksonville | 1.5% | 1.3%(+0.200)#81 | 1.1%(+0.386)#4,945 |
| 82. | Astoria | 1.5% | 1.3%(+0.196)#82 | 1.1%(+0.381)#4,963 |
| 83. | Roseburg | 1.5% | 1.3%(+0.182)#83 | 1.1%(+0.368)#5,021 |
| 84. | Newberg | 1.5% | 1.3%(+0.176)#84 | 1.1%(+0.361)#5,048 |
| 85. | Baker City | 1.4% | 1.3%(+0.164)#85 | 1.1%(+0.349)#5,094 |
| 86. | Depoe Bay | 1.4% | 1.3%(+0.157)#86 | 1.1%(+0.342)#5,127 |
| 87. | Warm Springs | 1.4% | 1.3%(+0.150)#87 | 1.1%(+0.336)#5,161 |
| 88. | Cedar Mill | 1.4% | 1.3%(+0.127)#88 | 1.1%(+0.313)#5,231 |
| 89. | Millersburg | 1.4% | 1.3%(+0.102)#89 | 1.1%(+0.287)#5,310 |
| 90. | Coburg | 1.4% | 1.3%(+0.091)#90 | 1.1%(+0.277)#5,356 |
| 91. | The Dalles | 1.3% | 1.3%(+0.049)#91 | 1.1%(+0.235)#5,548 |
| 92. | Pendleton | 1.3% | 1.3%(+0.038)#92 | 1.1%(+0.224)#5,606 |
| 93. | Halsey | 1.3% | 1.3%(+0.037)#93 | 1.1%(+0.223)#5,608 |
| 94. | Glasgow | 1.3% | 1.3%(+0.022)#94 | 1.1%(+0.208)#5,680 |
| 95. | Dunthorpe | 1.3% | 1.3%(+0.005)#95 | 1.1%(+0.191)#5,754 |
| 96. | Bull Mountain | 1.3% | 1.3%(-0.012)#96 | 1.1%(+0.174)#5,844 |
| 97. | Lake Oswego | 1.3% | 1.3%(-0.019)#97 | 1.1%(+0.167)#5,877 |
| 98. | Beavercreek | 1.3% | 1.3%(-0.026)#98 | 1.1%(+0.160)#5,895 |
| 99. | Umatilla | 1.2% | 1.3%(-0.050)#99 | 1.1%(+0.136)#6,004 |
| 100. | Seaside | 1.2% | 1.3%(-0.074)#100 | 1.1%(+0.112)#6,113 |
Common Questions
What are the Top 10 Cities with the Highest Percentage of Population Employed in Life, Physical & Social Science in Oregon?
Top 10 Cities with the Highest Percentage of Population Employed in Life, Physical & Social Science in Oregon are:
#1
54.3%
#2
23.0%
#3
14.3%
#4
14.3%
#5
14.1%
#6
12.3%
#7
12.1%
#8
9.1%
#9
7.1%
#10
7.0%
What city has the Highest Percentage of Population Employed in Life, Physical & Social Science in Oregon?
New Pine Creek has the Highest Percentage of Population Employed in Life, Physical & Social Science in Oregon with 54.3%.
What is the Percentage of Population Employed in Life, Physical & Social Science in the State of Oregon?
Percentage of Population Employed in Life, Physical & Social Science in Oregon is 1.3%.
What is the Percentage of Population Employed in Life, Physical & Social Science in the United States?
Percentage of Population Employed in Life, Physical & Social Science in the United States is 1.1%.