Cities with the Highest Percentage of Population Employed in Life, Physical & Social Science in Montana
RELATED REPORTS & OPTIONS
Life, Physical & Social Science
Montana
Compare Cities
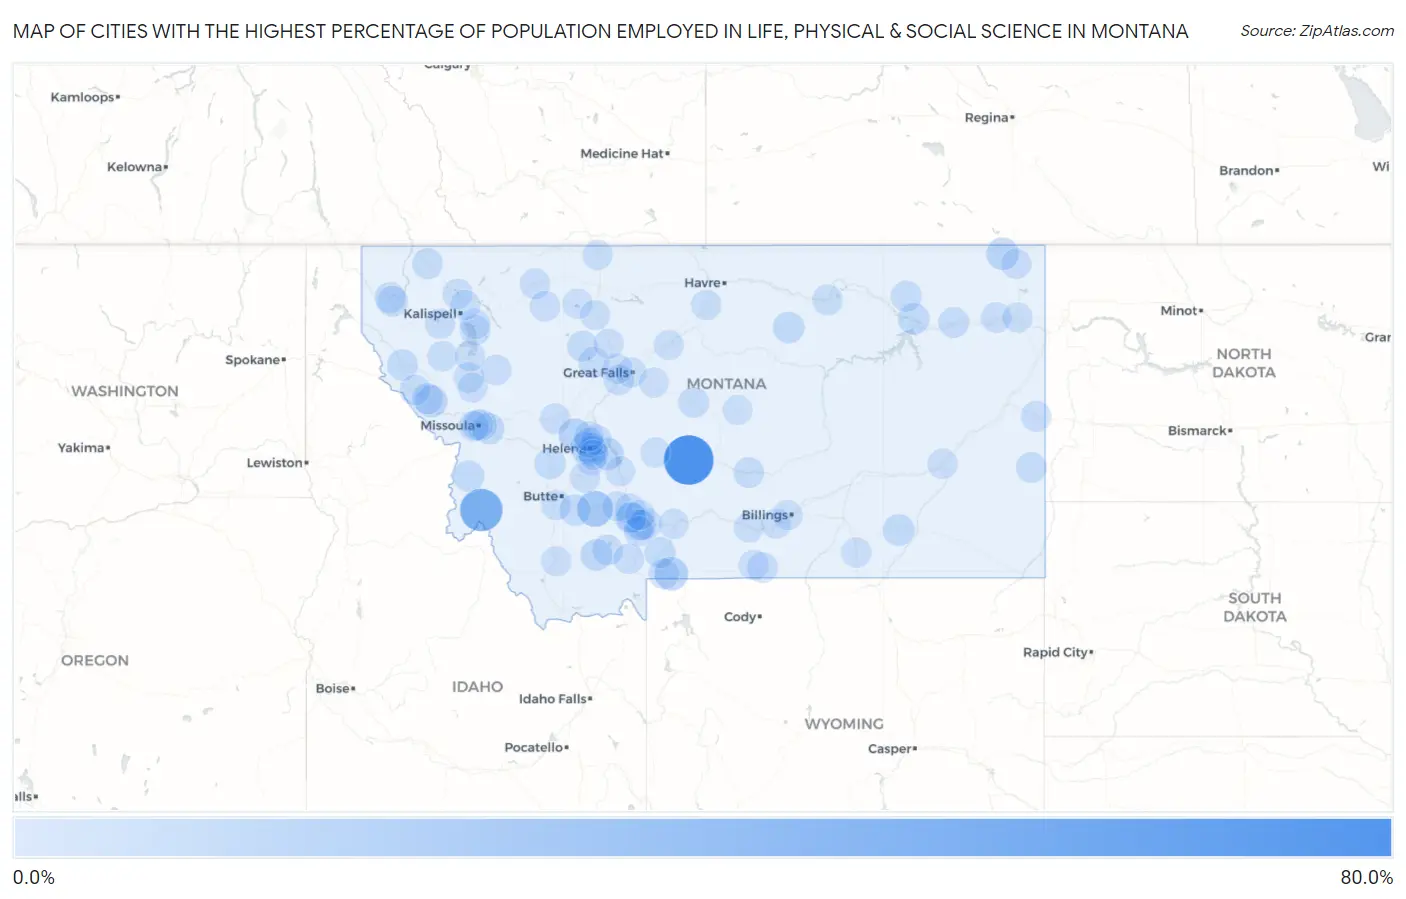
Map of Cities with the Highest Percentage of Population Employed in Life, Physical & Social Science in Montana
0.0%
80.0%
Cities with the Highest Percentage of Population Employed in Life, Physical & Social Science in Montana
| City | % Employed | vs State | vs National | |
| 1. | Martinsdale | 76.7% | 1.5%(+75.2)#1 | 1.1%(+75.6)#3 |
| 2. | Sula | 47.8% | 1.5%(+46.3)#2 | 1.1%(+46.7)#18 |
| 3. | Maverick Mountain | 25.0% | 1.5%(+23.5)#3 | 1.1%(+23.9)#54 |
| 4. | Cardwell | 22.2% | 1.5%(+20.7)#4 | 1.1%(+21.1)#64 |
| 5. | Cyr | 15.6% | 1.5%(+14.1)#5 | 1.1%(+14.5)#108 |
| 6. | Jardine | 12.9% | 1.5%(+11.4)#6 | 1.1%(+11.8)#160 |
| 7. | Silver Star | 11.8% | 1.5%(+10.3)#7 | 1.1%(+10.7)#179 |
| 8. | Marysville | 10.8% | 1.5%(+9.33)#8 | 1.1%(+9.72)#207 |
| 9. | Outlook | 8.7% | 1.5%(+7.22)#9 | 1.1%(+7.60)#295 |
| 10. | Spokane Creek | 8.4% | 1.5%(+6.92)#10 | 1.1%(+7.31)#317 |
| 11. | Wise River | 8.3% | 1.5%(+6.85)#11 | 1.1%(+7.24)#322 |
| 12. | Riverbend | 8.1% | 1.5%(+6.60)#12 | 1.1%(+6.99)#334 |
| 13. | Helena West Side | 7.2% | 1.5%(+5.69)#13 | 1.1%(+6.08)#411 |
| 14. | Virginia City | 6.6% | 1.5%(+5.08)#14 | 1.1%(+5.47)#491 |
| 15. | Lame Deer | 6.0% | 1.5%(+4.55)#15 | 1.1%(+4.94)#580 |
| 16. | Lodge Pole | 6.0% | 1.5%(+4.49)#16 | 1.1%(+4.88)#587 |
| 17. | Unionville | 5.6% | 1.5%(+4.08)#17 | 1.1%(+4.46)#655 |
| 18. | Nashua | 5.6% | 1.5%(+4.08)#18 | 1.1%(+4.46)#656 |
| 19. | Turah | 5.4% | 1.5%(+3.88)#19 | 1.1%(+4.27)#702 |
| 20. | Hamilton | 5.2% | 1.5%(+3.75)#20 | 1.1%(+4.14)#738 |
| 21. | East Missoula | 5.0% | 1.5%(+3.53)#21 | 1.1%(+3.92)#786 |
| 22. | Amsterdam | 5.0% | 1.5%(+3.52)#22 | 1.1%(+3.91)#790 |
| 23. | Thompson Falls | 4.7% | 1.5%(+3.24)#23 | 1.1%(+3.63)#869 |
| 24. | South Glastonbury | 4.5% | 1.5%(+3.07)#24 | 1.1%(+3.45)#928 |
| 25. | Deer Lodge | 4.3% | 1.5%(+2.83)#25 | 1.1%(+3.22)#1,034 |
| 26. | Rader Creek | 4.3% | 1.5%(+2.79)#26 | 1.1%(+3.18)#1,047 |
| 27. | Fairfield | 3.9% | 1.5%(+2.41)#27 | 1.1%(+2.80)#1,229 |
| 28. | Superior | 3.8% | 1.5%(+2.35)#28 | 1.1%(+2.74)#1,258 |
| 29. | Libby | 3.8% | 1.5%(+2.33)#29 | 1.1%(+2.72)#1,271 |
| 30. | St Marie | 3.5% | 1.5%(+2.05)#30 | 1.1%(+2.44)#1,458 |
| 31. | White Haven | 3.4% | 1.5%(+1.97)#31 | 1.1%(+2.36)#1,514 |
| 32. | Bozeman | 3.4% | 1.5%(+1.94)#32 | 1.1%(+2.32)#1,539 |
| 33. | Fortine | 3.2% | 1.5%(+1.77)#33 | 1.1%(+2.16)#1,656 |
| 34. | Choteau | 3.2% | 1.5%(+1.76)#34 | 1.1%(+2.15)#1,663 |
| 35. | Ryegate | 3.1% | 1.5%(+1.61)#35 | 1.1%(+2.00)#1,804 |
| 36. | Ennis | 3.0% | 1.5%(+1.53)#36 | 1.1%(+1.92)#1,877 |
| 37. | Wolf Point | 3.0% | 1.5%(+1.52)#37 | 1.1%(+1.91)#1,881 |
| 38. | Baker | 2.8% | 1.5%(+1.34)#38 | 1.1%(+1.73)#2,041 |
| 39. | St Regis | 2.8% | 1.5%(+1.32)#39 | 1.1%(+1.71)#2,075 |
| 40. | Stanford | 2.8% | 1.5%(+1.27)#40 | 1.1%(+1.66)#2,152 |
| 41. | Helena | 2.7% | 1.5%(+1.26)#41 | 1.1%(+1.65)#2,168 |
| 42. | Four Corners | 2.7% | 1.5%(+1.20)#42 | 1.1%(+1.59)#2,239 |
| 43. | Woods Bay | 2.6% | 1.5%(+1.15)#43 | 1.1%(+1.53)#2,319 |
| 44. | Wibaux | 2.6% | 1.5%(+1.13)#44 | 1.1%(+1.52)#2,340 |
| 45. | Gardiner | 2.6% | 1.5%(+1.10)#45 | 1.1%(+1.49)#2,390 |
| 46. | Belfry | 2.6% | 1.5%(+1.08)#46 | 1.1%(+1.47)#2,408 |
| 47. | Lincoln | 2.5% | 1.5%(+1.05)#47 | 1.1%(+1.44)#2,470 |
| 48. | Malta | 2.4% | 1.5%(+0.927)#48 | 1.1%(+1.32)#2,672 |
| 49. | Ulm | 2.4% | 1.5%(+0.895)#49 | 1.1%(+1.28)#2,733 |
| 50. | Charlo | 2.4% | 1.5%(+0.873)#50 | 1.1%(+1.26)#2,772 |
| 51. | South Hills | 2.3% | 1.5%(+0.859)#51 | 1.1%(+1.25)#2,794 |
| 52. | Condon | 2.3% | 1.5%(+0.793)#52 | 1.1%(+1.18)#2,901 |
| 53. | Helena Valley Northeast | 2.2% | 1.5%(+0.729)#53 | 1.1%(+1.12)#3,023 |
| 54. | South Browning | 2.2% | 1.5%(+0.724)#54 | 1.1%(+1.11)#3,028 |
| 55. | Missoula | 2.1% | 1.5%(+0.666)#55 | 1.1%(+1.05)#3,140 |
| 56. | Big Sky | 2.1% | 1.5%(+0.636)#56 | 1.1%(+1.02)#3,191 |
| 57. | Manhattan | 2.1% | 1.5%(+0.631)#57 | 1.1%(+1.02)#3,204 |
| 58. | Brockton | 2.1% | 1.5%(+0.603)#58 | 1.1%(+0.992)#3,257 |
| 59. | King Arthur Park | 2.0% | 1.5%(+0.524)#59 | 1.1%(+0.913)#3,416 |
| 60. | Heart Butte | 2.0% | 1.5%(+0.494)#60 | 1.1%(+0.883)#3,487 |
| 61. | Orchard Homes | 1.9% | 1.5%(+0.444)#61 | 1.1%(+0.834)#3,592 |
| 62. | Plentywood | 1.8% | 1.5%(+0.340)#62 | 1.1%(+0.729)#3,871 |
| 63. | Marion | 1.8% | 1.5%(+0.315)#63 | 1.1%(+0.704)#3,937 |
| 64. | Rocky Boy West | 1.7% | 1.5%(+0.252)#64 | 1.1%(+0.641)#4,116 |
| 65. | Sunburst | 1.6% | 1.5%(+0.124)#65 | 1.1%(+0.513)#4,482 |
| 66. | Lonepine | 1.6% | 1.5%(+0.107)#66 | 1.1%(+0.496)#4,538 |
| 67. | Butte Silver Bow Balance | 1.6% | 1.5%(+0.088)#67 | 1.1%(+0.477)#4,601 |
| 68. | Clancy | 1.5% | 1.5%(+0.058)#68 | 1.1%(+0.448)#4,691 |
| 69. | Whitefish | 1.5% | 1.5%(+0.023)#69 | 1.1%(+0.412)#4,820 |
| 70. | Polson | 1.4% | 1.5%(-0.111)#70 | 1.1%(+0.278)#5,349 |
| 71. | Columbus | 1.4% | 1.5%(-0.126)#71 | 1.1%(+0.263)#5,429 |
| 72. | Boulder | 1.3% | 1.5%(-0.164)#72 | 1.1%(+0.225)#5,599 |
| 73. | Bigfork | 1.3% | 1.5%(-0.166)#73 | 1.1%(+0.223)#5,607 |
| 74. | Laurel | 1.3% | 1.5%(-0.176)#74 | 1.1%(+0.213)#5,654 |
| 75. | Helena Valley West Central | 1.3% | 1.5%(-0.209)#75 | 1.1%(+0.180)#5,803 |
| 76. | White Sulphur Springs | 1.1% | 1.5%(-0.331)#76 | 1.1%(+0.059)#6,366 |
| 77. | Bearcreek | 1.1% | 1.5%(-0.331)#77 | 1.1%(+0.059)#6,378 |
| 78. | Three Forks | 1.1% | 1.5%(-0.346)#78 | 1.1%(+0.043)#6,445 |
| 79. | Churchill | 1.1% | 1.5%(-0.365)#79 | 1.1%(+0.024)#6,540 |
| 80. | Miles City | 1.1% | 1.5%(-0.369)#80 | 1.1%(+0.020)#6,579 |
| 81. | Great Falls | 1.1% | 1.5%(-0.373)#81 | 1.1%(+0.016)#6,599 |
| 82. | Helena Flats | 1.1% | 1.5%(-0.376)#82 | 1.1%(+0.013)#6,614 |
| 83. | Belt | 1.1% | 1.5%(-0.427)#83 | 1.1%(-0.038)#6,872 |
| 84. | Montana City | 1.0% | 1.5%(-0.436)#84 | 1.1%(-0.047)#6,926 |
| 85. | Dillon | 1.0% | 1.5%(-0.451)#85 | 1.1%(-0.062)#6,995 |
| 86. | Livingston | 1.0% | 1.5%(-0.469)#86 | 1.1%(-0.080)#7,101 |
| 87. | Gallatin Gateway | 0.99% | 1.5%(-0.490)#87 | 1.1%(-0.101)#7,236 |
| 88. | Billings | 0.97% | 1.5%(-0.506)#88 | 1.1%(-0.117)#7,341 |
| 89. | Lewistown | 0.96% | 1.5%(-0.517)#89 | 1.1%(-0.128)#7,418 |
| 90. | Townsend | 0.93% | 1.5%(-0.553)#90 | 1.1%(-0.164)#7,638 |
| 91. | St Ignatius | 0.92% | 1.5%(-0.560)#91 | 1.1%(-0.171)#7,692 |
| 92. | Culbertson | 0.88% | 1.5%(-0.603)#92 | 1.1%(-0.214)#7,970 |
| 93. | Valier | 0.86% | 1.5%(-0.618)#93 | 1.1%(-0.229)#8,055 |
| 94. | Conrad | 0.86% | 1.5%(-0.619)#94 | 1.1%(-0.230)#8,068 |
| 95. | Vaughn | 0.85% | 1.5%(-0.631)#95 | 1.1%(-0.242)#8,146 |
| 96. | Belgrade | 0.85% | 1.5%(-0.633)#96 | 1.1%(-0.244)#8,173 |
| 97. | Fort Benton | 0.83% | 1.5%(-0.648)#97 | 1.1%(-0.259)#8,275 |
| 98. | Lodge Grass | 0.82% | 1.5%(-0.660)#98 | 1.1%(-0.271)#8,356 |
| 99. | Helena Valley Northwest | 0.81% | 1.5%(-0.671)#99 | 1.1%(-0.282)#8,415 |
| 100. | Dutton | 0.81% | 1.5%(-0.674)#100 | 1.1%(-0.284)#8,436 |
Common Questions
What are the Top 10 Cities with the Highest Percentage of Population Employed in Life, Physical & Social Science in Montana?
Top 10 Cities with the Highest Percentage of Population Employed in Life, Physical & Social Science in Montana are:
#1
76.7%
#2
47.8%
#3
22.2%
#4
12.9%
#5
10.8%
#6
8.7%
#7
8.4%
#8
8.1%
#9
7.2%
#10
6.6%
What city has the Highest Percentage of Population Employed in Life, Physical & Social Science in Montana?
Martinsdale has the Highest Percentage of Population Employed in Life, Physical & Social Science in Montana with 76.7%.
What is the Percentage of Population Employed in Life, Physical & Social Science in the State of Montana?
Percentage of Population Employed in Life, Physical & Social Science in Montana is 1.5%.
What is the Percentage of Population Employed in Life, Physical & Social Science in the United States?
Percentage of Population Employed in Life, Physical & Social Science in the United States is 1.1%.