Cities with the Highest Percentage of Population Employed in Life, Physical & Social Science in South Carolina
RELATED REPORTS & OPTIONS
Life, Physical & Social Science
South Carolina
Compare Cities
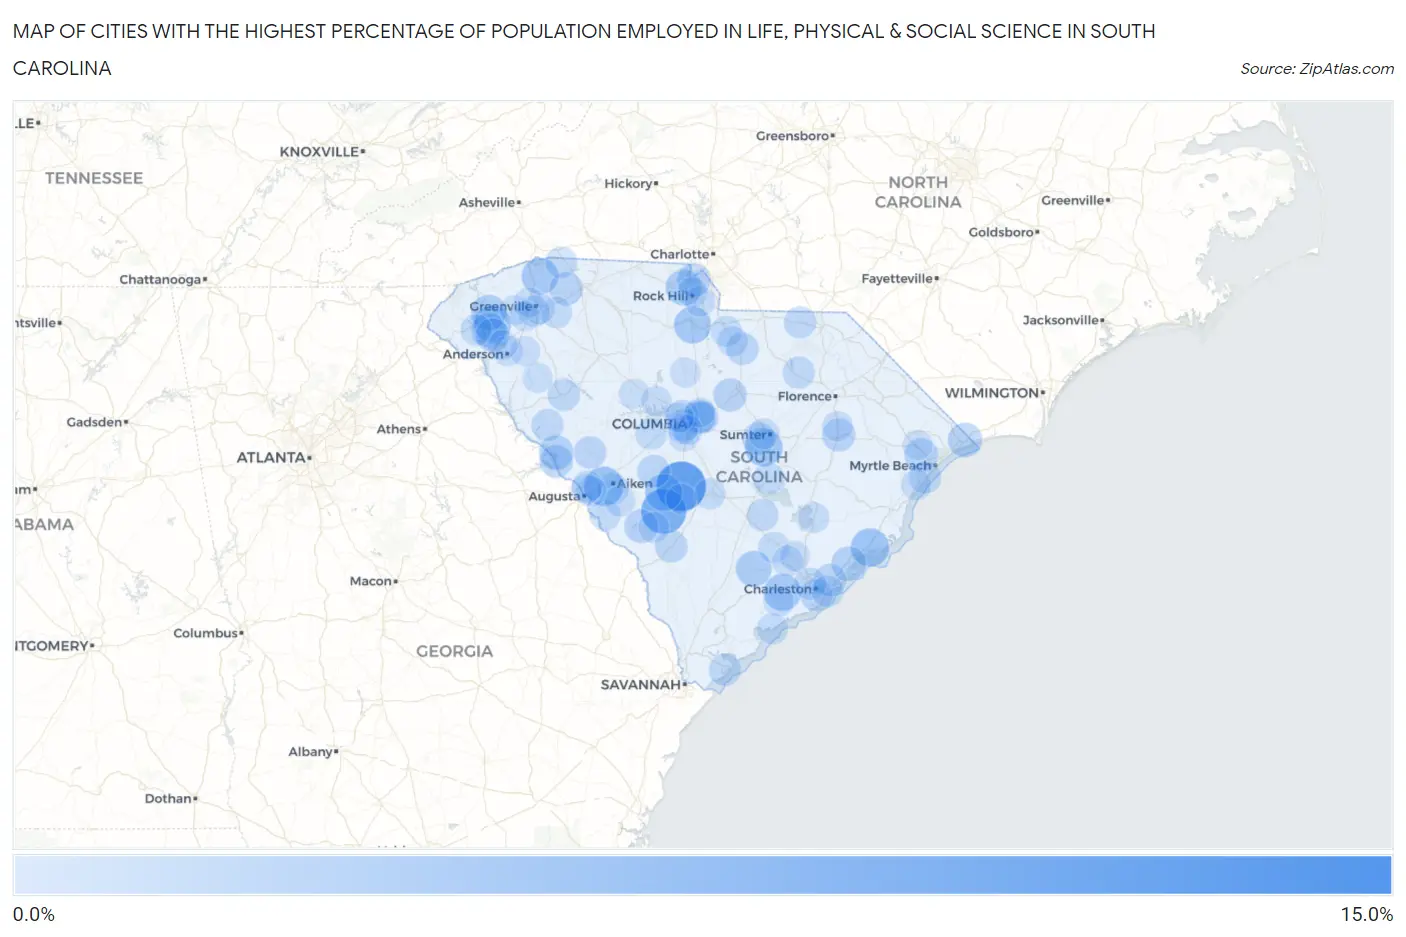
Map of Cities with the Highest Percentage of Population Employed in Life, Physical & Social Science in South Carolina
0.0%
15.0%
Cities with the Highest Percentage of Population Employed in Life, Physical & Social Science in South Carolina
| City | % Employed | vs State | vs National | |
| 1. | Chickasaw Point | 11.4% | 0.73%(+10.6)#1 | 1.1%(+10.3)#192 |
| 2. | Neeses | 9.3% | 0.73%(+8.56)#2 | 1.1%(+8.19)#265 |
| 3. | Blackville | 7.3% | 0.73%(+6.55)#3 | 1.1%(+6.19)#398 |
| 4. | Harbor Island | 6.2% | 0.73%(+5.52)#4 | 1.1%(+5.16)#543 |
| 5. | Debordieu Colony | 5.2% | 0.73%(+4.46)#5 | 1.1%(+4.10)#749 |
| 6. | Warrenville | 4.6% | 0.73%(+3.88)#6 | 1.1%(+3.52)#907 |
| 7. | Mcclellanville | 4.2% | 0.73%(+3.45)#7 | 1.1%(+3.09)#1,087 |
| 8. | Privateer | 4.0% | 0.73%(+3.25)#8 | 1.1%(+2.88)#1,183 |
| 9. | Springfield | 3.7% | 0.73%(+2.98)#9 | 1.1%(+2.61)#1,320 |
| 10. | Central | 3.7% | 0.73%(+2.96)#10 | 1.1%(+2.60)#1,338 |
| 11. | Hollywood | 3.7% | 0.73%(+2.95)#11 | 1.1%(+2.59)#1,353 |
| 12. | Richburg | 3.6% | 0.73%(+2.92)#12 | 1.1%(+2.56)#1,371 |
| 13. | Tigerville | 3.5% | 0.73%(+2.79)#13 | 1.1%(+2.42)#1,470 |
| 14. | Newport | 3.2% | 0.73%(+2.50)#14 | 1.1%(+2.13)#1,685 |
| 15. | Cottageville | 3.1% | 0.73%(+2.36)#15 | 1.1%(+1.99)#1,812 |
| 16. | Six Mile | 2.9% | 0.73%(+2.20)#16 | 1.1%(+1.84)#1,940 |
| 17. | Awendaw | 2.6% | 0.73%(+1.87)#17 | 1.1%(+1.51)#2,358 |
| 18. | Clemson | 2.6% | 0.73%(+1.86)#18 | 1.1%(+1.49)#2,380 |
| 19. | Parksville | 2.6% | 0.73%(+1.84)#19 | 1.1%(+1.47)#2,412 |
| 20. | Little River | 2.5% | 0.73%(+1.77)#20 | 1.1%(+1.40)#2,530 |
| 21. | Olympia | 2.3% | 0.73%(+1.54)#21 | 1.1%(+1.17)#2,917 |
| 22. | Red Hill | 2.3% | 0.73%(+1.54)#22 | 1.1%(+1.17)#2,920 |
| 23. | Snelling | 2.3% | 0.73%(+1.53)#23 | 1.1%(+1.16)#2,937 |
| 24. | Tega Cay | 2.2% | 0.73%(+1.50)#24 | 1.1%(+1.13)#2,992 |
| 25. | Pendleton | 2.2% | 0.73%(+1.47)#25 | 1.1%(+1.11)#3,039 |
| 26. | Lyman | 2.1% | 0.73%(+1.41)#26 | 1.1%(+1.05)#3,152 |
| 27. | Lugoff | 2.1% | 0.73%(+1.41)#27 | 1.1%(+1.04)#3,159 |
| 28. | Keowee Key | 2.1% | 0.73%(+1.36)#28 | 1.1%(+0.992)#3,256 |
| 29. | Scranton | 2.1% | 0.73%(+1.33)#29 | 1.1%(+0.962)#3,316 |
| 30. | Modoc | 2.0% | 0.73%(+1.29)#30 | 1.1%(+0.925)#3,397 |
| 31. | Wagener | 1.8% | 0.73%(+1.10)#31 | 1.1%(+0.738)#3,847 |
| 32. | Cane Savannah | 1.8% | 0.73%(+1.09)#32 | 1.1%(+0.727)#3,875 |
| 33. | Arcadia Lakes | 1.8% | 0.73%(+1.05)#33 | 1.1%(+0.683)#4,004 |
| 34. | Forest Acres | 1.8% | 0.73%(+1.05)#34 | 1.1%(+0.683)#4,005 |
| 35. | St Andrews | 1.8% | 0.73%(+1.04)#35 | 1.1%(+0.676)#4,022 |
| 36. | Mount Pleasant | 1.8% | 0.73%(+1.04)#36 | 1.1%(+0.674)#4,029 |
| 37. | Ulmer | 1.8% | 0.73%(+1.03)#37 | 1.1%(+0.663)#4,057 |
| 38. | Edgefield | 1.7% | 0.73%(+0.981)#38 | 1.1%(+0.616)#4,195 |
| 39. | James Island | 1.7% | 0.73%(+0.968)#39 | 1.1%(+0.604)#4,239 |
| 40. | Kershaw | 1.7% | 0.73%(+0.925)#40 | 1.1%(+0.560)#4,344 |
| 41. | Hartsville | 1.6% | 0.73%(+0.898)#41 | 1.1%(+0.533)#4,425 |
| 42. | Troy | 1.6% | 0.73%(+0.861)#42 | 1.1%(+0.496)#4,537 |
| 43. | Greenwood | 1.6% | 0.73%(+0.855)#43 | 1.1%(+0.491)#4,553 |
| 44. | Surfside Beach | 1.6% | 0.73%(+0.832)#44 | 1.1%(+0.468)#4,628 |
| 45. | Columbia | 1.6% | 0.73%(+0.829)#45 | 1.1%(+0.464)#4,638 |
| 46. | Hilton Head Island | 1.5% | 0.73%(+0.817)#46 | 1.1%(+0.452)#4,674 |
| 47. | Chesterfield | 1.5% | 0.73%(+0.800)#47 | 1.1%(+0.436)#4,746 |
| 48. | Holly Hill | 1.5% | 0.73%(+0.775)#48 | 1.1%(+0.411)#4,826 |
| 49. | Charleston | 1.5% | 0.73%(+0.772)#49 | 1.1%(+0.408)#4,839 |
| 50. | West Columbia | 1.5% | 0.73%(+0.733)#50 | 1.1%(+0.368)#5,020 |
| 51. | Gilbert | 1.4% | 0.73%(+0.707)#51 | 1.1%(+0.343)#5,126 |
| 52. | Sullivan S Island | 1.4% | 0.73%(+0.697)#52 | 1.1%(+0.333)#5,172 |
| 53. | Aiken | 1.4% | 0.73%(+0.697)#53 | 1.1%(+0.332)#5,178 |
| 54. | Landrum | 1.4% | 0.73%(+0.624)#54 | 1.1%(+0.259)#5,450 |
| 55. | Summerton | 1.3% | 0.73%(+0.584)#55 | 1.1%(+0.219)#5,628 |
| 56. | Capitol View | 1.3% | 0.73%(+0.550)#56 | 1.1%(+0.185)#5,788 |
| 57. | Utica | 1.3% | 0.73%(+0.543)#57 | 1.1%(+0.178)#5,819 |
| 58. | Five Forks | 1.2% | 0.73%(+0.523)#58 | 1.1%(+0.159)#5,903 |
| 59. | Edisto Beach | 1.2% | 0.73%(+0.475)#59 | 1.1%(+0.110)#6,123 |
| 60. | Jackson | 1.2% | 0.73%(+0.467)#60 | 1.1%(+0.103)#6,166 |
| 61. | Dunean | 1.2% | 0.73%(+0.458)#61 | 1.1%(+0.094)#6,209 |
| 62. | Orangeburg | 1.2% | 0.73%(+0.454)#62 | 1.1%(+0.089)#6,233 |
| 63. | Belvedere | 1.2% | 0.73%(+0.446)#63 | 1.1%(+0.081)#6,275 |
| 64. | Ridgeville | 1.2% | 0.73%(+0.443)#64 | 1.1%(+0.079)#6,283 |
| 65. | Elgin | 1.2% | 0.73%(+0.436)#65 | 1.1%(+0.072)#6,307 |
| 66. | Barnwell | 1.1% | 0.73%(+0.345)#66 | 1.1%(-0.019)#6,788 |
| 67. | Bonneau | 1.1% | 0.73%(+0.338)#67 | 1.1%(-0.027)#6,826 |
| 68. | Hilltop | 1.1% | 0.73%(+0.333)#68 | 1.1%(-0.031)#6,847 |
| 69. | Sumter | 1.0% | 0.73%(+0.309)#69 | 1.1%(-0.055)#6,953 |
| 70. | New Ellenton | 1.0% | 0.73%(+0.302)#70 | 1.1%(-0.062)#7,001 |
| 71. | Summerville | 0.95% | 0.73%(+0.224)#71 | 1.1%(-0.141)#7,501 |
| 72. | Chapin | 0.93% | 0.73%(+0.201)#72 | 1.1%(-0.164)#7,635 |
| 73. | Heath Springs | 0.92% | 0.73%(+0.194)#73 | 1.1%(-0.171)#7,693 |
| 74. | Greenville | 0.92% | 0.73%(+0.190)#74 | 1.1%(-0.175)#7,721 |
| 75. | La France | 0.90% | 0.73%(+0.178)#75 | 1.1%(-0.187)#7,792 |
| 76. | Clearwater | 0.90% | 0.73%(+0.175)#76 | 1.1%(-0.190)#7,812 |
| 77. | Lesslie | 0.87% | 0.73%(+0.147)#77 | 1.1%(-0.217)#7,987 |
| 78. | Anderson | 0.87% | 0.73%(+0.139)#78 | 1.1%(-0.225)#8,041 |
| 79. | Meggett | 0.86% | 0.73%(+0.133)#79 | 1.1%(-0.231)#8,077 |
| 80. | Pine Ridge | 0.84% | 0.73%(+0.115)#80 | 1.1%(-0.249)#8,207 |
| 81. | Coward | 0.84% | 0.73%(+0.111)#81 | 1.1%(-0.254)#8,248 |
| 82. | Springdale | 0.83% | 0.73%(+0.099)#82 | 1.1%(-0.266)#8,318 |
| 83. | Rock Hill | 0.82% | 0.73%(+0.097)#83 | 1.1%(-0.267)#8,330 |
| 84. | North Augusta | 0.80% | 0.73%(+0.070)#84 | 1.1%(-0.295)#8,498 |
| 85. | Sangaree | 0.79% | 0.73%(+0.061)#85 | 1.1%(-0.304)#8,559 |
| 86. | Belton | 0.78% | 0.73%(+0.050)#86 | 1.1%(-0.315)#8,625 |
| 87. | Cayce | 0.77% | 0.73%(+0.041)#87 | 1.1%(-0.324)#8,696 |
| 88. | Murrells Inlet | 0.76% | 0.73%(+0.038)#88 | 1.1%(-0.327)#8,715 |
| 89. | Norway | 0.76% | 0.73%(+0.037)#89 | 1.1%(-0.328)#8,722 |
| 90. | Due West | 0.76% | 0.73%(+0.035)#90 | 1.1%(-0.329)#8,735 |
| 91. | Winnsboro | 0.74% | 0.73%(+0.019)#91 | 1.1%(-0.346)#8,858 |
| 92. | Prosperity | 0.73% | 0.73%(+0.006)#92 | 1.1%(-0.358)#8,946 |
| 93. | Carolina Forest | 0.71% | 0.73%(-0.021)#93 | 1.1%(-0.386)#9,150 |
| 94. | Berea | 0.69% | 0.73%(-0.034)#94 | 1.1%(-0.399)#9,247 |
| 95. | Northlake | 0.69% | 0.73%(-0.036)#95 | 1.1%(-0.401)#9,260 |
| 96. | Easley | 0.68% | 0.73%(-0.047)#96 | 1.1%(-0.412)#9,346 |
| 97. | Dentsville | 0.67% | 0.73%(-0.058)#97 | 1.1%(-0.423)#9,428 |
| 98. | Seven Oaks | 0.67% | 0.73%(-0.060)#98 | 1.1%(-0.425)#9,447 |
| 99. | Powdersville | 0.66% | 0.73%(-0.063)#99 | 1.1%(-0.427)#9,464 |
| 100. | Conway | 0.65% | 0.73%(-0.074)#100 | 1.1%(-0.439)#9,555 |
Common Questions
What are the Top 10 Cities with the Highest Percentage of Population Employed in Life, Physical & Social Science in South Carolina?
Top 10 Cities with the Highest Percentage of Population Employed in Life, Physical & Social Science in South Carolina are:
#1
9.3%
#2
7.3%
#3
4.6%
#4
4.2%
#5
4.0%
#6
3.7%
#7
3.7%
#8
3.7%
#9
3.6%
#10
3.5%
What city has the Highest Percentage of Population Employed in Life, Physical & Social Science in South Carolina?
Neeses has the Highest Percentage of Population Employed in Life, Physical & Social Science in South Carolina with 9.3%.
What is the Percentage of Population Employed in Life, Physical & Social Science in the State of South Carolina?
Percentage of Population Employed in Life, Physical & Social Science in South Carolina is 0.73%.
What is the Percentage of Population Employed in Life, Physical & Social Science in the United States?
Percentage of Population Employed in Life, Physical & Social Science in the United States is 1.1%.