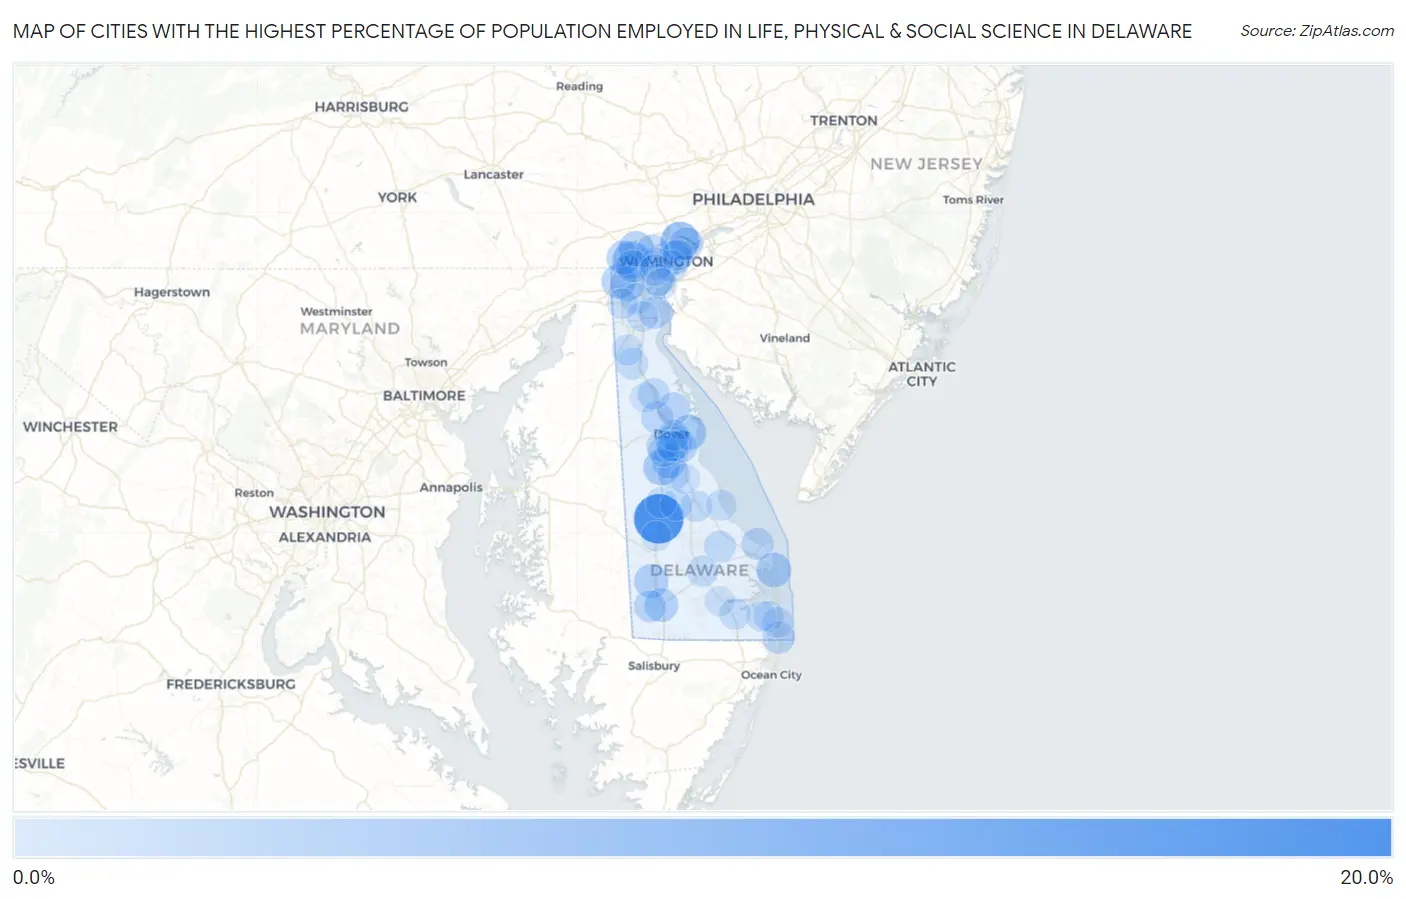
Cities with the Highest Percentage of Population Employed in Life, Physical & Social Science in Delaware
RELATED REPORTS & OPTIONS
Life, Physical & Social Science
Delaware
Compare Cities
Map of Cities with the Highest Percentage of Population Employed in Life, Physical & Social Science in Delaware
0.0%
20.0%

Cities with the Highest Percentage of Population Employed in Life, Physical & Social Science in Delaware
| City | % Employed | vs State | vs National | |
| 1. | Farmington | 17.0% | 1.5%(+15.5)#1 | 1.1%(+16.0)#97 |
| 2. | Arden | 7.4% | 1.5%(+5.81)#2 | 1.1%(+6.27)#387 |
| 3. | Pike Creek | 6.0% | 1.5%(+4.44)#3 | 1.1%(+4.89)#586 |
| 4. | Kent Acres | 5.1% | 1.5%(+3.59)#4 | 1.1%(+4.04)#759 |
| 5. | Viola | 4.9% | 1.5%(+3.33)#5 | 1.1%(+3.79)#822 |
| 6. | Little Creek | 4.4% | 1.5%(+2.87)#6 | 1.1%(+3.32)#991 |
| 7. | Hockessin | 4.3% | 1.5%(+2.71)#7 | 1.1%(+3.17)#1,056 |
| 8. | Lincoln | 4.1% | 1.5%(+2.51)#8 | 1.1%(+2.97)#1,131 |
| 9. | Dewey Beach | 4.0% | 1.5%(+2.50)#9 | 1.1%(+2.96)#1,136 |
| 10. | Newark | 3.7% | 1.5%(+2.16)#10 | 1.1%(+2.62)#1,317 |
| 11. | Brookside | 3.6% | 1.5%(+2.04)#11 | 1.1%(+2.50)#1,404 |
| 12. | Woodside East | 3.6% | 1.5%(+2.04)#12 | 1.1%(+2.49)#1,408 |
| 13. | Seaford | 3.6% | 1.5%(+2.03)#13 | 1.1%(+2.48)#1,413 |
| 14. | North Star | 3.4% | 1.5%(+1.83)#14 | 1.1%(+2.29)#1,560 |
| 15. | Laurel | 3.1% | 1.5%(+1.56)#15 | 1.1%(+2.01)#1,789 |
| 16. | Edgemoor | 3.0% | 1.5%(+1.42)#16 | 1.1%(+1.88)#1,906 |
| 17. | Claymont | 2.8% | 1.5%(+1.23)#17 | 1.1%(+1.69)#2,116 |
| 18. | Greenville | 2.6% | 1.5%(+1.01)#18 | 1.1%(+1.46)#2,428 |
| 19. | Dover Base Housing | 2.2% | 1.5%(+0.703)#19 | 1.1%(+1.16)#2,948 |
| 20. | Leipsic | 2.2% | 1.5%(+0.701)#20 | 1.1%(+1.16)#2,956 |
| 21. | Elsmere | 2.1% | 1.5%(+0.536)#21 | 1.1%(+0.990)#3,263 |
| 22. | Cheswold | 2.1% | 1.5%(+0.529)#22 | 1.1%(+0.984)#3,272 |
| 23. | Pike Creek Valley | 2.1% | 1.5%(+0.505)#23 | 1.1%(+0.960)#3,319 |
| 24. | Delaware City | 2.0% | 1.5%(+0.456)#24 | 1.1%(+0.911)#3,421 |
| 25. | Wilmington Manor | 1.9% | 1.5%(+0.349)#25 | 1.1%(+0.804)#3,669 |
| 26. | Fenwick Island | 1.9% | 1.5%(+0.323)#26 | 1.1%(+0.778)#3,747 |
| 27. | Wyoming | 1.9% | 1.5%(+0.309)#27 | 1.1%(+0.764)#3,782 |
| 28. | Lewes | 1.7% | 1.5%(+0.139)#28 | 1.1%(+0.594)#4,262 |
| 29. | Bethel | 1.7% | 1.5%(+0.135)#29 | 1.1%(+0.590)#4,279 |
| 30. | Wilmington | 1.6% | 1.5%(+0.013)#30 | 1.1%(+0.468)#4,629 |
| 31. | Newport | 1.5% | 1.5%(-0.067)#31 | 1.1%(+0.388)#4,941 |
| 32. | Smyrna | 1.5% | 1.5%(-0.085)#32 | 1.1%(+0.370)#5,010 |
| 33. | Riverview | 1.4% | 1.5%(-0.101)#33 | 1.1%(+0.354)#5,073 |
| 34. | Milford | 1.3% | 1.5%(-0.235)#34 | 1.1%(+0.220)#5,620 |
| 35. | Townsend | 1.3% | 1.5%(-0.243)#35 | 1.1%(+0.212)#5,659 |
| 36. | Milton | 1.3% | 1.5%(-0.268)#36 | 1.1%(+0.186)#5,776 |
| 37. | Camden | 1.2% | 1.5%(-0.352)#37 | 1.1%(+0.102)#6,168 |
| 38. | Houston | 1.2% | 1.5%(-0.355)#38 | 1.1%(+0.100)#6,178 |
| 39. | Dover | 1.1% | 1.5%(-0.400)#39 | 1.1%(+0.054)#6,392 |
| 40. | Georgetown | 1.1% | 1.5%(-0.483)#40 | 1.1%(-0.028)#6,831 |
| 41. | Bear | 1.1% | 1.5%(-0.485)#41 | 1.1%(-0.030)#6,842 |
| 42. | Highland Acres | 1.1% | 1.5%(-0.493)#42 | 1.1%(-0.038)#6,868 |
| 43. | Bellefonte | 0.97% | 1.5%(-0.576)#43 | 1.1%(-0.121)#7,375 |
| 44. | Dagsboro | 0.95% | 1.5%(-0.593)#44 | 1.1%(-0.139)#7,482 |
| 45. | Middletown | 0.85% | 1.5%(-0.695)#45 | 1.1%(-0.241)#8,137 |
| 46. | New Castle | 0.84% | 1.5%(-0.706)#46 | 1.1%(-0.252)#8,223 |
| 47. | St Georges | 0.77% | 1.5%(-0.771)#47 | 1.1%(-0.317)#8,645 |
| 48. | Harrington | 0.76% | 1.5%(-0.782)#48 | 1.1%(-0.328)#8,718 |
| 49. | South Bethany | 0.69% | 1.5%(-0.851)#49 | 1.1%(-0.396)#9,239 |
| 50. | Ocean View | 0.66% | 1.5%(-0.886)#50 | 1.1%(-0.431)#9,497 |
| 51. | Millville | 0.60% | 1.5%(-0.944)#51 | 1.1%(-0.489)#9,964 |
| 52. | Glasgow | 0.58% | 1.5%(-0.966)#52 | 1.1%(-0.511)#10,132 |
| 53. | Slaughter Beach | 0.57% | 1.5%(-0.971)#53 | 1.1%(-0.516)#10,171 |
| 54. | Greenwood | 0.23% | 1.5%(-1.32)#54 | 1.1%(-0.863)#12,650 |
| 55. | Frederica | 0.21% | 1.5%(-1.34)#55 | 1.1%(-0.884)#12,737 |
| 56. | Clayton | 0.17% | 1.5%(-1.38)#56 | 1.1%(-0.923)#12,886 |
| 57. | Millsboro | 0.095% | 1.5%(-1.45)#57 | 1.1%(-0.996)#13,085 |
1
Common Questions
What are the Top 10 Cities with the Highest Percentage of Population Employed in Life, Physical & Social Science in Delaware?
Top 10 Cities with the Highest Percentage of Population Employed in Life, Physical & Social Science in Delaware are:
#1
17.0%
#2
7.4%
#3
6.0%
#4
5.1%
#5
4.9%
#6
4.4%
#7
4.3%
#8
4.0%
#9
3.7%
#10
3.6%
What city has the Highest Percentage of Population Employed in Life, Physical & Social Science in Delaware?
Farmington has the Highest Percentage of Population Employed in Life, Physical & Social Science in Delaware with 17.0%.
What is the Percentage of Population Employed in Life, Physical & Social Science in the State of Delaware?
Percentage of Population Employed in Life, Physical & Social Science in Delaware is 1.5%.
What is the Percentage of Population Employed in Life, Physical & Social Science in the United States?
Percentage of Population Employed in Life, Physical & Social Science in the United States is 1.1%.