Cities with the Highest Percentage of Population Employed in Life, Physical & Social Science in Arizona
RELATED REPORTS & OPTIONS
Life, Physical & Social Science
Arizona
Compare Cities
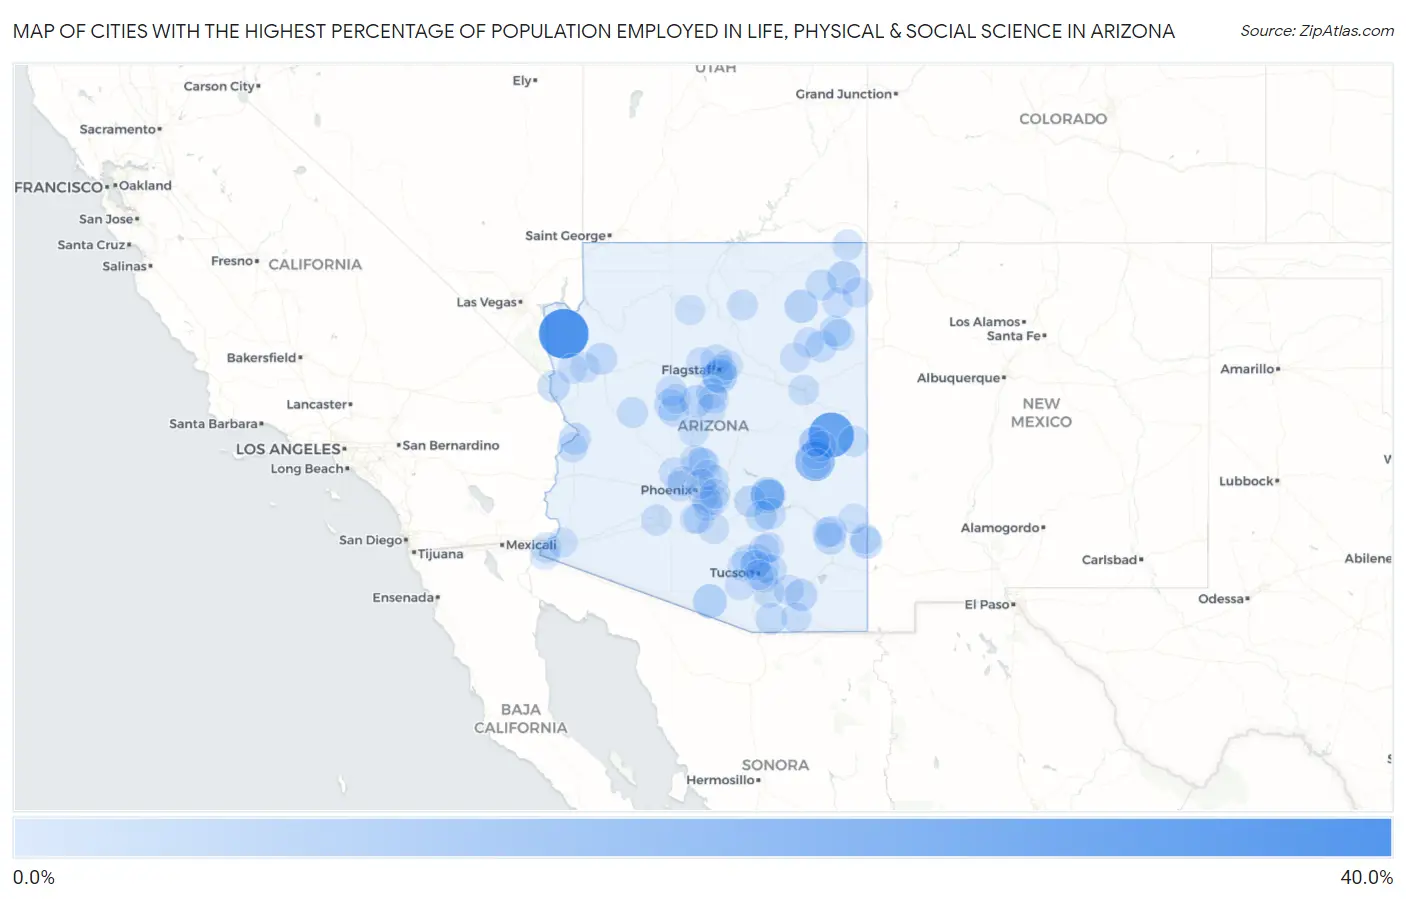
Map of Cities with the Highest Percentage of Population Employed in Life, Physical & Social Science in Arizona
0.0%
40.0%
Cities with the Highest Percentage of Population Employed in Life, Physical & Social Science in Arizona
| City | % Employed | vs State | vs National | |
| 1. | White Hills | 36.6% | 0.83%(+35.8)#1 | 1.1%(+35.5)#29 |
| 2. | Vernon | 28.2% | 0.83%(+27.3)#2 | 1.1%(+27.1)#47 |
| 3. | Rainbow City | 17.7% | 0.83%(+16.9)#3 | 1.1%(+16.7)#88 |
| 4. | Blue Ridge | 9.5% | 0.83%(+8.63)#4 | 1.1%(+8.37)#257 |
| 5. | Mountainaire | 8.2% | 0.83%(+7.40)#5 | 1.1%(+7.14)#324 |
| 6. | Topawa | 7.5% | 0.83%(+6.63)#6 | 1.1%(+6.37)#379 |
| 7. | Red Lake | 6.5% | 0.83%(+5.71)#7 | 1.1%(+5.45)#497 |
| 8. | Icehouse Canyon | 6.5% | 0.83%(+5.70)#8 | 1.1%(+5.45)#498 |
| 9. | Central Heights Midland City | 6.4% | 0.83%(+5.54)#9 | 1.1%(+5.28)#518 |
| 10. | Pinon | 6.2% | 0.83%(+5.40)#10 | 1.1%(+5.14)#547 |
| 11. | Round Rock | 6.1% | 0.83%(+5.23)#11 | 1.1%(+4.97)#570 |
| 12. | Clarkdale | 4.6% | 0.83%(+3.81)#12 | 1.1%(+3.55)#898 |
| 13. | Franklin | 4.3% | 0.83%(+3.52)#13 | 1.1%(+3.26)#1,025 |
| 14. | St David | 4.2% | 0.83%(+3.37)#14 | 1.1%(+3.11)#1,078 |
| 15. | Mesquite Creek | 3.9% | 0.83%(+3.04)#15 | 1.1%(+2.79)#1,238 |
| 16. | Swift Trail Junction | 3.8% | 0.83%(+2.94)#16 | 1.1%(+2.68)#1,287 |
| 17. | Williamson | 3.6% | 0.83%(+2.79)#17 | 1.1%(+2.53)#1,393 |
| 18. | Hackberry | 3.6% | 0.83%(+2.72)#18 | 1.1%(+2.46)#1,437 |
| 19. | Cienega Springs | 3.5% | 0.83%(+2.70)#19 | 1.1%(+2.44)#1,456 |
| 20. | Superior | 3.4% | 0.83%(+2.55)#20 | 1.1%(+2.29)#1,556 |
| 21. | Dripping Springs | 3.3% | 0.83%(+2.43)#21 | 1.1%(+2.17)#1,644 |
| 22. | Greasewood | 3.2% | 0.83%(+2.39)#22 | 1.1%(+2.13)#1,679 |
| 23. | Patagonia | 3.2% | 0.83%(+2.33)#23 | 1.1%(+2.07)#1,723 |
| 24. | Kachina Village | 3.0% | 0.83%(+2.14)#24 | 1.1%(+1.89)#1,900 |
| 25. | Ganado | 2.9% | 0.83%(+2.08)#25 | 1.1%(+1.82)#1,957 |
| 26. | Globe | 2.8% | 0.83%(+1.98)#26 | 1.1%(+1.72)#2,069 |
| 27. | Burnside | 2.8% | 0.83%(+1.93)#27 | 1.1%(+1.67)#2,144 |
| 28. | Fort Valley | 2.7% | 0.83%(+1.91)#28 | 1.1%(+1.65)#2,167 |
| 29. | Prescott | 2.7% | 0.83%(+1.86)#29 | 1.1%(+1.60)#2,234 |
| 30. | Oro Valley | 2.6% | 0.83%(+1.82)#30 | 1.1%(+1.56)#2,286 |
| 31. | Kearny | 2.5% | 0.83%(+1.65)#31 | 1.1%(+1.39)#2,545 |
| 32. | Safford | 2.4% | 0.83%(+1.61)#32 | 1.1%(+1.36)#2,607 |
| 33. | Springerville | 2.3% | 0.83%(+1.51)#33 | 1.1%(+1.25)#2,789 |
| 34. | Flagstaff | 2.3% | 0.83%(+1.50)#34 | 1.1%(+1.25)#2,801 |
| 35. | North Fork | 2.3% | 0.83%(+1.45)#35 | 1.1%(+1.19)#2,870 |
| 36. | Sedona | 2.3% | 0.83%(+1.42)#36 | 1.1%(+1.17)#2,932 |
| 37. | Marana | 2.2% | 0.83%(+1.41)#37 | 1.1%(+1.15)#2,962 |
| 38. | Mountain View Ranches | 2.2% | 0.83%(+1.39)#38 | 1.1%(+1.13)#2,989 |
| 39. | Carefree | 2.2% | 0.83%(+1.36)#39 | 1.1%(+1.10)#3,050 |
| 40. | Bagdad | 2.2% | 0.83%(+1.36)#40 | 1.1%(+1.10)#3,052 |
| 41. | Rough Rock | 2.2% | 0.83%(+1.34)#41 | 1.1%(+1.08)#3,086 |
| 42. | Paulden | 2.1% | 0.83%(+1.31)#42 | 1.1%(+1.06)#3,136 |
| 43. | Saddlebrooke | 2.1% | 0.83%(+1.30)#43 | 1.1%(+1.04)#3,168 |
| 44. | Gila Bend | 2.1% | 0.83%(+1.28)#44 | 1.1%(+1.02)#3,209 |
| 45. | Corona De Tucson | 2.0% | 0.83%(+1.16)#45 | 1.1%(+0.904)#3,435 |
| 46. | Cave Creek | 1.9% | 0.83%(+1.03)#46 | 1.1%(+0.774)#3,758 |
| 47. | Catalina Foothills | 1.8% | 0.83%(+0.998)#47 | 1.1%(+0.740)#3,843 |
| 48. | Tanque Verde | 1.8% | 0.83%(+0.989)#48 | 1.1%(+0.731)#3,868 |
| 49. | Tucson Mountains | 1.8% | 0.83%(+0.977)#49 | 1.1%(+0.719)#3,900 |
| 50. | Tempe | 1.7% | 0.83%(+0.899)#50 | 1.1%(+0.641)#4,118 |
| 51. | Tuba City | 1.7% | 0.83%(+0.861)#51 | 1.1%(+0.603)#4,241 |
| 52. | Red Mesa | 1.6% | 0.83%(+0.807)#52 | 1.1%(+0.548)#4,377 |
| 53. | Holbrook | 1.6% | 0.83%(+0.794)#53 | 1.1%(+0.536)#4,417 |
| 54. | Mescal | 1.5% | 0.83%(+0.702)#54 | 1.1%(+0.444)#4,710 |
| 55. | Casa Grande | 1.5% | 0.83%(+0.620)#55 | 1.1%(+0.361)#5,049 |
| 56. | Duncan | 1.4% | 0.83%(+0.596)#56 | 1.1%(+0.338)#5,146 |
| 57. | Oracle | 1.4% | 0.83%(+0.553)#57 | 1.1%(+0.295)#5,289 |
| 58. | Thatcher | 1.4% | 0.83%(+0.535)#58 | 1.1%(+0.276)#5,358 |
| 59. | Lake Of The Woods | 1.4% | 0.83%(+0.523)#59 | 1.1%(+0.264)#5,425 |
| 60. | Timberline-Fernwood | 1.3% | 0.83%(+0.465)#60 | 1.1%(+0.207)#5,687 |
| 61. | Doney Park | 1.3% | 0.83%(+0.460)#61 | 1.1%(+0.201)#5,711 |
| 62. | Whitecone | 1.2% | 0.83%(+0.402)#62 | 1.1%(+0.144)#5,962 |
| 63. | Three Points | 1.2% | 0.83%(+0.352)#63 | 1.1%(+0.094)#6,210 |
| 64. | Village Of Oak Creek Big Park | 1.2% | 0.83%(+0.331)#64 | 1.1%(+0.072)#6,304 |
| 65. | Parks | 1.1% | 0.83%(+0.308)#65 | 1.1%(+0.050)#6,413 |
| 66. | Fountain Hills | 1.1% | 0.83%(+0.284)#66 | 1.1%(+0.026)#6,531 |
| 67. | Tucson | 1.1% | 0.83%(+0.279)#67 | 1.1%(+0.020)#6,563 |
| 68. | Litchfield Park | 1.1% | 0.83%(+0.278)#68 | 1.1%(+0.020)#6,580 |
| 69. | Cordes Lakes | 1.1% | 0.83%(+0.276)#69 | 1.1%(+0.018)#6,590 |
| 70. | Parker | 1.1% | 0.83%(+0.271)#70 | 1.1%(+0.013)#6,616 |
| 71. | Picture Rocks | 1.1% | 0.83%(+0.258)#71 | 1.1%(-0.000)#6,696 |
| 72. | Mcnary | 1.1% | 0.83%(+0.254)#72 | 1.1%(-0.004)#6,713 |
| 73. | Chinle | 1.1% | 0.83%(+0.242)#73 | 1.1%(-0.017)#6,778 |
| 74. | Maricopa | 1.0% | 0.83%(+0.214)#74 | 1.1%(-0.044)#6,901 |
| 75. | Pinetop Lakeside | 1.0% | 0.83%(+0.201)#75 | 1.1%(-0.057)#6,964 |
| 76. | Tsaile | 1.0% | 0.83%(+0.180)#76 | 1.1%(-0.079)#7,091 |
| 77. | Sierra Vista | 1.00% | 0.83%(+0.167)#77 | 1.1%(-0.091)#7,180 |
| 78. | Dilkon | 0.98% | 0.83%(+0.148)#78 | 1.1%(-0.111)#7,299 |
| 79. | Surprise | 0.97% | 0.83%(+0.139)#79 | 1.1%(-0.120)#7,356 |
| 80. | Casas Adobes | 0.97% | 0.83%(+0.138)#80 | 1.1%(-0.120)#7,357 |
| 81. | Sun Lakes | 0.96% | 0.83%(+0.124)#81 | 1.1%(-0.134)#7,455 |
| 82. | Kingman | 0.92% | 0.83%(+0.085)#82 | 1.1%(-0.174)#7,715 |
| 83. | Somerton | 0.91% | 0.83%(+0.081)#83 | 1.1%(-0.177)#7,733 |
| 84. | Gilbert | 0.90% | 0.83%(+0.066)#84 | 1.1%(-0.193)#7,833 |
| 85. | Whiteriver | 0.89% | 0.83%(+0.058)#85 | 1.1%(-0.201)#7,881 |
| 86. | Clifton | 0.89% | 0.83%(+0.057)#86 | 1.1%(-0.202)#7,887 |
| 87. | Chandler | 0.86% | 0.83%(+0.030)#87 | 1.1%(-0.228)#8,048 |
| 88. | Youngtown | 0.85% | 0.83%(+0.016)#88 | 1.1%(-0.242)#8,152 |
| 89. | San Luis | 0.84% | 0.83%(+0.011)#89 | 1.1%(-0.247)#8,195 |
| 90. | New River | 0.81% | 0.83%(-0.019)#90 | 1.1%(-0.278)#8,391 |
| 91. | Scottsdale | 0.80% | 0.83%(-0.035)#91 | 1.1%(-0.293)#8,483 |
| 92. | Paradise Valley | 0.78% | 0.83%(-0.048)#92 | 1.1%(-0.307)#8,572 |
| 93. | Ak Chin Village | 0.77% | 0.83%(-0.063)#93 | 1.1%(-0.322)#8,683 |
| 94. | Lake Montezuma | 0.74% | 0.83%(-0.089)#94 | 1.1%(-0.347)#8,866 |
| 95. | Fortuna Foothills | 0.71% | 0.83%(-0.121)#95 | 1.1%(-0.379)#9,103 |
| 96. | Chino Valley | 0.70% | 0.83%(-0.129)#96 | 1.1%(-0.387)#9,168 |
| 97. | Mesa | 0.70% | 0.83%(-0.129)#97 | 1.1%(-0.387)#9,170 |
| 98. | Golden Valley | 0.69% | 0.83%(-0.147)#98 | 1.1%(-0.406)#9,294 |
| 99. | South Tucson | 0.67% | 0.83%(-0.161)#99 | 1.1%(-0.419)#9,395 |
| 100. | Grand Canyon Village | 0.67% | 0.83%(-0.165)#100 | 1.1%(-0.424)#9,433 |
Common Questions
What are the Top 10 Cities with the Highest Percentage of Population Employed in Life, Physical & Social Science in Arizona?
Top 10 Cities with the Highest Percentage of Population Employed in Life, Physical & Social Science in Arizona are:
#1
36.6%
#2
28.2%
#3
17.7%
#4
8.2%
#5
7.5%
#6
6.5%
#7
6.4%
#8
6.2%
#9
6.1%
#10
4.6%
What city has the Highest Percentage of Population Employed in Life, Physical & Social Science in Arizona?
White Hills has the Highest Percentage of Population Employed in Life, Physical & Social Science in Arizona with 36.6%.
What is the Percentage of Population Employed in Life, Physical & Social Science in the State of Arizona?
Percentage of Population Employed in Life, Physical & Social Science in Arizona is 0.83%.
What is the Percentage of Population Employed in Life, Physical & Social Science in the United States?
Percentage of Population Employed in Life, Physical & Social Science in the United States is 1.1%.