Cities with the Highest Percentage of Population Employed in Life, Physical & Social Science in Iowa
RELATED REPORTS & OPTIONS
Life, Physical & Social Science
Iowa
Compare Cities
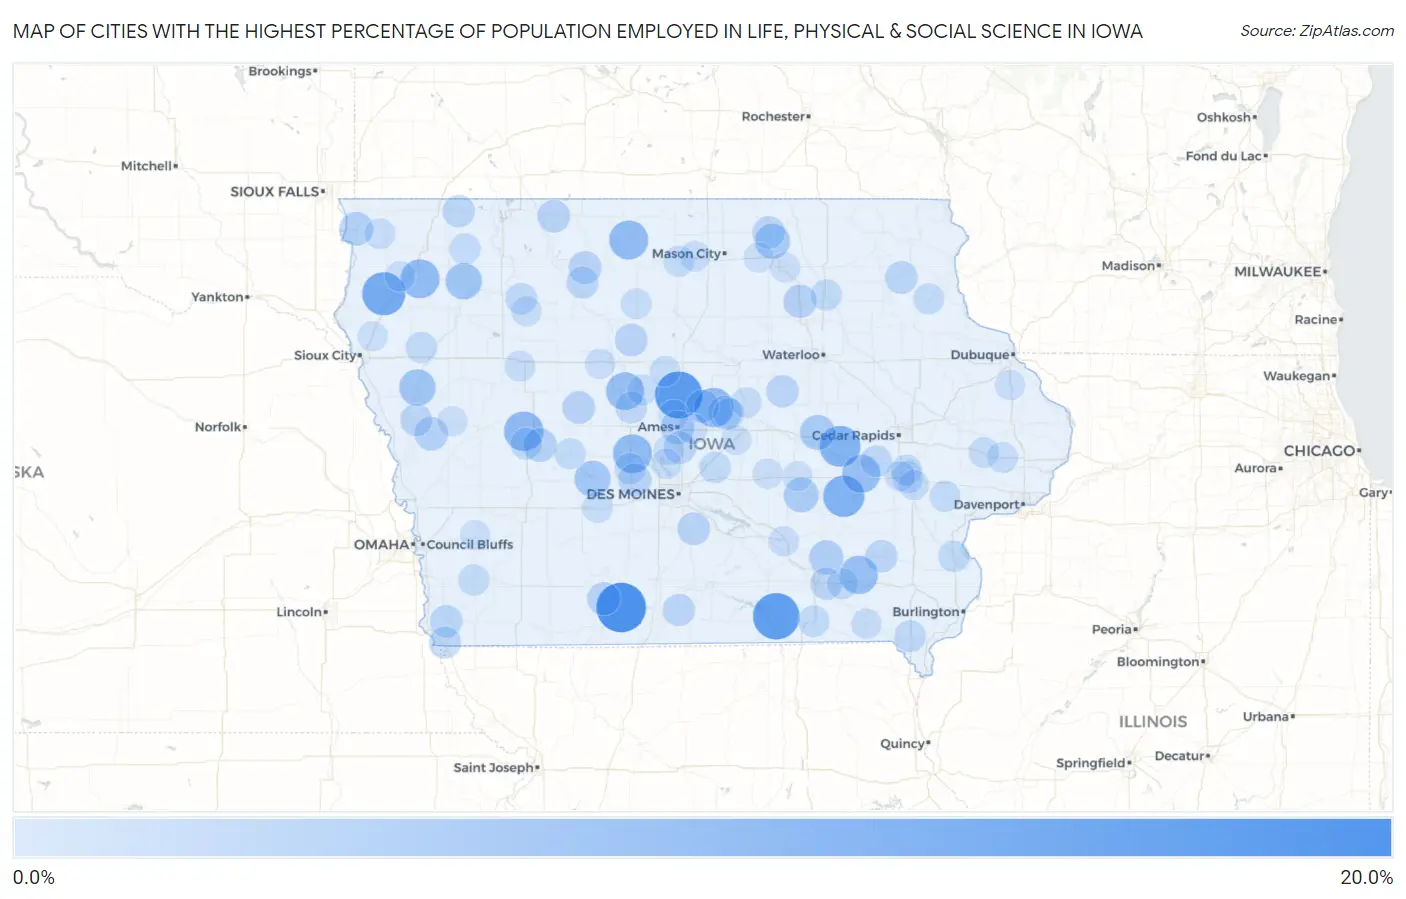
Map of Cities with the Highest Percentage of Population Employed in Life, Physical & Social Science in Iowa
0.0%
20.0%
Cities with the Highest Percentage of Population Employed in Life, Physical & Social Science in Iowa
| City | % Employed | vs State | vs National | |
| 1. | Ellston | 16.7% | 0.95%(+15.7)#1 | 1.1%(+15.6)#99 |
| 2. | Randall | 14.9% | 0.95%(+13.9)#2 | 1.1%(+13.8)#117 |
| 3. | Udell | 14.3% | 0.95%(+13.3)#3 | 1.1%(+13.2)#133 |
| 4. | Struble | 11.8% | 0.95%(+10.8)#4 | 1.1%(+10.7)#178 |
| 5. | Millersburg | 10.3% | 0.95%(+9.35)#5 | 1.1%(+9.20)#217 |
| 6. | Luzerne | 10.0% | 0.95%(+9.05)#6 | 1.1%(+8.91)#229 |
| 7. | Halbur | 9.0% | 0.95%(+8.01)#7 | 1.1%(+7.86)#283 |
| 8. | Zearing | 8.7% | 0.95%(+7.78)#8 | 1.1%(+7.63)#292 |
| 9. | Titonka | 8.6% | 0.95%(+7.64)#9 | 1.1%(+7.49)#300 |
| 10. | Granville | 8.6% | 0.95%(+7.63)#10 | 1.1%(+7.48)#303 |
| 11. | Bouton | 8.6% | 0.95%(+7.63)#11 | 1.1%(+7.48)#304 |
| 12. | Maharishi Vedic City | 7.9% | 0.95%(+6.98)#12 | 1.1%(+6.83)#348 |
| 13. | Conroy | 7.9% | 0.95%(+6.95)#13 | 1.1%(+6.80)#351 |
| 14. | Dayton | 7.7% | 0.95%(+6.80)#14 | 1.1%(+6.66)#359 |
| 15. | Oto | 6.7% | 0.95%(+5.72)#15 | 1.1%(+5.58)#472 |
| 16. | Sutherland | 6.5% | 0.95%(+5.59)#16 | 1.1%(+5.44)#499 |
| 17. | Panora | 6.3% | 0.95%(+5.37)#17 | 1.1%(+5.22)#528 |
| 18. | Orchard | 5.6% | 0.95%(+4.61)#18 | 1.1%(+4.46)#657 |
| 19. | Vining | 5.6% | 0.95%(+4.61)#19 | 1.1%(+4.46)#659 |
| 20. | Montezuma | 5.5% | 0.95%(+4.54)#20 | 1.1%(+4.39)#672 |
| 21. | Hedrick | 5.0% | 0.95%(+4.02)#21 | 1.1%(+3.88)#800 |
| 22. | Inwood | 4.7% | 0.95%(+3.76)#22 | 1.1%(+3.61)#875 |
| 23. | Moscow | 4.5% | 0.95%(+3.60)#23 | 1.1%(+3.45)#929 |
| 24. | Soldier | 4.5% | 0.95%(+3.60)#24 | 1.1%(+3.45)#933 |
| 25. | St Anthony | 4.5% | 0.95%(+3.60)#25 | 1.1%(+3.45)#937 |
| 26. | Ames | 4.5% | 0.95%(+3.59)#26 | 1.1%(+3.44)#944 |
| 27. | Dedham | 4.5% | 0.95%(+3.57)#27 | 1.1%(+3.42)#948 |
| 28. | Plainfield | 4.3% | 0.95%(+3.38)#28 | 1.1%(+3.24)#1,033 |
| 29. | Shannon City | 4.2% | 0.95%(+3.22)#29 | 1.1%(+3.08)#1,093 |
| 30. | Dallas Center | 4.0% | 0.95%(+3.10)#30 | 1.1%(+2.95)#1,138 |
| 31. | Mccallsburg | 4.0% | 0.95%(+3.05)#31 | 1.1%(+2.91)#1,164 |
| 32. | Kent Estates | 4.0% | 0.95%(+3.03)#32 | 1.1%(+2.88)#1,182 |
| 33. | Whittemore | 3.9% | 0.95%(+2.99)#33 | 1.1%(+2.84)#1,204 |
| 34. | Vincent | 3.9% | 0.95%(+2.95)#34 | 1.1%(+2.81)#1,228 |
| 35. | Ackworth | 3.8% | 0.95%(+2.90)#35 | 1.1%(+2.76)#1,251 |
| 36. | Gruver | 3.8% | 0.95%(+2.90)#36 | 1.1%(+2.76)#1,254 |
| 37. | Churdan | 3.8% | 0.95%(+2.88)#37 | 1.1%(+2.74)#1,261 |
| 38. | Clermont | 3.8% | 0.95%(+2.81)#38 | 1.1%(+2.67)#1,293 |
| 39. | Sidney | 3.7% | 0.95%(+2.78)#39 | 1.1%(+2.63)#1,308 |
| 40. | Osage | 3.7% | 0.95%(+2.76)#40 | 1.1%(+2.61)#1,332 |
| 41. | Huxley | 3.7% | 0.95%(+2.74)#41 | 1.1%(+2.60)#1,339 |
| 42. | Lincoln | 3.6% | 0.95%(+2.69)#42 | 1.1%(+2.55)#1,385 |
| 43. | Brighton | 3.6% | 0.95%(+2.63)#43 | 1.1%(+2.48)#1,415 |
| 44. | Ocheyedan | 3.5% | 0.95%(+2.60)#44 | 1.1%(+2.46)#1,439 |
| 45. | Garden Grove | 3.5% | 0.95%(+2.58)#45 | 1.1%(+2.44)#1,460 |
| 46. | Castana | 3.5% | 0.95%(+2.53)#46 | 1.1%(+2.39)#1,500 |
| 47. | West Bend | 3.5% | 0.95%(+2.52)#47 | 1.1%(+2.37)#1,507 |
| 48. | Agency | 3.4% | 0.95%(+2.42)#48 | 1.1%(+2.27)#1,569 |
| 49. | Hamburg | 3.4% | 0.95%(+2.41)#49 | 1.1%(+2.26)#1,573 |
| 50. | Pilot Mound | 3.3% | 0.95%(+2.33)#50 | 1.1%(+2.19)#1,630 |
| 51. | Donnellson | 3.3% | 0.95%(+2.31)#51 | 1.1%(+2.17)#1,649 |
| 52. | Amana | 3.2% | 0.95%(+2.25)#52 | 1.1%(+2.10)#1,704 |
| 53. | Templeton | 3.1% | 0.95%(+2.20)#53 | 1.1%(+2.05)#1,748 |
| 54. | Marathon | 3.1% | 0.95%(+2.15)#54 | 1.1%(+2.00)#1,805 |
| 55. | Emerson | 3.0% | 0.95%(+2.09)#55 | 1.1%(+1.94)#1,865 |
| 56. | Coralville | 3.0% | 0.95%(+2.06)#56 | 1.1%(+1.91)#1,882 |
| 57. | Bloomfield | 3.0% | 0.95%(+2.05)#57 | 1.1%(+1.90)#1,891 |
| 58. | Wapello | 2.9% | 0.95%(+1.97)#58 | 1.1%(+1.82)#1,956 |
| 59. | Mingo | 2.9% | 0.95%(+1.95)#59 | 1.1%(+1.80)#1,979 |
| 60. | Minburn | 2.9% | 0.95%(+1.94)#60 | 1.1%(+1.79)#1,981 |
| 61. | Pierson | 2.9% | 0.95%(+1.93)#61 | 1.1%(+1.79)#1,988 |
| 62. | Frederika | 2.9% | 0.95%(+1.91)#62 | 1.1%(+1.77)#2,007 |
| 63. | Elkader | 2.8% | 0.95%(+1.81)#63 | 1.1%(+1.66)#2,156 |
| 64. | Hartley | 2.7% | 0.95%(+1.79)#64 | 1.1%(+1.65)#2,177 |
| 65. | Bayard | 2.7% | 0.95%(+1.76)#65 | 1.1%(+1.61)#2,222 |
| 66. | West Liberty | 2.7% | 0.95%(+1.73)#66 | 1.1%(+1.59)#2,243 |
| 67. | Clemons | 2.7% | 0.95%(+1.72)#67 | 1.1%(+1.58)#2,253 |
| 68. | Batavia | 2.6% | 0.95%(+1.68)#68 | 1.1%(+1.53)#2,326 |
| 69. | North Liberty | 2.6% | 0.95%(+1.67)#69 | 1.1%(+1.52)#2,341 |
| 70. | Garner | 2.6% | 0.95%(+1.66)#70 | 1.1%(+1.51)#2,351 |
| 71. | Calamus | 2.6% | 0.95%(+1.61)#71 | 1.1%(+1.46)#2,435 |
| 72. | Doon | 2.5% | 0.95%(+1.60)#72 | 1.1%(+1.45)#2,445 |
| 73. | Sac City | 2.5% | 0.95%(+1.57)#73 | 1.1%(+1.42)#2,502 |
| 74. | Stuart | 2.4% | 0.95%(+1.48)#74 | 1.1%(+1.33)#2,641 |
| 75. | Renwick | 2.4% | 0.95%(+1.46)#75 | 1.1%(+1.32)#2,667 |
| 76. | Stratford | 2.4% | 0.95%(+1.46)#76 | 1.1%(+1.31)#2,680 |
| 77. | Kamrar | 2.4% | 0.95%(+1.44)#77 | 1.1%(+1.29)#2,719 |
| 78. | Lowden | 2.4% | 0.95%(+1.41)#78 | 1.1%(+1.27)#2,760 |
| 79. | Liscomb | 2.4% | 0.95%(+1.41)#79 | 1.1%(+1.26)#2,773 |
| 80. | Slater | 2.3% | 0.95%(+1.39)#80 | 1.1%(+1.24)#2,803 |
| 81. | Ventura | 2.3% | 0.95%(+1.33)#81 | 1.1%(+1.19)#2,885 |
| 82. | Orange City | 2.3% | 0.95%(+1.32)#82 | 1.1%(+1.18)#2,908 |
| 83. | Nevada | 2.2% | 0.95%(+1.28)#83 | 1.1%(+1.14)#2,982 |
| 84. | Beacon | 2.2% | 0.95%(+1.28)#84 | 1.1%(+1.13)#2,999 |
| 85. | Iowa City | 2.2% | 0.95%(+1.23)#85 | 1.1%(+1.09)#3,076 |
| 86. | Zwingle | 2.2% | 0.95%(+1.23)#86 | 1.1%(+1.08)#3,094 |
| 87. | Polk City | 2.2% | 0.95%(+1.21)#87 | 1.1%(+1.06)#3,124 |
| 88. | Keosauqua | 2.2% | 0.95%(+1.21)#88 | 1.1%(+1.06)#3,126 |
| 89. | Albert City | 2.1% | 0.95%(+1.18)#89 | 1.1%(+1.03)#3,184 |
| 90. | Melbourne | 2.1% | 0.95%(+1.17)#90 | 1.1%(+1.02)#3,199 |
| 91. | Tiffin | 2.1% | 0.95%(+1.16)#91 | 1.1%(+1.01)#3,213 |
| 92. | Moorland | 2.1% | 0.95%(+1.16)#92 | 1.1%(+1.01)#3,215 |
| 93. | Gilbert | 2.1% | 0.95%(+1.15)#93 | 1.1%(+1.01)#3,226 |
| 94. | Malcom | 2.1% | 0.95%(+1.15)#94 | 1.1%(+1.01)#3,231 |
| 95. | Rudd | 2.1% | 0.95%(+1.15)#95 | 1.1%(+1.000)#3,245 |
| 96. | Charles City | 2.1% | 0.95%(+1.14)#96 | 1.1%(+0.998)#3,248 |
| 97. | Oakland | 2.0% | 0.95%(+1.10)#97 | 1.1%(+0.950)#3,335 |
| 98. | Charter Oak | 2.0% | 0.95%(+1.08)#98 | 1.1%(+0.929)#3,389 |
| 99. | Hinton | 2.0% | 0.95%(+1.04)#99 | 1.1%(+0.898)#3,448 |
| 100. | Oakland Acres | 2.0% | 0.95%(+1.04)#100 | 1.1%(+0.889)#3,473 |
Common Questions
What are the Top 10 Cities with the Highest Percentage of Population Employed in Life, Physical & Social Science in Iowa?
Top 10 Cities with the Highest Percentage of Population Employed in Life, Physical & Social Science in Iowa are:
What city has the Highest Percentage of Population Employed in Life, Physical & Social Science in Iowa?
Ellston has the Highest Percentage of Population Employed in Life, Physical & Social Science in Iowa with 16.7%.
What is the Percentage of Population Employed in Life, Physical & Social Science in the State of Iowa?
Percentage of Population Employed in Life, Physical & Social Science in Iowa is 0.95%.
What is the Percentage of Population Employed in Life, Physical & Social Science in the United States?
Percentage of Population Employed in Life, Physical & Social Science in the United States is 1.1%.