Cities with the Highest Percentage of Population Employed in Life, Physical & Social Science in Virginia
RELATED REPORTS & OPTIONS
Life, Physical & Social Science
Virginia
Compare Cities
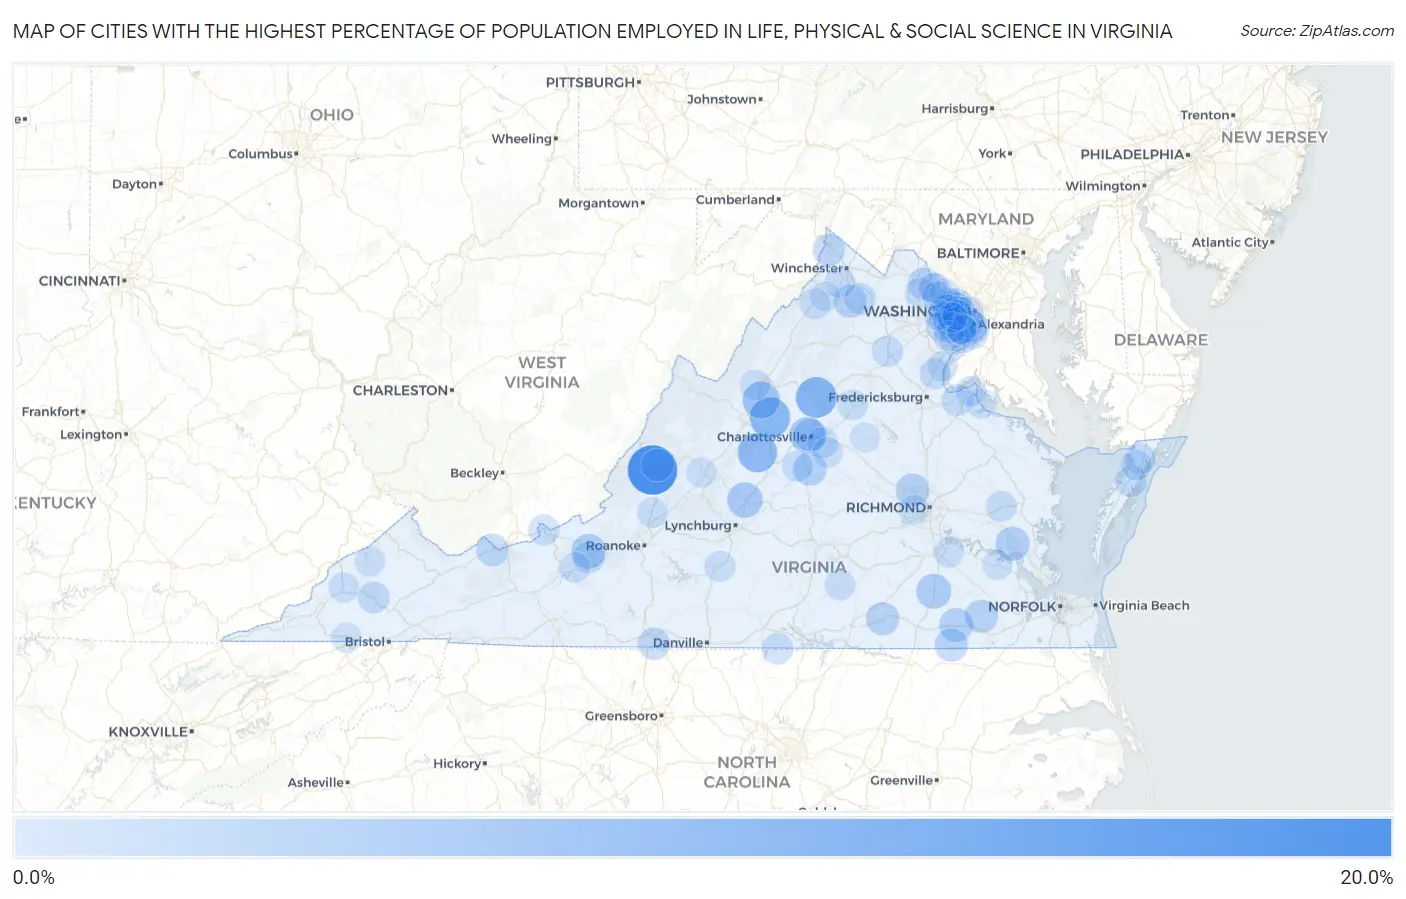
Map of Cities with the Highest Percentage of Population Employed in Life, Physical & Social Science in Virginia
0.0%
20.0%
Cities with the Highest Percentage of Population Employed in Life, Physical & Social Science in Virginia
| City | % Employed | vs State | vs National | |
| 1. | Low Moor | 19.7% | 1.3%(+18.4)#1 | 1.1%(+18.6)#78 |
| 2. | Earlysville | 14.1% | 1.3%(+12.8)#2 | 1.1%(+13.0)#141 |
| 3. | Stanardsville | 11.4% | 1.3%(+10.1)#3 | 1.1%(+10.3)#191 |
| 4. | Crimora | 11.0% | 1.3%(+9.74)#4 | 1.1%(+9.93)#200 |
| 5. | Wintergreen | 10.1% | 1.3%(+8.80)#5 | 1.1%(+8.99)#224 |
| 6. | Weyers Cave | 8.2% | 1.3%(+6.88)#6 | 1.1%(+7.07)#328 |
| 7. | The University Of Virginia's College At Wise | 7.5% | 1.3%(+6.24)#7 | 1.1%(+6.43)#377 |
| 8. | University Of Virginia | 7.0% | 1.3%(+5.74)#8 | 1.1%(+5.92)#434 |
| 9. | Amherst | 6.6% | 1.3%(+5.33)#9 | 1.1%(+5.51)#484 |
| 10. | Stony Creek | 6.1% | 1.3%(+4.81)#10 | 1.1%(+5.00)#564 |
| 11. | Blacksburg | 5.8% | 1.3%(+4.56)#11 | 1.1%(+4.75)#610 |
| 12. | Williamsburg | 5.4% | 1.3%(+4.08)#12 | 1.1%(+4.27)#703 |
| 13. | Capron | 5.2% | 1.3%(+3.90)#13 | 1.1%(+4.08)#755 |
| 14. | Scottsville | 5.0% | 1.3%(+3.72)#14 | 1.1%(+3.91)#789 |
| 15. | Innsbrook | 4.7% | 1.3%(+3.39)#15 | 1.1%(+3.58)#885 |
| 16. | Lawrenceville | 4.6% | 1.3%(+3.37)#16 | 1.1%(+3.55)#895 |
| 17. | Branchville | 4.6% | 1.3%(+3.34)#17 | 1.1%(+3.52)#904 |
| 18. | Shenandoah Shores | 4.6% | 1.3%(+3.29)#18 | 1.1%(+3.48)#921 |
| 19. | Sedley | 4.5% | 1.3%(+3.20)#19 | 1.1%(+3.39)#962 |
| 20. | Navy | 4.2% | 1.3%(+2.96)#20 | 1.1%(+3.15)#1,063 |
| 21. | Charlottesville | 4.2% | 1.3%(+2.88)#21 | 1.1%(+3.07)#1,095 |
| 22. | Clifton Forge | 4.1% | 1.3%(+2.87)#22 | 1.1%(+3.05)#1,102 |
| 23. | Mclean | 4.1% | 1.3%(+2.80)#23 | 1.1%(+2.99)#1,125 |
| 24. | Tysons | 4.0% | 1.3%(+2.76)#24 | 1.1%(+2.95)#1,139 |
| 25. | Bluefield | 3.9% | 1.3%(+2.67)#25 | 1.1%(+2.85)#1,198 |
| 26. | Dunn Loring | 3.9% | 1.3%(+2.61)#26 | 1.1%(+2.79)#1,232 |
| 27. | Pimmit Hills | 3.8% | 1.3%(+2.55)#27 | 1.1%(+2.74)#1,259 |
| 28. | Belle Haven | 3.8% | 1.3%(+2.51)#28 | 1.1%(+2.69)#1,281 |
| 29. | Lake Holiday | 3.7% | 1.3%(+2.47)#29 | 1.1%(+2.65)#1,297 |
| 30. | Wolf Trap | 3.6% | 1.3%(+2.36)#30 | 1.1%(+2.55)#1,378 |
| 31. | Lansdowne | 3.6% | 1.3%(+2.29)#31 | 1.1%(+2.48)#1,427 |
| 32. | Ridgeway | 3.6% | 1.3%(+2.29)#32 | 1.1%(+2.47)#1,433 |
| 33. | Fairfax | 3.5% | 1.3%(+2.26)#33 | 1.1%(+2.45)#1,446 |
| 34. | Arlington | 3.5% | 1.3%(+2.18)#34 | 1.1%(+2.37)#1,509 |
| 35. | Huntington | 3.4% | 1.3%(+2.14)#35 | 1.1%(+2.33)#1,535 |
| 36. | Merrifield | 3.3% | 1.3%(+2.03)#36 | 1.1%(+2.22)#1,608 |
| 37. | Mantua | 3.3% | 1.3%(+1.98)#37 | 1.1%(+2.17)#1,642 |
| 38. | Falls Church | 3.2% | 1.3%(+1.95)#38 | 1.1%(+2.13)#1,684 |
| 39. | Merrimac | 3.2% | 1.3%(+1.95)#39 | 1.1%(+2.13)#1,687 |
| 40. | St Paul | 3.2% | 1.3%(+1.90)#40 | 1.1%(+2.08)#1,714 |
| 41. | King George | 3.1% | 1.3%(+1.87)#41 | 1.1%(+2.05)#1,745 |
| 42. | Accomac | 3.1% | 1.3%(+1.81)#42 | 1.1%(+2.00)#1,808 |
| 43. | Shenandoah Farms | 3.0% | 1.3%(+1.71)#43 | 1.1%(+1.90)#1,895 |
| 44. | Hayfield | 2.9% | 1.3%(+1.65)#44 | 1.1%(+1.84)#1,936 |
| 45. | Virgilina | 2.9% | 1.3%(+1.62)#45 | 1.1%(+1.81)#1,970 |
| 46. | Burke | 2.8% | 1.3%(+1.55)#46 | 1.1%(+1.73)#2,040 |
| 47. | Difficult Run | 2.8% | 1.3%(+1.55)#47 | 1.1%(+1.73)#2,045 |
| 48. | Opal | 2.8% | 1.3%(+1.49)#48 | 1.1%(+1.68)#2,131 |
| 49. | Fort Belvoir | 2.7% | 1.3%(+1.45)#49 | 1.1%(+1.63)#2,195 |
| 50. | Hallwood | 2.7% | 1.3%(+1.43)#50 | 1.1%(+1.61)#2,224 |
| 51. | Rivanna | 2.7% | 1.3%(+1.41)#51 | 1.1%(+1.59)#2,237 |
| 52. | Rich Creek | 2.7% | 1.3%(+1.39)#52 | 1.1%(+1.58)#2,247 |
| 53. | Vienna | 2.7% | 1.3%(+1.38)#53 | 1.1%(+1.56)#2,273 |
| 54. | West Point | 2.6% | 1.3%(+1.36)#54 | 1.1%(+1.54)#2,302 |
| 55. | Aquia Harbour | 2.6% | 1.3%(+1.34)#55 | 1.1%(+1.53)#2,332 |
| 56. | Esmont | 2.6% | 1.3%(+1.31)#56 | 1.1%(+1.50)#2,373 |
| 57. | Fort Hunt | 2.5% | 1.3%(+1.27)#57 | 1.1%(+1.45)#2,446 |
| 58. | Fincastle | 2.5% | 1.3%(+1.25)#58 | 1.1%(+1.44)#2,472 |
| 59. | Toms Brook | 2.5% | 1.3%(+1.25)#59 | 1.1%(+1.43)#2,485 |
| 60. | Victoria | 2.5% | 1.3%(+1.24)#60 | 1.1%(+1.43)#2,493 |
| 61. | Bridgewater | 2.5% | 1.3%(+1.23)#61 | 1.1%(+1.41)#2,514 |
| 62. | Long Branch | 2.5% | 1.3%(+1.22)#62 | 1.1%(+1.41)#2,519 |
| 63. | Orange | 2.5% | 1.3%(+1.22)#63 | 1.1%(+1.41)#2,527 |
| 64. | Oakton | 2.5% | 1.3%(+1.20)#64 | 1.1%(+1.38)#2,559 |
| 65. | Altavista | 2.5% | 1.3%(+1.19)#65 | 1.1%(+1.38)#2,575 |
| 66. | Rose Hill Cdp Fairfax County | 2.4% | 1.3%(+1.15)#66 | 1.1%(+1.34)#2,633 |
| 67. | Fairfax Station | 2.4% | 1.3%(+1.13)#67 | 1.1%(+1.31)#2,675 |
| 68. | Radford | 2.4% | 1.3%(+1.12)#68 | 1.1%(+1.30)#2,691 |
| 69. | Leesylvania | 2.4% | 1.3%(+1.10)#69 | 1.1%(+1.29)#2,711 |
| 70. | Stephens City | 2.4% | 1.3%(+1.10)#70 | 1.1%(+1.29)#2,730 |
| 71. | Bloxom | 2.3% | 1.3%(+1.02)#71 | 1.1%(+1.21)#2,851 |
| 72. | Alexandria | 2.3% | 1.3%(+1.00)#72 | 1.1%(+1.19)#2,890 |
| 73. | Dahlgren | 2.3% | 1.3%(+0.990)#73 | 1.1%(+1.18)#2,910 |
| 74. | Cascades | 2.3% | 1.3%(+0.984)#74 | 1.1%(+1.17)#2,927 |
| 75. | Lorton | 2.2% | 1.3%(+0.961)#75 | 1.1%(+1.15)#2,970 |
| 76. | Broadlands | 2.2% | 1.3%(+0.950)#76 | 1.1%(+1.14)#2,987 |
| 77. | Idylwood | 2.2% | 1.3%(+0.944)#77 | 1.1%(+1.13)#3,004 |
| 78. | Wise | 2.2% | 1.3%(+0.933)#78 | 1.1%(+1.12)#3,022 |
| 79. | Rio | 2.2% | 1.3%(+0.917)#79 | 1.1%(+1.10)#3,047 |
| 80. | West Springfield | 2.2% | 1.3%(+0.903)#80 | 1.1%(+1.09)#3,075 |
| 81. | Dranesville | 2.2% | 1.3%(+0.896)#81 | 1.1%(+1.08)#3,096 |
| 82. | Lexington | 2.1% | 1.3%(+0.860)#82 | 1.1%(+1.05)#3,155 |
| 83. | Clinchco | 2.1% | 1.3%(+0.851)#83 | 1.1%(+1.04)#3,172 |
| 84. | Lake Monticello | 2.1% | 1.3%(+0.835)#84 | 1.1%(+1.02)#3,202 |
| 85. | Crosspointe | 2.1% | 1.3%(+0.815)#85 | 1.1%(+1.00)#3,242 |
| 86. | Kingstowne | 2.1% | 1.3%(+0.779)#86 | 1.1%(+0.965)#3,302 |
| 87. | Prince George | 2.0% | 1.3%(+0.743)#87 | 1.1%(+0.929)#3,386 |
| 88. | Franconia | 2.0% | 1.3%(+0.732)#88 | 1.1%(+0.918)#3,407 |
| 89. | Quantico Base | 2.0% | 1.3%(+0.720)#89 | 1.1%(+0.906)#3,432 |
| 90. | Weber City | 2.0% | 1.3%(+0.684)#90 | 1.1%(+0.870)#3,513 |
| 91. | Great Falls | 1.9% | 1.3%(+0.665)#91 | 1.1%(+0.851)#3,556 |
| 92. | Bon Air | 1.9% | 1.3%(+0.657)#92 | 1.1%(+0.843)#3,579 |
| 93. | Louisa | 1.9% | 1.3%(+0.646)#93 | 1.1%(+0.832)#3,596 |
| 94. | Fair Oaks | 1.9% | 1.3%(+0.641)#94 | 1.1%(+0.827)#3,613 |
| 95. | West Falls Church | 1.9% | 1.3%(+0.624)#95 | 1.1%(+0.810)#3,650 |
| 96. | Countryside | 1.9% | 1.3%(+0.619)#96 | 1.1%(+0.805)#3,665 |
| 97. | Colonial Beach | 1.9% | 1.3%(+0.608)#97 | 1.1%(+0.794)#3,705 |
| 98. | Woodburn | 1.9% | 1.3%(+0.600)#98 | 1.1%(+0.786)#3,729 |
| 99. | Strasburg | 1.9% | 1.3%(+0.587)#99 | 1.1%(+0.773)#3,759 |
| 100. | Surry | 1.8% | 1.3%(+0.558)#100 | 1.1%(+0.744)#3,834 |
Common Questions
What are the Top 10 Cities with the Highest Percentage of Population Employed in Life, Physical & Social Science in Virginia?
Top 10 Cities with the Highest Percentage of Population Employed in Life, Physical & Social Science in Virginia are:
#1
19.7%
#2
11.4%
#3
11.0%
#4
10.1%
#5
8.2%
#6
7.0%
#7
6.6%
#8
6.1%
#9
5.8%
#10
5.4%
What city has the Highest Percentage of Population Employed in Life, Physical & Social Science in Virginia?
Low Moor has the Highest Percentage of Population Employed in Life, Physical & Social Science in Virginia with 19.7%.
What is the Percentage of Population Employed in Life, Physical & Social Science in the State of Virginia?
Percentage of Population Employed in Life, Physical & Social Science in Virginia is 1.3%.
What is the Percentage of Population Employed in Life, Physical & Social Science in the United States?
Percentage of Population Employed in Life, Physical & Social Science in the United States is 1.1%.