Zip Codes with the Highest Percentage of Population Employed in Life, Physical & Social Science in Culver City, CA
RELATED REPORTS & OPTIONS
Life, Physical & Social Science
Culver City
Compare Zip Codes
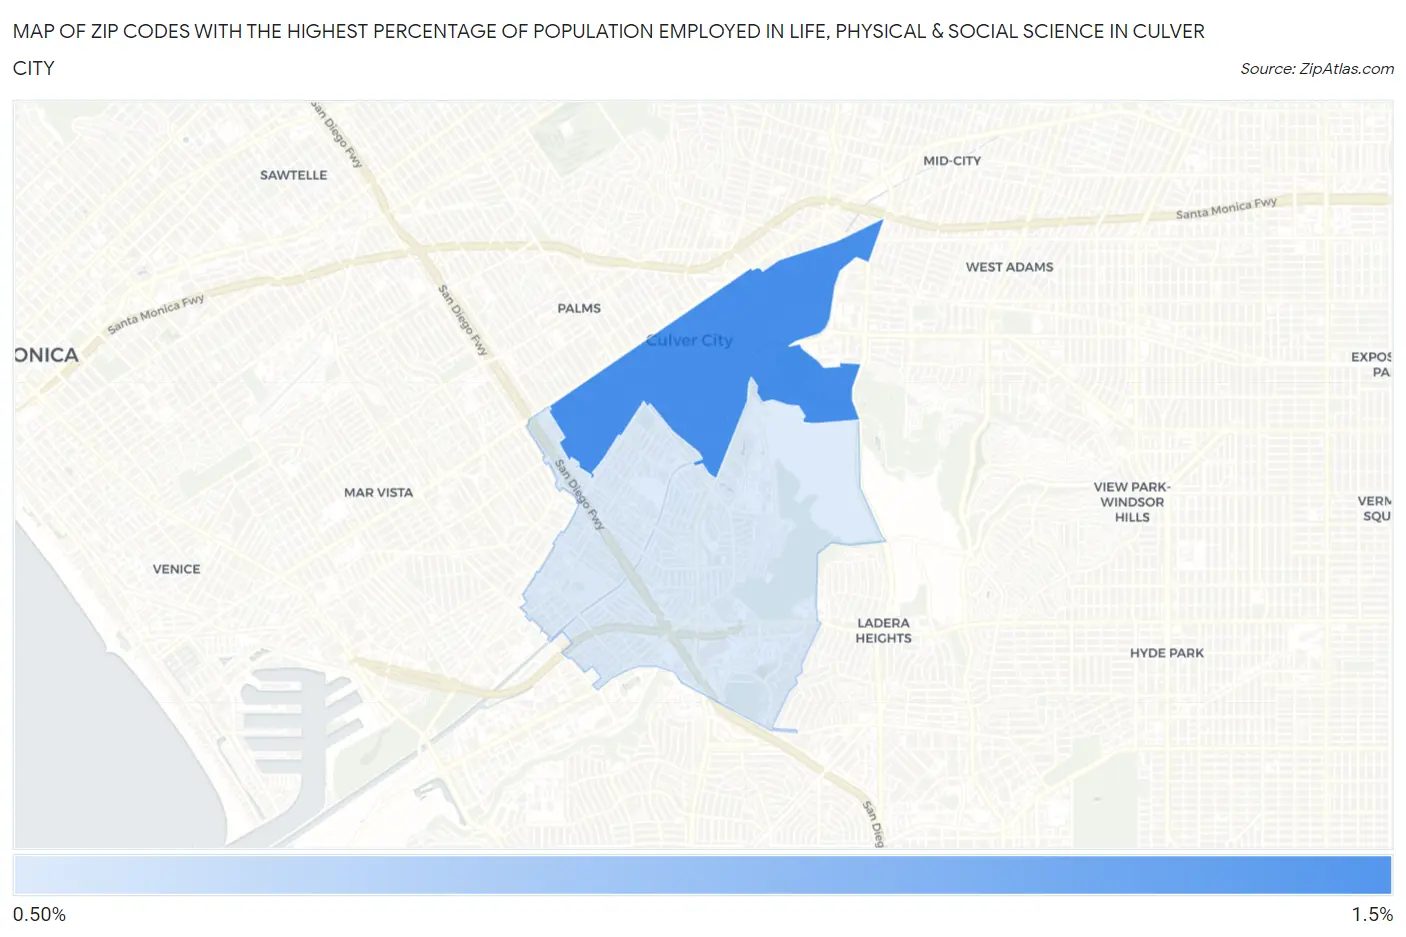
Map of Zip Codes with the Highest Percentage of Population Employed in Life, Physical & Social Science in Culver City
1.2%
1.4%
Zip Codes with the Highest Percentage of Population Employed in Life, Physical & Social Science in Culver City, CA
| Zip Code | % Employed | vs State | vs National | |
| 1. | 90232 | 1.4% | 1.3%(+0.065)#538 | 1.1%(+0.282)#6,339 |
| 2. | 90230 | 1.2% | 1.3%(-0.079)#599 | 1.1%(+0.138)#7,276 |
1
Common Questions
What are the Top Zip Codes with the Highest Percentage of Population Employed in Life, Physical & Social Science in Culver City, CA?
Top Zip Codes with the Highest Percentage of Population Employed in Life, Physical & Social Science in Culver City, CA are:
What zip code has the Highest Percentage of Population Employed in Life, Physical & Social Science in Culver City, CA?
90232 has the Highest Percentage of Population Employed in Life, Physical & Social Science in Culver City, CA with 1.4%.
What is the Percentage of Population Employed in Life, Physical & Social Science in Culver City, CA?
Percentage of Population Employed in Life, Physical & Social Science in Culver City is 1.2%.
What is the Percentage of Population Employed in Life, Physical & Social Science in California?
Percentage of Population Employed in Life, Physical & Social Science in California is 1.3%.
What is the Percentage of Population Employed in Life, Physical & Social Science in the United States?
Percentage of Population Employed in Life, Physical & Social Science in the United States is 1.1%.