States with the Highest Percentage of Population Employed in Life, Physical & Social Science
RELATED REPORTS & OPTIONS
Life, Physical & Social Science
United States
Compare States
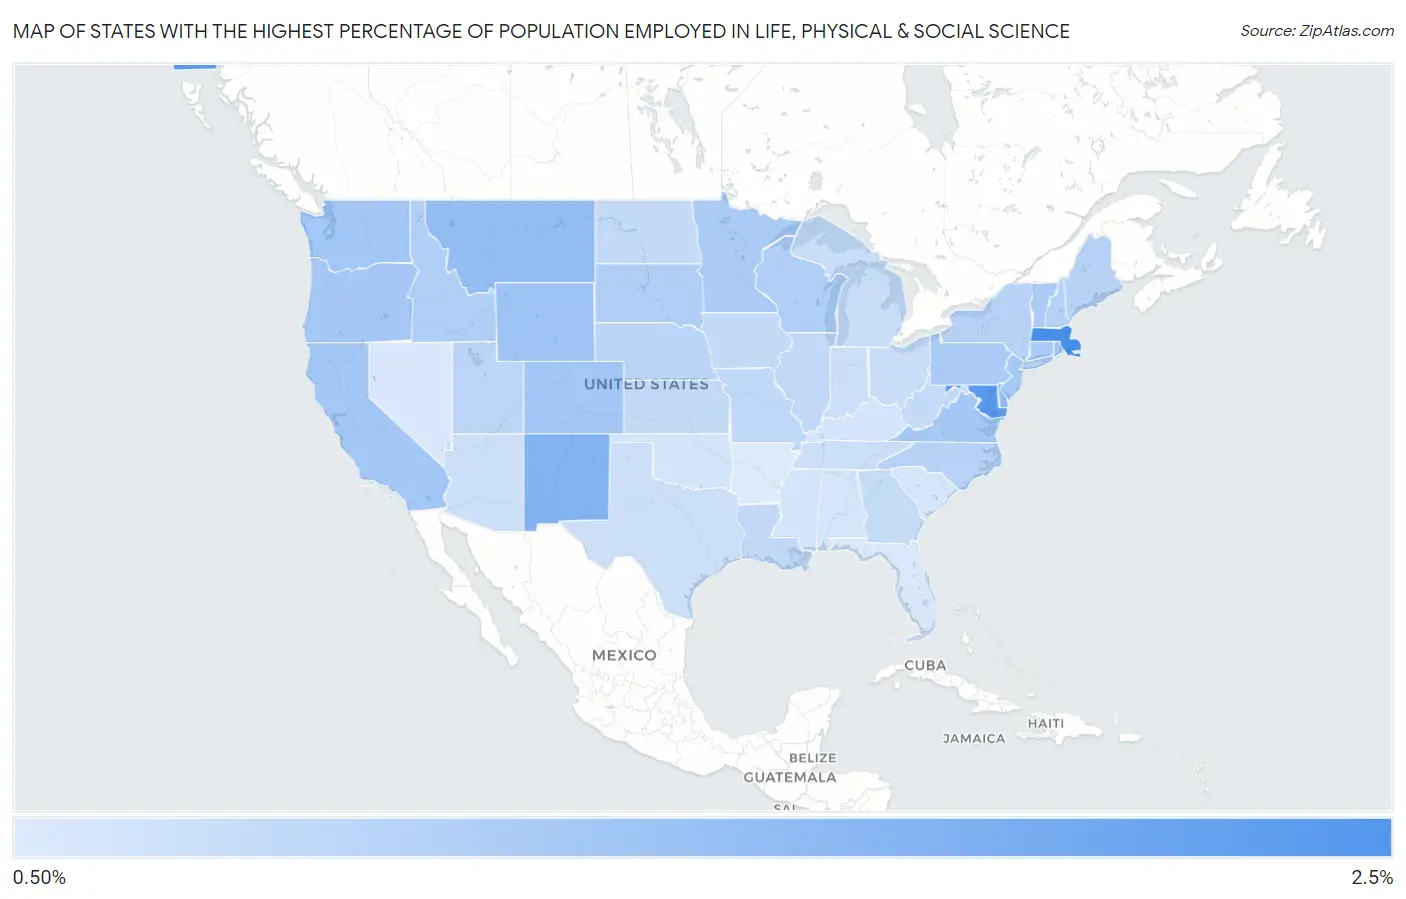
Map of States with the Highest Percentage of Population Employed in Life, Physical & Social Science
0.50%
2.5%
States with the Highest Percentage of Population Employed in Life, Physical & Social Science in the United States
| State | % Employed | vs State Median | vs National | |
| 1. | Massachusetts | 2.4% | 1.1% (+1.29) | 1.1%(+1.27) |
| 2. | Maryland | 2.2% | 1.1% (+1.08) | 1.1%(+1.06) |
| 3. | Alaska | 2.0% | 1.1% (+0.969) | 1.1%(+0.948) |
| 4. | New Mexico | 1.7% | 1.1% (+0.632) | 1.1%(+0.611) |
| 5. | Delaware | 1.5% | 1.1% (+0.476) | 1.1%(+0.455) |
| 6. | Montana | 1.5% | 1.1% (+0.410) | 1.1%(+0.389) |
| 7. | Wyoming | 1.4% | 1.1% (+0.289) | 1.1%(+0.268) |
| 8. | Colorado | 1.3% | 1.1% (+0.248) | 1.1%(+0.227) |
| 9. | Washington | 1.3% | 1.1% (+0.241) | 1.1%(+0.220) |
| 10. | California | 1.3% | 1.1% (+0.238) | 1.1%(+0.217) |
| 11. | Virginia | 1.3% | 1.1% (+0.207) | 1.1%(+0.186) |
| 12. | Oregon | 1.3% | 1.1% (+0.207) | 1.1%(+0.186) |
| 13. | Rhode Island | 1.3% | 1.1% (+0.200) | 1.1%(+0.179) |
| 14. | New Jersey | 1.3% | 1.1% (+0.185) | 1.1%(+0.164) |
| 15. | Connecticut | 1.2% | 1.1% (+0.172) | 1.1%(+0.151) |
| 16. | Minnesota | 1.2% | 1.1% (+0.165) | 1.1%(+0.145) |
| 17. | Pennsylvania | 1.2% | 1.1% (+0.152) | 1.1%(+0.132) |
| 18. | Vermont | 1.2% | 1.1% (+0.124) | 1.1%(+0.103) |
| 19. | South Dakota | 1.2% | 1.1% (+0.090) | 1.1%(+0.069) |
| 20. | Wisconsin | 1.2% | 1.1% (+0.089) | 1.1%(+0.068) |
| 21. | Idaho | 1.2% | 1.1% (+0.081) | 1.1%(+0.060) |
| 22. | New Hampshire | 1.1% | 1.1% (+0.066) | 1.1%(+0.045) |
| 23. | Hawaii | 1.1% | 1.1% (+0.046) | 1.1%(+0.026) |
| 24. | Maine | 1.1% | 1.1% (+0.011) | 1.1%(-0.010) |
| 25. | New York | 1.1% | 1.1% (+0.006) | 1.1%(-0.014) |
| 26. | North Carolina | 1.1% | 1.1% (-0.006) | 1.1%(-0.027) |
| 27. | Nebraska | 1.1% | 1.1% (-0.017) | 1.1%(-0.038) |
| 28. | Utah | 1.0% | 1.1% (-0.047) | 1.1%(-0.068) |
| 29. | Missouri | 0.98% | 1.1% (-0.088) | 1.1%(-0.109) |
| 30. | Illinois | 0.98% | 1.1% (-0.091) | 1.1%(-0.112) |
| 31. | Louisiana | 0.98% | 1.1% (-0.092) | 1.1%(-0.113) |
| 32. | West Virginia | 0.95% | 1.1% (-0.122) | 1.1%(-0.143) |
| 33. | Iowa | 0.95% | 1.1% (-0.125) | 1.1%(-0.146) |
| 34. | Kansas | 0.94% | 1.1% (-0.130) | 1.1%(-0.150) |
| 35. | North Dakota | 0.93% | 1.1% (-0.142) | 1.1%(-0.162) |
| 36. | Georgia | 0.91% | 1.1% (-0.157) | 1.1%(-0.178) |
| 37. | Ohio | 0.90% | 1.1% (-0.172) | 1.1%(-0.193) |
| 38. | Michigan | 0.88% | 1.1% (-0.186) | 1.1%(-0.207) |
| 39. | Texas | 0.84% | 1.1% (-0.227) | 1.1%(-0.248) |
| 40. | Arizona | 0.83% | 1.1% (-0.237) | 1.1%(-0.258) |
| 41. | Indiana | 0.83% | 1.1% (-0.239) | 1.1%(-0.260) |
| 42. | Tennessee | 0.83% | 1.1% (-0.239) | 1.1%(-0.260) |
| 43. | Kentucky | 0.77% | 1.1% (-0.303) | 1.1%(-0.324) |
| 44. | Mississippi | 0.76% | 1.1% (-0.305) | 1.1%(-0.326) |
| 45. | Oklahoma | 0.76% | 1.1% (-0.309) | 1.1%(-0.330) |
| 46. | Alabama | 0.74% | 1.1% (-0.328) | 1.1%(-0.349) |
| 47. | South Carolina | 0.73% | 1.1% (-0.344) | 1.1%(-0.365) |
| 48. | Nevada | 0.68% | 1.1% (-0.391) | 1.1%(-0.412) |
| 49. | Florida | 0.67% | 1.1% (-0.401) | 1.1%(-0.422) |
| 50. | Arkansas | 0.65% | 1.1% (-0.416) | 1.1%(-0.437) |
1
Common Questions
What are the Top 10 States with the Highest Percentage of Population Employed in Life, Physical & Social Science in the United States?
Top 10 States with the Highest Percentage of Population Employed in Life, Physical & Social Science in the United States are:
#1
2.4%
#2
2.2%
#3
2.0%
#4
1.7%
#5
1.5%
#6
1.5%
#7
1.4%
#8
1.3%
#9
1.3%
#10
1.3%
What state has the Highest Percentage of Population Employed in Life, Physical & Social Science in the United States?
Massachusetts has the Highest Percentage of Population Employed in Life, Physical & Social Science in the United States with 2.4%.
What is the Percentage of Population Employed in Life, Physical & Social Science in the United States?
Percentage of Population Employed in Life, Physical & Social Science in the United States is 1.1%.