Cities with the Highest Percentage of Population Employed in Life, Physical & Social Science in Michigan
RELATED REPORTS & OPTIONS
Life, Physical & Social Science
Michigan
Compare Cities
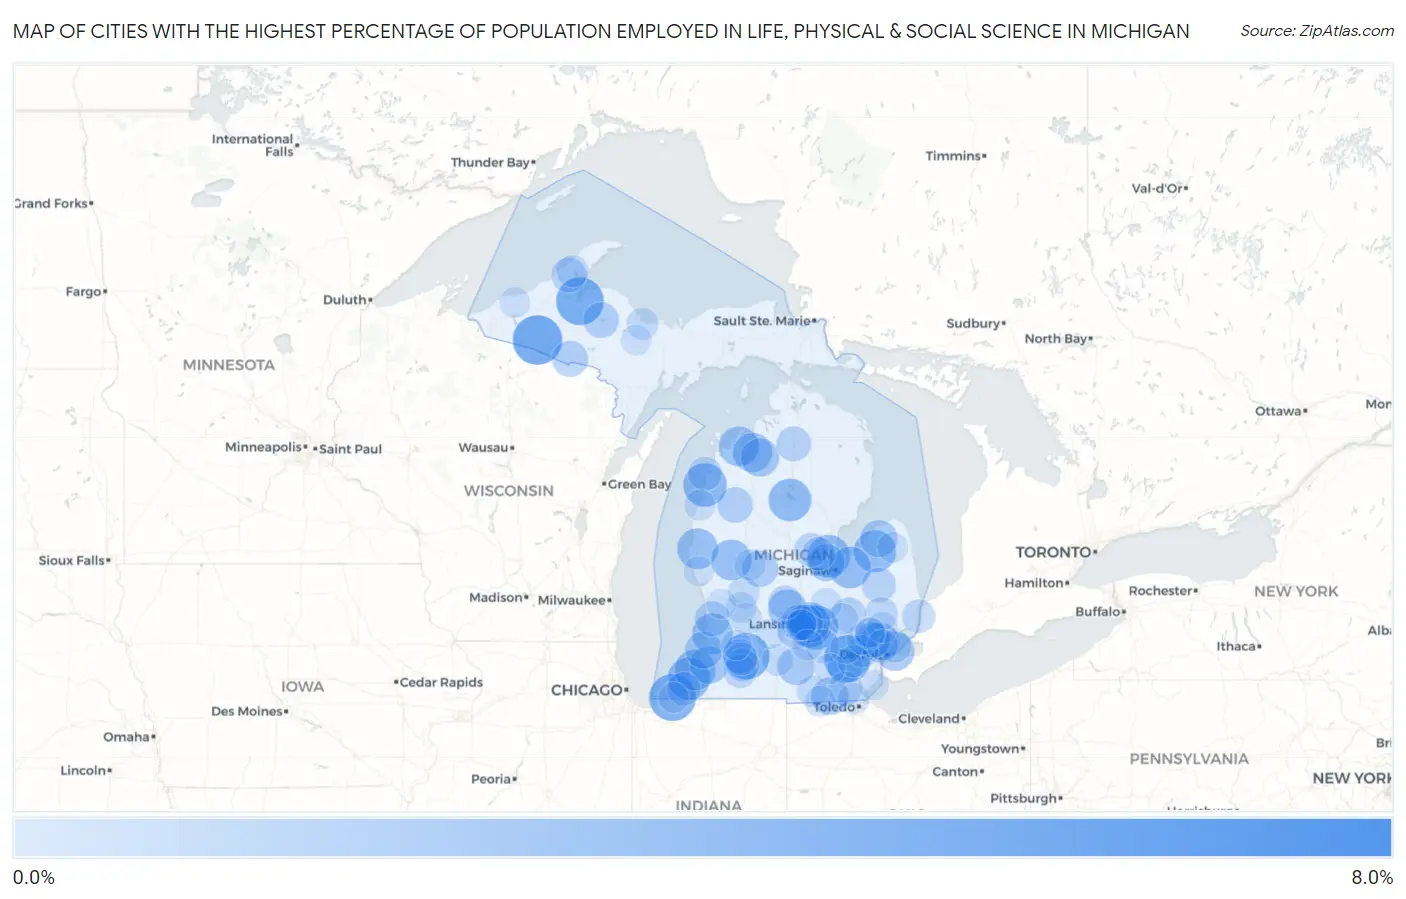
Map of Cities with the Highest Percentage of Population Employed in Life, Physical & Social Science in Michigan
0.0%
8.0%
Cities with the Highest Percentage of Population Employed in Life, Physical & Social Science in Michigan
| City | % Employed | vs State | vs National | |
| 1. | Skanee | 7.7% | 0.88%(+6.81)#1 | 1.1%(+6.60)#368 |
| 2. | Paris | 7.4% | 0.88%(+6.52)#2 | 1.1%(+6.32)#385 |
| 3. | Watersmeet | 5.9% | 0.88%(+5.00)#3 | 1.1%(+4.79)#600 |
| 4. | L Anse | 5.5% | 0.88%(+4.60)#4 | 1.1%(+4.39)#673 |
| 5. | Ann Arbor | 5.3% | 0.88%(+4.44)#5 | 1.1%(+4.23)#717 |
| 6. | Michiana | 5.3% | 0.88%(+4.41)#6 | 1.1%(+4.21)#723 |
| 7. | Comstock Northwest | 5.2% | 0.88%(+4.32)#7 | 1.1%(+4.12)#742 |
| 8. | Chassell | 5.2% | 0.88%(+4.32)#8 | 1.1%(+4.11)#743 |
| 9. | Williamston | 4.6% | 0.88%(+3.76)#9 | 1.1%(+3.55)#894 |
| 10. | Arcadia | 4.5% | 0.88%(+3.66)#10 | 1.1%(+3.45)#934 |
| 11. | Auburn | 4.4% | 0.88%(+3.49)#11 | 1.1%(+3.28)#1,007 |
| 12. | Okemos | 4.4% | 0.88%(+3.49)#12 | 1.1%(+3.28)#1,008 |
| 13. | Houghton Lake | 4.4% | 0.88%(+3.47)#13 | 1.1%(+3.27)#1,015 |
| 14. | Stevensville | 4.3% | 0.88%(+3.42)#14 | 1.1%(+3.21)#1,036 |
| 15. | Gagetown | 4.2% | 0.88%(+3.32)#15 | 1.1%(+3.11)#1,080 |
| 16. | Reese | 4.2% | 0.88%(+3.27)#16 | 1.1%(+3.06)#1,097 |
| 17. | Benton Heights | 3.9% | 0.88%(+3.06)#17 | 1.1%(+2.85)#1,200 |
| 18. | Hart | 3.9% | 0.88%(+3.05)#18 | 1.1%(+2.84)#1,207 |
| 19. | White Cloud | 3.9% | 0.88%(+3.04)#19 | 1.1%(+2.83)#1,212 |
| 20. | Fennville | 3.9% | 0.88%(+3.03)#20 | 1.1%(+2.82)#1,216 |
| 21. | Bruce Crossing | 3.8% | 0.88%(+2.96)#21 | 1.1%(+2.76)#1,247 |
| 22. | Haslett | 3.8% | 0.88%(+2.89)#22 | 1.1%(+2.69)#1,283 |
| 23. | Suttons Bay | 3.7% | 0.88%(+2.79)#23 | 1.1%(+2.58)#1,358 |
| 24. | Huntington Woods | 3.7% | 0.88%(+2.77)#24 | 1.1%(+2.56)#1,364 |
| 25. | Ruby | 3.6% | 0.88%(+2.75)#25 | 1.1%(+2.54)#1,389 |
| 26. | Elk Rapids | 3.6% | 0.88%(+2.74)#26 | 1.1%(+2.54)#1,390 |
| 27. | Grosse Pointe | 3.5% | 0.88%(+2.63)#27 | 1.1%(+2.42)#1,473 |
| 28. | Westphalia | 3.5% | 0.88%(+2.61)#28 | 1.1%(+2.40)#1,487 |
| 29. | Rapid City | 3.4% | 0.88%(+2.51)#29 | 1.1%(+2.30)#1,551 |
| 30. | Eureka | 3.3% | 0.88%(+2.39)#30 | 1.1%(+2.19)#1,632 |
| 31. | Hartford | 3.3% | 0.88%(+2.38)#31 | 1.1%(+2.17)#1,640 |
| 32. | Dimondale | 3.3% | 0.88%(+2.37)#32 | 1.1%(+2.17)#1,650 |
| 33. | Concord | 3.2% | 0.88%(+2.34)#33 | 1.1%(+2.13)#1,675 |
| 34. | Jasper | 3.2% | 0.88%(+2.32)#34 | 1.1%(+2.12)#1,692 |
| 35. | South Haven | 3.2% | 0.88%(+2.27)#35 | 1.1%(+2.06)#1,734 |
| 36. | Freeland | 3.1% | 0.88%(+2.25)#36 | 1.1%(+2.04)#1,760 |
| 37. | Elkton | 3.1% | 0.88%(+2.24)#37 | 1.1%(+2.03)#1,764 |
| 38. | Lakeview | 3.0% | 0.88%(+2.11)#38 | 1.1%(+1.90)#1,890 |
| 39. | Gaastra | 2.9% | 0.88%(+2.00)#39 | 1.1%(+1.79)#1,983 |
| 40. | Edgemont Park | 2.8% | 0.88%(+1.94)#40 | 1.1%(+1.74)#2,038 |
| 41. | Michigamme | 2.8% | 0.88%(+1.93)#41 | 1.1%(+1.73)#2,058 |
| 42. | East Lansing | 2.8% | 0.88%(+1.91)#42 | 1.1%(+1.70)#2,095 |
| 43. | Caberfae | 2.8% | 0.88%(+1.89)#43 | 1.1%(+1.69)#2,123 |
| 44. | Beechwood | 2.7% | 0.88%(+1.82)#44 | 1.1%(+1.61)#2,226 |
| 45. | Bingham Farms | 2.7% | 0.88%(+1.80)#45 | 1.1%(+1.60)#2,235 |
| 46. | Franklin | 2.7% | 0.88%(+1.77)#46 | 1.1%(+1.56)#2,279 |
| 47. | Saline | 2.6% | 0.88%(+1.74)#47 | 1.1%(+1.53)#2,323 |
| 48. | South Range | 2.6% | 0.88%(+1.72)#48 | 1.1%(+1.52)#2,346 |
| 49. | Gaylord | 2.6% | 0.88%(+1.72)#49 | 1.1%(+1.51)#2,354 |
| 50. | Lake Fenton | 2.6% | 0.88%(+1.72)#50 | 1.1%(+1.51)#2,356 |
| 51. | North Branch | 2.5% | 0.88%(+1.62)#51 | 1.1%(+1.41)#2,521 |
| 52. | Westwood | 2.5% | 0.88%(+1.58)#52 | 1.1%(+1.37)#2,584 |
| 53. | Deerfield | 2.5% | 0.88%(+1.57)#53 | 1.1%(+1.36)#2,599 |
| 54. | Sanford | 2.4% | 0.88%(+1.54)#54 | 1.1%(+1.33)#2,642 |
| 55. | Pewamo | 2.4% | 0.88%(+1.50)#55 | 1.1%(+1.29)#2,716 |
| 56. | Frankfort | 2.4% | 0.88%(+1.48)#56 | 1.1%(+1.27)#2,750 |
| 57. | Shorewood Tower Hills Harbert | 2.4% | 0.88%(+1.47)#57 | 1.1%(+1.27)#2,766 |
| 58. | Schoolcraft | 2.3% | 0.88%(+1.44)#58 | 1.1%(+1.24)#2,809 |
| 59. | St Clair | 2.3% | 0.88%(+1.41)#59 | 1.1%(+1.21)#2,854 |
| 60. | Midland | 2.3% | 0.88%(+1.41)#60 | 1.1%(+1.20)#2,860 |
| 61. | Stockbridge | 2.3% | 0.88%(+1.40)#61 | 1.1%(+1.19)#2,880 |
| 62. | Portage | 2.3% | 0.88%(+1.37)#62 | 1.1%(+1.16)#2,939 |
| 63. | Leonard | 2.2% | 0.88%(+1.32)#63 | 1.1%(+1.11)#3,027 |
| 64. | Kalamazoo | 2.2% | 0.88%(+1.27)#64 | 1.1%(+1.07)#3,121 |
| 65. | Plymouth | 2.1% | 0.88%(+1.20)#65 | 1.1%(+0.991)#3,262 |
| 66. | Houghton | 2.1% | 0.88%(+1.19)#66 | 1.1%(+0.979)#3,279 |
| 67. | Grosse Pointe Woods | 2.1% | 0.88%(+1.18)#67 | 1.1%(+0.977)#3,282 |
| 68. | Covington | 2.0% | 0.88%(+1.16)#68 | 1.1%(+0.950)#3,349 |
| 69. | Ypsilanti | 2.0% | 0.88%(+1.12)#69 | 1.1%(+0.914)#3,414 |
| 70. | Whitmore Lake | 2.0% | 0.88%(+1.12)#70 | 1.1%(+0.914)#3,415 |
| 71. | Rockford | 2.0% | 0.88%(+1.10)#71 | 1.1%(+0.891)#3,465 |
| 72. | Walled Lake | 2.0% | 0.88%(+1.10)#72 | 1.1%(+0.890)#3,467 |
| 73. | Harvey | 2.0% | 0.88%(+1.07)#73 | 1.1%(+0.868)#3,524 |
| 74. | Caledonia | 1.9% | 0.88%(+1.05)#74 | 1.1%(+0.843)#3,580 |
| 75. | Marshall | 1.9% | 0.88%(+1.01)#75 | 1.1%(+0.802)#3,678 |
| 76. | Hudson | 1.9% | 0.88%(+0.996)#76 | 1.1%(+0.789)#3,718 |
| 77. | East Grand Rapids | 1.9% | 0.88%(+0.989)#77 | 1.1%(+0.783)#3,738 |
| 78. | Argentine | 1.9% | 0.88%(+0.975)#78 | 1.1%(+0.768)#3,768 |
| 79. | Corunna | 1.9% | 0.88%(+0.968)#79 | 1.1%(+0.761)#3,788 |
| 80. | Morley | 1.9% | 0.88%(+0.968)#80 | 1.1%(+0.761)#3,790 |
| 81. | Keego Harbor | 1.8% | 0.88%(+0.958)#81 | 1.1%(+0.751)#3,821 |
| 82. | Lambertville | 1.8% | 0.88%(+0.946)#82 | 1.1%(+0.739)#3,845 |
| 83. | Morenci | 1.8% | 0.88%(+0.907)#83 | 1.1%(+0.700)#3,941 |
| 84. | Rochester | 1.8% | 0.88%(+0.907)#84 | 1.1%(+0.700)#3,942 |
| 85. | Manistee | 1.8% | 0.88%(+0.897)#85 | 1.1%(+0.691)#3,976 |
| 86. | Lake Leann | 1.8% | 0.88%(+0.895)#86 | 1.1%(+0.688)#3,981 |
| 87. | Ferndale | 1.8% | 0.88%(+0.888)#87 | 1.1%(+0.681)#4,007 |
| 88. | Leslie | 1.8% | 0.88%(+0.867)#88 | 1.1%(+0.660)#4,068 |
| 89. | Gwinn | 1.7% | 0.88%(+0.844)#89 | 1.1%(+0.637)#4,125 |
| 90. | Lansing | 1.7% | 0.88%(+0.840)#90 | 1.1%(+0.633)#4,151 |
| 91. | Ubly | 1.7% | 0.88%(+0.830)#91 | 1.1%(+0.623)#4,180 |
| 92. | White Pine | 1.7% | 0.88%(+0.811)#92 | 1.1%(+0.604)#4,234 |
| 93. | Grand Beach | 1.7% | 0.88%(+0.797)#93 | 1.1%(+0.590)#4,278 |
| 94. | Otsego | 1.7% | 0.88%(+0.783)#94 | 1.1%(+0.576)#4,304 |
| 95. | Manchester | 1.7% | 0.88%(+0.781)#95 | 1.1%(+0.574)#4,312 |
| 96. | Nashville | 1.6% | 0.88%(+0.712)#96 | 1.1%(+0.506)#4,502 |
| 97. | Sylvan Lake | 1.6% | 0.88%(+0.705)#97 | 1.1%(+0.498)#4,527 |
| 98. | Montague | 1.6% | 0.88%(+0.703)#98 | 1.1%(+0.496)#4,530 |
| 99. | Allendale | 1.6% | 0.88%(+0.700)#99 | 1.1%(+0.493)#4,545 |
| 100. | Stony Point | 1.6% | 0.88%(+0.697)#100 | 1.1%(+0.490)#4,557 |
Common Questions
What are the Top 10 Cities with the Highest Percentage of Population Employed in Life, Physical & Social Science in Michigan?
Top 10 Cities with the Highest Percentage of Population Employed in Life, Physical & Social Science in Michigan are:
#1
5.9%
#2
5.5%
#3
5.3%
#4
5.3%
#5
5.2%
#6
4.6%
#7
4.5%
#8
4.4%
#9
4.4%
#10
4.4%
What city has the Highest Percentage of Population Employed in Life, Physical & Social Science in Michigan?
Watersmeet has the Highest Percentage of Population Employed in Life, Physical & Social Science in Michigan with 5.9%.
What is the Percentage of Population Employed in Life, Physical & Social Science in the State of Michigan?
Percentage of Population Employed in Life, Physical & Social Science in Michigan is 0.88%.
What is the Percentage of Population Employed in Life, Physical & Social Science in the United States?
Percentage of Population Employed in Life, Physical & Social Science in the United States is 1.1%.