Cities with the Highest Percentage of Population Employed in Life, Physical & Social Science in Oklahoma
RELATED REPORTS & OPTIONS
Life, Physical & Social Science
Oklahoma
Compare Cities
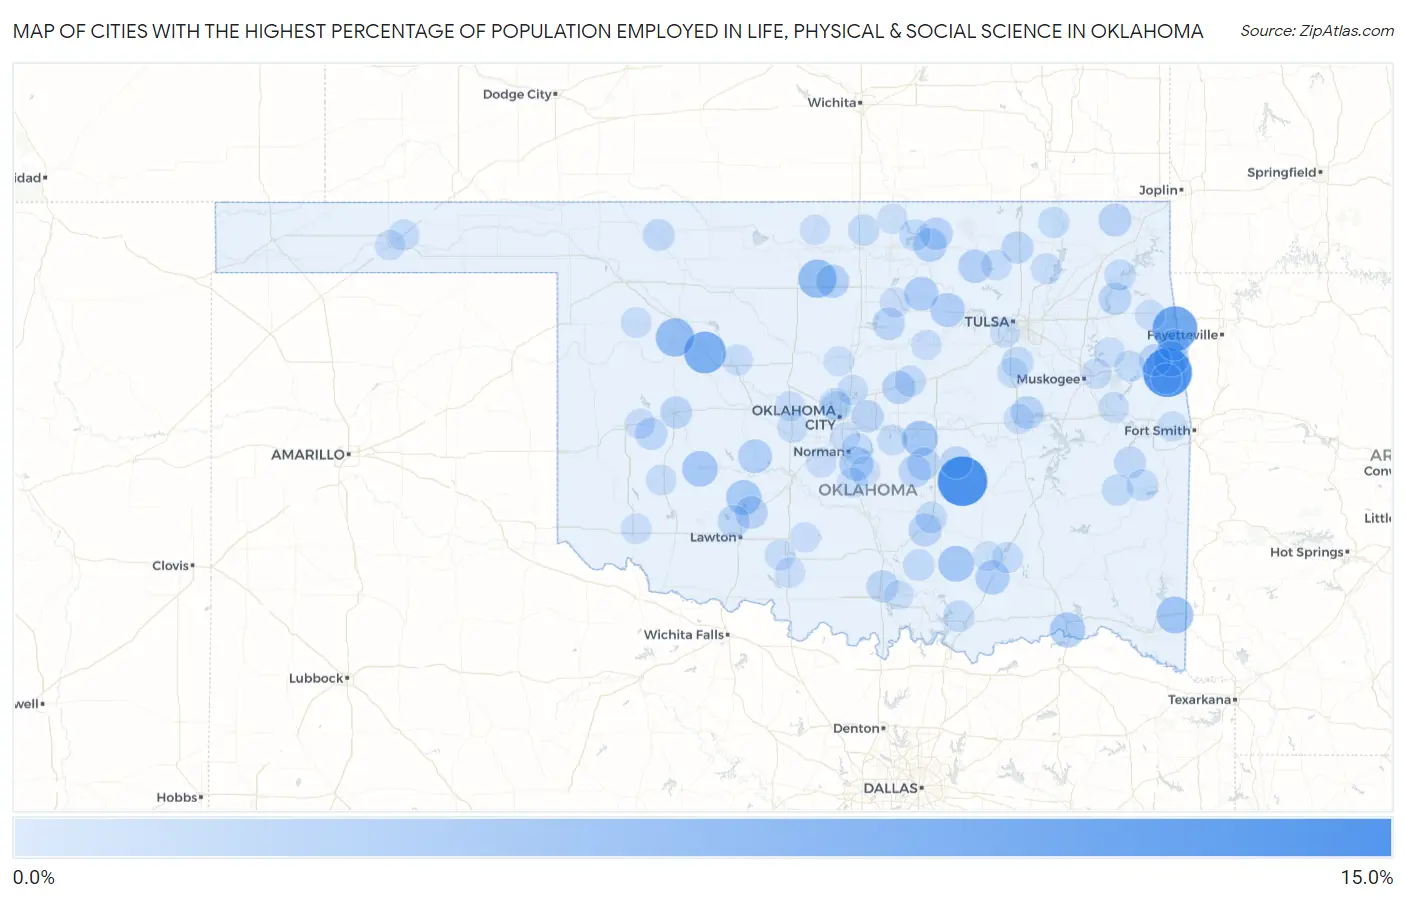
Map of Cities with the Highest Percentage of Population Employed in Life, Physical & Social Science in Oklahoma
0.0%
15.0%
Cities with the Highest Percentage of Population Employed in Life, Physical & Social Science in Oklahoma
| City | % Employed | vs State | vs National | |
| 1. | Spaulding | 13.7% | 0.76%(+13.0)#1 | 1.1%(+12.6)#145 |
| 2. | Zion | 13.3% | 0.76%(+12.6)#2 | 1.1%(+12.2)#151 |
| 3. | Hochatown | 12.7% | 0.76%(+12.0)#3 | 1.1%(+11.7)#165 |
| 4. | Watts | 10.5% | 0.76%(+9.77)#4 | 1.1%(+9.44)#213 |
| 5. | Greenville | 9.6% | 0.76%(+8.85)#5 | 1.1%(+8.52)#251 |
| 6. | Oakwood | 8.6% | 0.76%(+7.81)#6 | 1.1%(+7.48)#305 |
| 7. | Taloga | 6.3% | 0.76%(+5.59)#7 | 1.1%(+5.26)#523 |
| 8. | Breckenridge | 6.2% | 0.76%(+5.49)#8 | 1.1%(+5.16)#544 |
| 9. | Eagletown | 5.3% | 0.76%(+4.56)#9 | 1.1%(+4.23)#715 |
| 10. | Keefton | 5.1% | 0.76%(+4.38)#10 | 1.1%(+4.05)#758 |
| 11. | Earlsboro | 4.7% | 0.76%(+3.93)#11 | 1.1%(+3.60)#879 |
| 12. | Bromide | 4.7% | 0.76%(+3.89)#12 | 1.1%(+3.56)#892 |
| 13. | Mountain View | 4.5% | 0.76%(+3.74)#13 | 1.1%(+3.41)#952 |
| 14. | Peavine | 4.4% | 0.76%(+3.62)#14 | 1.1%(+3.29)#1,004 |
| 15. | Briartown | 4.3% | 0.76%(+3.59)#15 | 1.1%(+3.26)#1,023 |
| 16. | Grant | 4.2% | 0.76%(+3.45)#16 | 1.1%(+3.12)#1,075 |
| 17. | Apache | 4.2% | 0.76%(+3.44)#17 | 1.1%(+3.10)#1,081 |
| 18. | Hallett | 3.6% | 0.76%(+2.81)#18 | 1.1%(+2.48)#1,425 |
| 19. | Noble | 3.5% | 0.76%(+2.78)#19 | 1.1%(+2.45)#1,448 |
| 20. | Pawnee | 3.5% | 0.76%(+2.76)#20 | 1.1%(+2.43)#1,466 |
| 21. | Tushka | 3.5% | 0.76%(+2.75)#21 | 1.1%(+2.42)#1,475 |
| 22. | Gracemont | 3.4% | 0.76%(+2.66)#22 | 1.1%(+2.33)#1,537 |
| 23. | Burbank | 3.3% | 0.76%(+2.57)#23 | 1.1%(+2.24)#1,589 |
| 24. | Wynona | 3.1% | 0.76%(+2.34)#24 | 1.1%(+2.01)#1,796 |
| 25. | Garber | 3.1% | 0.76%(+2.32)#25 | 1.1%(+1.99)#1,816 |
| 26. | Warwick | 2.9% | 0.76%(+2.14)#26 | 1.1%(+1.81)#1,969 |
| 27. | Welch | 2.8% | 0.76%(+2.03)#27 | 1.1%(+1.70)#2,097 |
| 28. | Fitzhugh | 2.8% | 0.76%(+2.02)#28 | 1.1%(+1.69)#2,119 |
| 29. | Grayson | 2.8% | 0.76%(+2.02)#29 | 1.1%(+1.69)#2,121 |
| 30. | Elgin | 2.7% | 0.76%(+1.90)#30 | 1.1%(+1.57)#2,271 |
| 31. | Shidler | 2.6% | 0.76%(+1.88)#31 | 1.1%(+1.55)#2,292 |
| 32. | Maud | 2.6% | 0.76%(+1.88)#32 | 1.1%(+1.55)#2,296 |
| 33. | Barber | 2.6% | 0.76%(+1.82)#33 | 1.1%(+1.49)#2,384 |
| 34. | Wickliffe | 2.6% | 0.76%(+1.81)#34 | 1.1%(+1.48)#2,400 |
| 35. | St Louis | 2.6% | 0.76%(+1.80)#35 | 1.1%(+1.47)#2,413 |
| 36. | Titanic | 2.5% | 0.76%(+1.74)#36 | 1.1%(+1.41)#2,522 |
| 37. | Stillwater | 2.5% | 0.76%(+1.72)#37 | 1.1%(+1.39)#2,543 |
| 38. | Wewoka | 2.4% | 0.76%(+1.69)#38 | 1.1%(+1.36)#2,605 |
| 39. | Medicine Park | 2.4% | 0.76%(+1.65)#39 | 1.1%(+1.32)#2,666 |
| 40. | Choctaw | 2.4% | 0.76%(+1.63)#40 | 1.1%(+1.30)#2,699 |
| 41. | Burns Flat | 2.4% | 0.76%(+1.61)#41 | 1.1%(+1.28)#2,748 |
| 42. | Bartlesville | 2.3% | 0.76%(+1.52)#42 | 1.1%(+1.19)#2,883 |
| 43. | Clinton | 2.3% | 0.76%(+1.50)#43 | 1.1%(+1.17)#2,918 |
| 44. | Ardmore | 2.2% | 0.76%(+1.48)#44 | 1.1%(+1.15)#2,960 |
| 45. | Mccurtain | 2.2% | 0.76%(+1.41)#45 | 1.1%(+1.08)#3,087 |
| 46. | Freedom | 2.1% | 0.76%(+1.37)#46 | 1.1%(+1.04)#3,176 |
| 47. | Fanshawe | 2.0% | 0.76%(+1.22)#47 | 1.1%(+0.889)#3,470 |
| 48. | Kaw City | 2.0% | 0.76%(+1.22)#48 | 1.1%(+0.889)#3,471 |
| 49. | Mill Creek | 2.0% | 0.76%(+1.22)#49 | 1.1%(+0.889)#3,472 |
| 50. | Latta | 2.0% | 0.76%(+1.20)#50 | 1.1%(+0.866)#3,531 |
| 51. | Liberty | 1.9% | 0.76%(+1.14)#51 | 1.1%(+0.814)#3,640 |
| 52. | Chandler | 1.9% | 0.76%(+1.12)#52 | 1.1%(+0.788)#3,720 |
| 53. | Silo | 1.8% | 0.76%(+1.08)#53 | 1.1%(+0.750)#3,824 |
| 54. | Red Oak | 1.8% | 0.76%(+1.07)#54 | 1.1%(+0.738)#3,849 |
| 55. | Blackwell | 1.8% | 0.76%(+1.06)#55 | 1.1%(+0.731)#3,867 |
| 56. | Westville | 1.8% | 0.76%(+1.02)#56 | 1.1%(+0.685)#3,991 |
| 57. | The Village | 1.8% | 0.76%(+1.00)#57 | 1.1%(+0.674)#4,027 |
| 58. | Lenapah | 1.7% | 0.76%(+0.963)#58 | 1.1%(+0.633)#4,144 |
| 59. | Park Hill | 1.7% | 0.76%(+0.945)#59 | 1.1%(+0.615)#4,198 |
| 60. | Norwood | 1.7% | 0.76%(+0.934)#60 | 1.1%(+0.604)#4,228 |
| 61. | Optima | 1.7% | 0.76%(+0.934)#61 | 1.1%(+0.604)#4,237 |
| 62. | Langley | 1.7% | 0.76%(+0.928)#62 | 1.1%(+0.598)#4,250 |
| 63. | Stringtown | 1.7% | 0.76%(+0.925)#63 | 1.1%(+0.594)#4,258 |
| 64. | Norman | 1.6% | 0.76%(+0.825)#64 | 1.1%(+0.495)#4,541 |
| 65. | Watonga | 1.5% | 0.76%(+0.767)#65 | 1.1%(+0.437)#4,741 |
| 66. | Union City | 1.5% | 0.76%(+0.737)#66 | 1.1%(+0.407)#4,845 |
| 67. | Gore | 1.5% | 0.76%(+0.736)#67 | 1.1%(+0.406)#4,856 |
| 68. | Talala | 1.5% | 0.76%(+0.732)#68 | 1.1%(+0.402)#4,885 |
| 69. | Winchester | 1.5% | 0.76%(+0.710)#69 | 1.1%(+0.380)#4,974 |
| 70. | Barnsdall | 1.5% | 0.76%(+0.706)#70 | 1.1%(+0.376)#4,982 |
| 71. | Vici | 1.5% | 0.76%(+0.699)#71 | 1.1%(+0.369)#5,014 |
| 72. | Hobart | 1.5% | 0.76%(+0.695)#72 | 1.1%(+0.365)#5,034 |
| 73. | Cherry Tree | 1.4% | 0.76%(+0.689)#73 | 1.1%(+0.358)#5,058 |
| 74. | Empire City | 1.4% | 0.76%(+0.680)#74 | 1.1%(+0.350)#5,090 |
| 75. | Bethel Acres | 1.4% | 0.76%(+0.662)#75 | 1.1%(+0.332)#5,179 |
| 76. | Edmond | 1.4% | 0.76%(+0.604)#76 | 1.1%(+0.274)#5,370 |
| 77. | Blanchard | 1.4% | 0.76%(+0.597)#77 | 1.1%(+0.267)#5,407 |
| 78. | Comanche | 1.3% | 0.76%(+0.588)#78 | 1.1%(+0.257)#5,456 |
| 79. | Kansas | 1.3% | 0.76%(+0.587)#79 | 1.1%(+0.257)#5,459 |
| 80. | Altus | 1.3% | 0.76%(+0.580)#80 | 1.1%(+0.249)#5,483 |
| 81. | Guymon | 1.3% | 0.76%(+0.560)#81 | 1.1%(+0.229)#5,579 |
| 82. | Cushing | 1.3% | 0.76%(+0.543)#82 | 1.1%(+0.213)#5,656 |
| 83. | Fort Gibson | 1.3% | 0.76%(+0.537)#83 | 1.1%(+0.206)#5,690 |
| 84. | Canute | 1.3% | 0.76%(+0.532)#84 | 1.1%(+0.202)#5,710 |
| 85. | Nichols Hills | 1.3% | 0.76%(+0.516)#85 | 1.1%(+0.185)#5,785 |
| 86. | Morrison | 1.3% | 0.76%(+0.508)#86 | 1.1%(+0.178)#5,820 |
| 87. | Purcell | 1.2% | 0.76%(+0.485)#87 | 1.1%(+0.155)#5,916 |
| 88. | Dewar | 1.2% | 0.76%(+0.484)#88 | 1.1%(+0.154)#5,921 |
| 89. | Bray | 1.2% | 0.76%(+0.464)#89 | 1.1%(+0.134)#6,012 |
| 90. | Medford | 1.2% | 0.76%(+0.430)#90 | 1.1%(+0.100)#6,177 |
| 91. | El Reno | 1.2% | 0.76%(+0.405)#91 | 1.1%(+0.075)#6,295 |
| 92. | Muldrow | 1.2% | 0.76%(+0.399)#92 | 1.1%(+0.069)#6,326 |
| 93. | Oakhurst | 1.2% | 0.76%(+0.396)#93 | 1.1%(+0.066)#6,335 |
| 94. | Newkirk | 1.2% | 0.76%(+0.390)#94 | 1.1%(+0.060)#6,358 |
| 95. | Lehigh | 1.1% | 0.76%(+0.363)#95 | 1.1%(+0.033)#6,495 |
| 96. | Moore | 1.1% | 0.76%(+0.360)#96 | 1.1%(+0.030)#6,508 |
| 97. | Cedar Valley | 1.1% | 0.76%(+0.344)#97 | 1.1%(+0.014)#6,606 |
| 98. | Hulbert | 1.1% | 0.76%(+0.326)#98 | 1.1%(-0.004)#6,716 |
| 99. | Dickson | 1.1% | 0.76%(+0.298)#99 | 1.1%(-0.032)#6,848 |
| 100. | Slaughterville | 1.0% | 0.76%(+0.286)#100 | 1.1%(-0.044)#6,905 |
Common Questions
What are the Top 10 Cities with the Highest Percentage of Population Employed in Life, Physical & Social Science in Oklahoma?
Top 10 Cities with the Highest Percentage of Population Employed in Life, Physical & Social Science in Oklahoma are:
#1
13.7%
#2
13.3%
#3
10.5%
#4
8.6%
#5
6.3%
#6
6.2%
#7
5.3%
#8
4.7%
#9
4.7%
#10
4.5%
What city has the Highest Percentage of Population Employed in Life, Physical & Social Science in Oklahoma?
Spaulding has the Highest Percentage of Population Employed in Life, Physical & Social Science in Oklahoma with 13.7%.
What is the Percentage of Population Employed in Life, Physical & Social Science in the State of Oklahoma?
Percentage of Population Employed in Life, Physical & Social Science in Oklahoma is 0.76%.
What is the Percentage of Population Employed in Life, Physical & Social Science in the United States?
Percentage of Population Employed in Life, Physical & Social Science in the United States is 1.1%.