Cities with the Highest Percentage of Population Employed in Life, Physical & Social Science in Missouri
RELATED REPORTS & OPTIONS
Life, Physical & Social Science
Missouri
Compare Cities
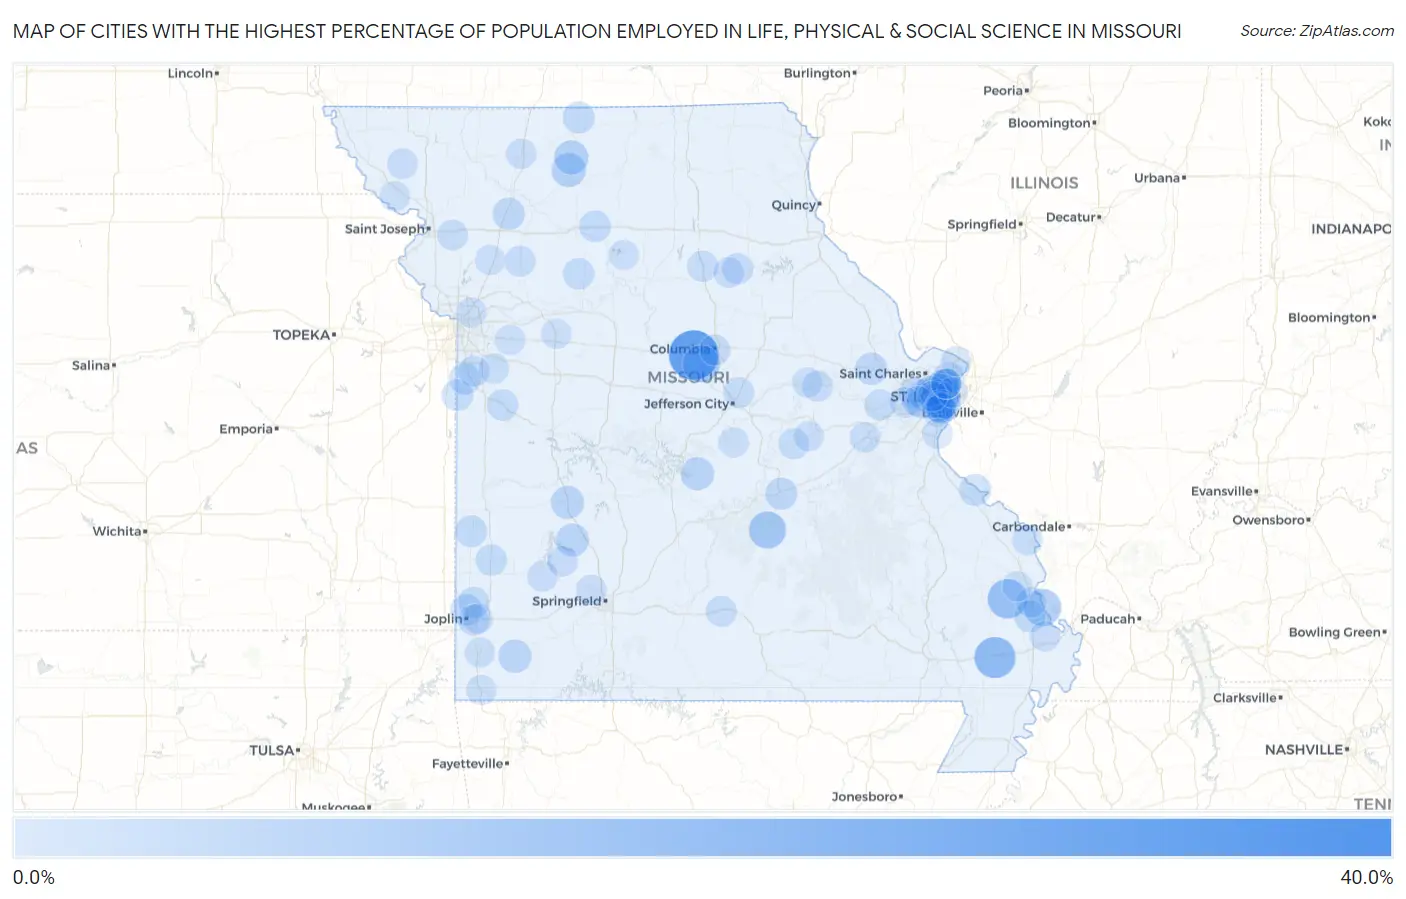
Map of Cities with the Highest Percentage of Population Employed in Life, Physical & Social Science in Missouri
0.0%
40.0%
Cities with the Highest Percentage of Population Employed in Life, Physical & Social Science in Missouri
| City | % Employed | vs State | vs National | |
| 1. | Grayson | 30.6% | 0.98%(+29.6)#1 | 1.1%(+29.5)#44 |
| 2. | Wooldridge | 25.0% | 0.98%(+24.0)#2 | 1.1%(+23.9)#55 |
| 3. | White Branch | 20.3% | 0.98%(+19.3)#3 | 1.1%(+19.2)#73 |
| 4. | New Market | 18.4% | 0.98%(+17.4)#4 | 1.1%(+17.3)#84 |
| 5. | Essex | 14.8% | 0.98%(+13.8)#5 | 1.1%(+13.7)#120 |
| 6. | Allenville | 12.9% | 0.98%(+11.9)#6 | 1.1%(+11.8)#159 |
| 7. | Briarwood Estates | 12.1% | 0.98%(+11.1)#7 | 1.1%(+11.0)#174 |
| 8. | Commerce | 10.0% | 0.98%(+9.02)#8 | 1.1%(+8.91)#228 |
| 9. | Lupus | 10.0% | 0.98%(+9.02)#9 | 1.1%(+8.91)#230 |
| 10. | Edgar Springs | 9.8% | 0.98%(+8.82)#10 | 1.1%(+8.71)#238 |
| 11. | Tindall | 6.5% | 0.98%(+5.54)#11 | 1.1%(+5.43)#501 |
| 12. | Spickard | 6.5% | 0.98%(+5.51)#12 | 1.1%(+5.40)#503 |
| 13. | Crystal Lake Park | 6.3% | 0.98%(+5.33)#13 | 1.1%(+5.22)#527 |
| 14. | Brumley | 5.4% | 0.98%(+4.42)#14 | 1.1%(+4.31)#697 |
| 15. | Fairview | 5.4% | 0.98%(+4.40)#15 | 1.1%(+4.29)#698 |
| 16. | Collins | 5.3% | 0.98%(+4.28)#16 | 1.1%(+4.17)#732 |
| 17. | Fair Play | 5.1% | 0.98%(+4.10)#17 | 1.1%(+3.99)#769 |
| 18. | Richmond Heights | 4.7% | 0.98%(+3.72)#18 | 1.1%(+3.61)#876 |
| 19. | Shrewsbury | 4.7% | 0.98%(+3.69)#19 | 1.1%(+3.58)#884 |
| 20. | Town And Country | 4.6% | 0.98%(+3.63)#20 | 1.1%(+3.52)#906 |
| 21. | Foristell | 4.3% | 0.98%(+3.35)#21 | 1.1%(+3.24)#1,028 |
| 22. | Clayton | 4.3% | 0.98%(+3.29)#22 | 1.1%(+3.18)#1,050 |
| 23. | Winston | 4.3% | 0.98%(+3.27)#23 | 1.1%(+3.16)#1,058 |
| 24. | Hanley Hills | 4.2% | 0.98%(+3.26)#24 | 1.1%(+3.16)#1,061 |
| 25. | Rolla | 4.0% | 0.98%(+3.02)#25 | 1.1%(+2.91)#1,158 |
| 26. | Bel Nor | 4.0% | 0.98%(+2.98)#26 | 1.1%(+2.87)#1,190 |
| 27. | Airport Drive | 3.9% | 0.98%(+2.96)#27 | 1.1%(+2.85)#1,199 |
| 28. | Bellerive Acres | 3.8% | 0.98%(+2.86)#28 | 1.1%(+2.76)#1,246 |
| 29. | Bronaugh | 3.8% | 0.98%(+2.86)#29 | 1.1%(+2.76)#1,250 |
| 30. | Ste Genevieve | 3.7% | 0.98%(+2.71)#30 | 1.1%(+2.60)#1,335 |
| 31. | Benton | 3.7% | 0.98%(+2.68)#31 | 1.1%(+2.57)#1,361 |
| 32. | Manchester | 3.7% | 0.98%(+2.68)#32 | 1.1%(+2.57)#1,362 |
| 33. | Mercer | 3.7% | 0.98%(+2.67)#33 | 1.1%(+2.56)#1,368 |
| 34. | Riverview Estates | 3.6% | 0.98%(+2.59)#34 | 1.1%(+2.48)#1,424 |
| 35. | Wheeling | 3.5% | 0.98%(+2.53)#35 | 1.1%(+2.42)#1,478 |
| 36. | Oronogo | 3.3% | 0.98%(+2.35)#36 | 1.1%(+2.25)#1,582 |
| 37. | West Line | 3.3% | 0.98%(+2.35)#37 | 1.1%(+2.24)#1,590 |
| 38. | University City | 3.3% | 0.98%(+2.35)#38 | 1.1%(+2.24)#1,591 |
| 39. | Brentwood | 3.3% | 0.98%(+2.28)#39 | 1.1%(+2.17)#1,639 |
| 40. | Bogard | 3.3% | 0.98%(+2.28)#40 | 1.1%(+2.17)#1,645 |
| 41. | Garden City | 3.1% | 0.98%(+2.13)#41 | 1.1%(+2.02)#1,782 |
| 42. | Lamar Heights | 3.1% | 0.98%(+2.09)#42 | 1.1%(+1.99)#1,819 |
| 43. | Wilbur Park | 3.0% | 0.98%(+2.06)#43 | 1.1%(+1.95)#1,858 |
| 44. | Warson Woods | 3.0% | 0.98%(+2.05)#44 | 1.1%(+1.94)#1,862 |
| 45. | Augusta | 3.0% | 0.98%(+1.98)#45 | 1.1%(+1.87)#1,914 |
| 46. | Cairo | 2.9% | 0.98%(+1.96)#46 | 1.1%(+1.85)#1,933 |
| 47. | Maplewood | 2.9% | 0.98%(+1.94)#47 | 1.1%(+1.83)#1,946 |
| 48. | Dellwood | 2.9% | 0.98%(+1.92)#48 | 1.1%(+1.81)#1,972 |
| 49. | Duquesne | 2.9% | 0.98%(+1.88)#49 | 1.1%(+1.77)#2,002 |
| 50. | Holliday | 2.9% | 0.98%(+1.88)#50 | 1.1%(+1.77)#2,010 |
| 51. | Bland | 2.8% | 0.98%(+1.84)#51 | 1.1%(+1.73)#2,042 |
| 52. | Mountain Grove | 2.8% | 0.98%(+1.84)#52 | 1.1%(+1.73)#2,047 |
| 53. | Crestwood | 2.8% | 0.98%(+1.84)#53 | 1.1%(+1.73)#2,048 |
| 54. | Ladue | 2.8% | 0.98%(+1.83)#54 | 1.1%(+1.72)#2,063 |
| 55. | Holts Summit | 2.8% | 0.98%(+1.80)#55 | 1.1%(+1.69)#2,114 |
| 56. | Olivette | 2.8% | 0.98%(+1.77)#56 | 1.1%(+1.66)#2,154 |
| 57. | Polo | 2.7% | 0.98%(+1.73)#57 | 1.1%(+1.62)#2,205 |
| 58. | Columbia | 2.6% | 0.98%(+1.66)#58 | 1.1%(+1.55)#2,294 |
| 59. | Raymore | 2.6% | 0.98%(+1.64)#59 | 1.1%(+1.53)#2,320 |
| 60. | Chesterfield | 2.6% | 0.98%(+1.63)#60 | 1.1%(+1.52)#2,344 |
| 61. | Easton | 2.6% | 0.98%(+1.63)#61 | 1.1%(+1.52)#2,348 |
| 62. | Creve Coeur | 2.6% | 0.98%(+1.60)#62 | 1.1%(+1.50)#2,374 |
| 63. | Altenburg | 2.5% | 0.98%(+1.54)#63 | 1.1%(+1.43)#2,484 |
| 64. | Hermann | 2.5% | 0.98%(+1.51)#64 | 1.1%(+1.40)#2,531 |
| 65. | Wildwood | 2.5% | 0.98%(+1.48)#65 | 1.1%(+1.37)#2,588 |
| 66. | Maitland | 2.5% | 0.98%(+1.48)#66 | 1.1%(+1.37)#2,591 |
| 67. | Ballwin | 2.4% | 0.98%(+1.40)#67 | 1.1%(+1.29)#2,710 |
| 68. | South Greenfield | 2.4% | 0.98%(+1.40)#68 | 1.1%(+1.29)#2,721 |
| 69. | Affton | 2.3% | 0.98%(+1.32)#69 | 1.1%(+1.21)#2,848 |
| 70. | Madison | 2.3% | 0.98%(+1.30)#70 | 1.1%(+1.19)#2,871 |
| 71. | Sappington | 2.3% | 0.98%(+1.30)#71 | 1.1%(+1.19)#2,882 |
| 72. | Dadeville | 2.2% | 0.98%(+1.27)#72 | 1.1%(+1.16)#2,955 |
| 73. | Willard | 2.2% | 0.98%(+1.25)#73 | 1.1%(+1.14)#2,977 |
| 74. | Marlborough | 2.2% | 0.98%(+1.25)#74 | 1.1%(+1.14)#2,983 |
| 75. | Lakeshire | 2.2% | 0.98%(+1.25)#75 | 1.1%(+1.14)#2,984 |
| 76. | Diehlstadt | 2.2% | 0.98%(+1.19)#76 | 1.1%(+1.08)#3,092 |
| 77. | St Clair | 2.2% | 0.98%(+1.19)#77 | 1.1%(+1.08)#3,103 |
| 78. | Grantwood Village | 2.2% | 0.98%(+1.19)#78 | 1.1%(+1.08)#3,104 |
| 79. | Bethany | 2.2% | 0.98%(+1.17)#79 | 1.1%(+1.06)#3,125 |
| 80. | Pleasant Hill | 2.1% | 0.98%(+1.14)#80 | 1.1%(+1.03)#3,177 |
| 81. | St Louis | 2.1% | 0.98%(+1.10)#81 | 1.1%(+0.994)#3,254 |
| 82. | Oak Grove | 2.1% | 0.98%(+1.08)#82 | 1.1%(+0.969)#3,294 |
| 83. | Duenweg | 2.1% | 0.98%(+1.07)#83 | 1.1%(+0.962)#3,314 |
| 84. | Lathrop | 2.0% | 0.98%(+1.06)#84 | 1.1%(+0.953)#3,332 |
| 85. | Pasadena Hills | 2.0% | 0.98%(+1.06)#85 | 1.1%(+0.947)#3,355 |
| 86. | Kelso | 2.0% | 0.98%(+1.05)#86 | 1.1%(+0.943)#3,361 |
| 87. | Frontenac | 2.0% | 0.98%(+1.05)#87 | 1.1%(+0.937)#3,370 |
| 88. | Mendon | 2.0% | 0.98%(+1.04)#88 | 1.1%(+0.929)#3,391 |
| 89. | Owensville | 2.0% | 0.98%(+1.02)#89 | 1.1%(+0.915)#3,412 |
| 90. | Gordonville | 2.0% | 0.98%(+1.02)#90 | 1.1%(+0.909)#3,424 |
| 91. | Meta | 2.0% | 0.98%(+1.02)#91 | 1.1%(+0.909)#3,428 |
| 92. | Rhineland | 2.0% | 0.98%(+1.02)#92 | 1.1%(+0.909)#3,429 |
| 93. | Higginsville | 2.0% | 0.98%(+1.01)#93 | 1.1%(+0.904)#3,436 |
| 94. | Oregon | 2.0% | 0.98%(+0.975)#94 | 1.1%(+0.866)#3,532 |
| 95. | Claycomo | 1.9% | 0.98%(+0.930)#95 | 1.1%(+0.821)#3,625 |
| 96. | Neosho | 1.9% | 0.98%(+0.921)#96 | 1.1%(+0.813)#3,645 |
| 97. | Imperial | 1.9% | 0.98%(+0.913)#97 | 1.1%(+0.804)#3,667 |
| 98. | Normandy | 1.9% | 0.98%(+0.907)#98 | 1.1%(+0.798)#3,692 |
| 99. | Pineville | 1.9% | 0.98%(+0.885)#99 | 1.1%(+0.776)#3,753 |
| 100. | West Alton | 1.8% | 0.98%(+0.863)#100 | 1.1%(+0.754)#3,812 |
Common Questions
What are the Top 10 Cities with the Highest Percentage of Population Employed in Life, Physical & Social Science in Missouri?
Top 10 Cities with the Highest Percentage of Population Employed in Life, Physical & Social Science in Missouri are:
#1
25.0%
#2
14.8%
#3
12.9%
#4
10.0%
#5
10.0%
#6
9.8%
#7
6.5%
#8
6.5%
#9
6.3%
#10
5.4%
What city has the Highest Percentage of Population Employed in Life, Physical & Social Science in Missouri?
Wooldridge has the Highest Percentage of Population Employed in Life, Physical & Social Science in Missouri with 25.0%.
What is the Percentage of Population Employed in Life, Physical & Social Science in the State of Missouri?
Percentage of Population Employed in Life, Physical & Social Science in Missouri is 0.98%.
What is the Percentage of Population Employed in Life, Physical & Social Science in the United States?
Percentage of Population Employed in Life, Physical & Social Science in the United States is 1.1%.