Zip Codes with the Highest Percentage of Population Employed in Life, Physical & Social Science in Chino, CA
RELATED REPORTS & OPTIONS
Life, Physical & Social Science
Chino
Compare Zip Codes
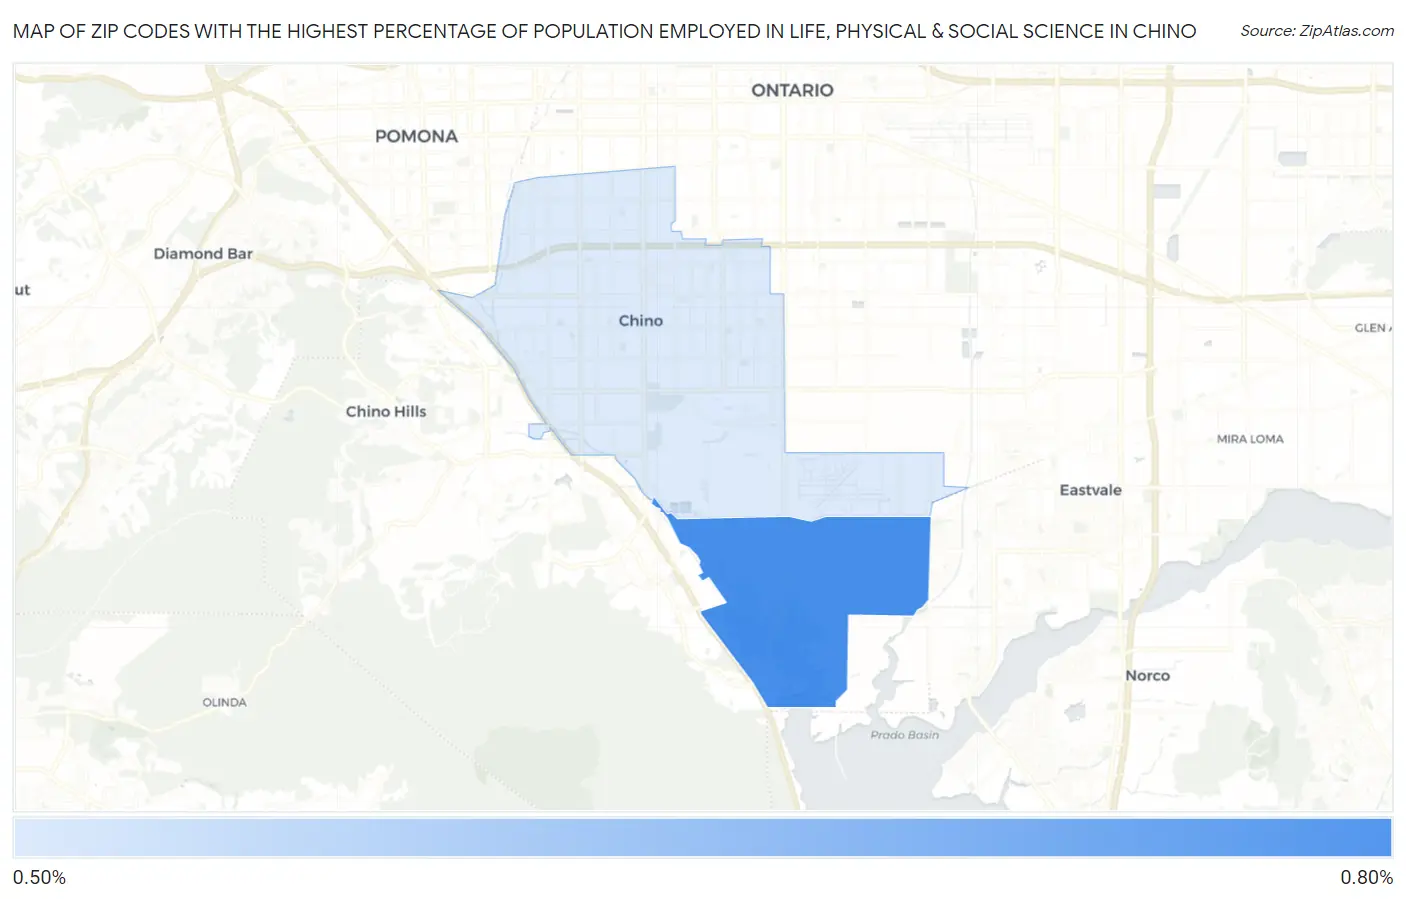
Map of Zip Codes with the Highest Percentage of Population Employed in Life, Physical & Social Science in Chino
0.51%
0.77%
Zip Codes with the Highest Percentage of Population Employed in Life, Physical & Social Science in Chino, CA
| Zip Code | % Employed | vs State | vs National | |
| 1. | 91708 | 0.77% | 1.3%(-0.536)#898 | 1.1%(-0.319)#11,286 |
| 2. | 91710 | 0.51% | 1.3%(-0.795)#1,070 | 1.1%(-0.578)#14,348 |
1
Common Questions
What are the Top Zip Codes with the Highest Percentage of Population Employed in Life, Physical & Social Science in Chino, CA?
Top Zip Codes with the Highest Percentage of Population Employed in Life, Physical & Social Science in Chino, CA are:
What zip code has the Highest Percentage of Population Employed in Life, Physical & Social Science in Chino, CA?
91708 has the Highest Percentage of Population Employed in Life, Physical & Social Science in Chino, CA with 0.77%.
What is the Percentage of Population Employed in Life, Physical & Social Science in Chino, CA?
Percentage of Population Employed in Life, Physical & Social Science in Chino is 0.56%.
What is the Percentage of Population Employed in Life, Physical & Social Science in California?
Percentage of Population Employed in Life, Physical & Social Science in California is 1.3%.
What is the Percentage of Population Employed in Life, Physical & Social Science in the United States?
Percentage of Population Employed in Life, Physical & Social Science in the United States is 1.1%.