Fieldbrook, CA Map & Demographics
Fieldbrook Map
Fieldbrook Overview
$46,235
PER CAPITA INCOME
$100,179
AVG FAMILY INCOME
$82,500
AVG HOUSEHOLD INCOME
39.1%
WAGE / INCOME GAP [ % ]
60.9¢/ $1
WAGE / INCOME GAP [ $ ]
0.40
INEQUALITY / GINI INDEX
777
TOTAL POPULATION
396
MALE POPULATION
381
FEMALE POPULATION
103.94
MALES / 100 FEMALES
96.21
FEMALES / 100 MALES
52.3
MEDIAN AGE
2.5
AVG FAMILY SIZE
2.2
AVG HOUSEHOLD SIZE
385
LABOR FORCE [ PEOPLE ]
58.1%
PERCENT IN LABOR FORCE
5.2%
UNEMPLOYMENT RATE
Income in Fieldbrook
Income Overview in Fieldbrook
Per Capita Income in Fieldbrook is $46,235, while median incomes of families and households are $100,179 and $82,500 respectively.
| Characteristic | Number | Measure |
| Per Capita Income | 777 | $46,235 |
| Median Family Income | 223 | $100,179 |
| Mean Family Income | 223 | $120,961 |
| Median Household Income | 348 | $82,500 |
| Mean Household Income | 348 | $108,720 |
| Income Deficit | 223 | $0 |
| Wage / Income Gap (%) | 777 | 39.13% |
| Wage / Income Gap ($) | 777 | 60.87¢ per $1 |
| Gini / Inequality Index | 777 | 0.40 |
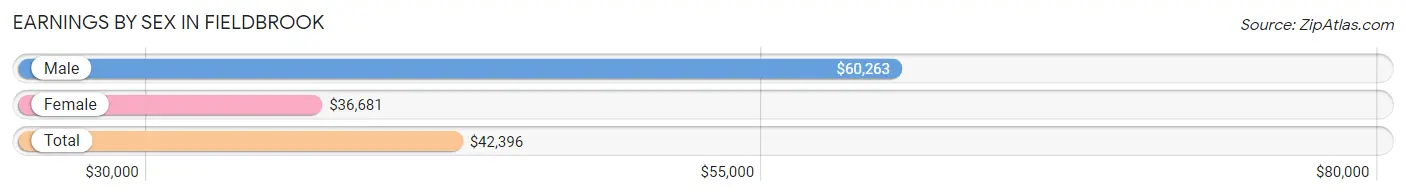
Earnings by Sex in Fieldbrook
Average Earnings in Fieldbrook are $42,396, $60,263 for men and $36,681 for women, a difference of 39.1%.
| Sex | Number | Average Earnings |
| Male | 220 (55.7%) | $60,263 |
| Female | 175 (44.3%) | $36,681 |
| Total | 395 (100.0%) | $42,396 |
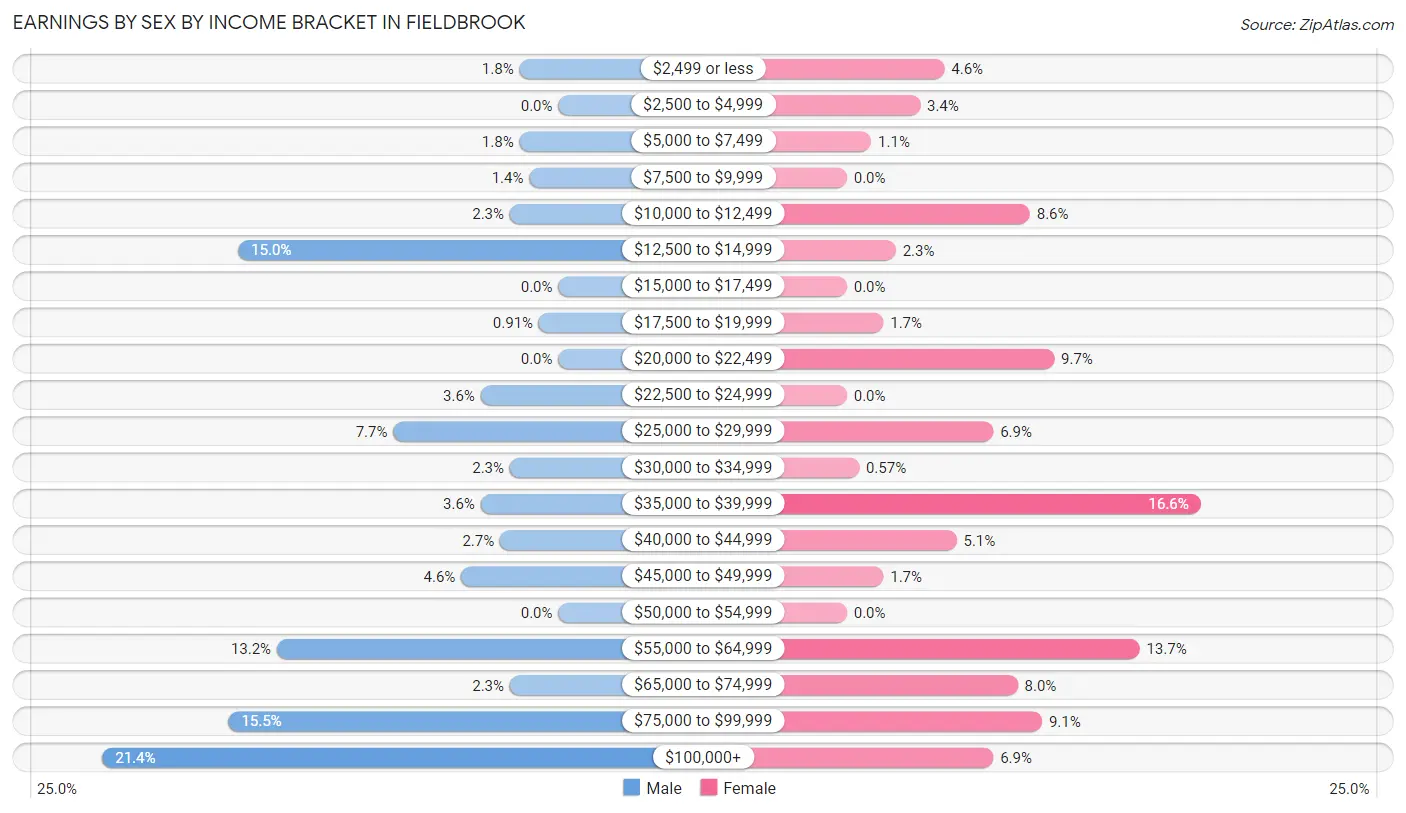
Earnings by Sex by Income Bracket in Fieldbrook
The most common earnings brackets in Fieldbrook are $100,000+ for men (47 | 21.4%) and $35,000 to $39,999 for women (29 | 16.6%).
| Income | Male | Female |
| $2,499 or less | 4 (1.8%) | 8 (4.6%) |
| $2,500 to $4,999 | 0 (0.0%) | 6 (3.4%) |
| $5,000 to $7,499 | 4 (1.8%) | 2 (1.1%) |
| $7,500 to $9,999 | 3 (1.4%) | 0 (0.0%) |
| $10,000 to $12,499 | 5 (2.3%) | 15 (8.6%) |
| $12,500 to $14,999 | 33 (15.0%) | 4 (2.3%) |
| $15,000 to $17,499 | 0 (0.0%) | 0 (0.0%) |
| $17,500 to $19,999 | 2 (0.9%) | 3 (1.7%) |
| $20,000 to $22,499 | 0 (0.0%) | 17 (9.7%) |
| $22,500 to $24,999 | 8 (3.6%) | 0 (0.0%) |
| $25,000 to $29,999 | 17 (7.7%) | 12 (6.9%) |
| $30,000 to $34,999 | 5 (2.3%) | 1 (0.6%) |
| $35,000 to $39,999 | 8 (3.6%) | 29 (16.6%) |
| $40,000 to $44,999 | 6 (2.7%) | 9 (5.1%) |
| $45,000 to $49,999 | 10 (4.5%) | 3 (1.7%) |
| $50,000 to $54,999 | 0 (0.0%) | 0 (0.0%) |
| $55,000 to $64,999 | 29 (13.2%) | 24 (13.7%) |
| $65,000 to $74,999 | 5 (2.3%) | 14 (8.0%) |
| $75,000 to $99,999 | 34 (15.4%) | 16 (9.1%) |
| $100,000+ | 47 (21.4%) | 12 (6.9%) |
| Total | 220 (100.0%) | 175 (100.0%) |
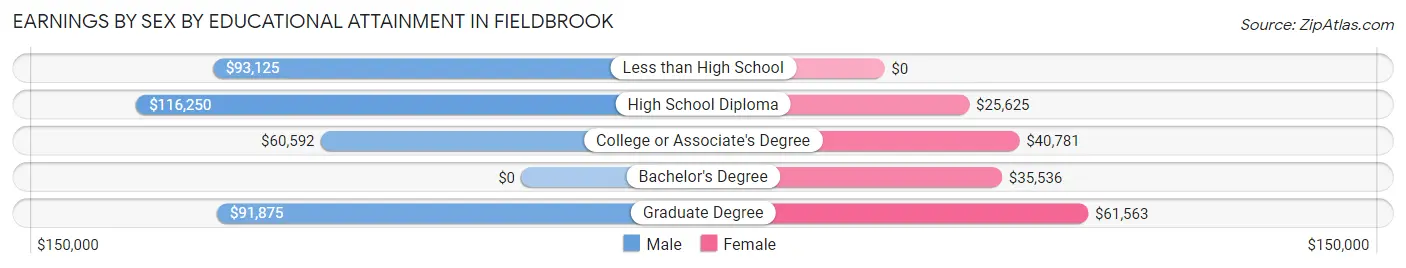
Earnings by Sex by Educational Attainment in Fieldbrook
Average earnings in Fieldbrook are $60,789 for men and $36,681 for women, a difference of 39.7%. Men with an educational attainment of high school diploma enjoy the highest average annual earnings of $116,250, while those with college or associate's degree education earn the least with $60,592. Women with an educational attainment of graduate degree earn the most with the average annual earnings of $61,563, while those with high school diploma education have the smallest earnings of $25,625.
| Educational Attainment | Male Income | Female Income |
| Less than High School | $93,125 | $0 |
| High School Diploma | $116,250 | $25,625 |
| College or Associate's Degree | $60,592 | $40,781 |
| Bachelor's Degree | - | - |
| Graduate Degree | $91,875 | $61,563 |
| Total | $60,789 | $36,681 |
Family Income in Fieldbrook
Family Income Brackets in Fieldbrook
According to the Fieldbrook family income data, there are 61 families falling into the $100,000 to $149,999 income range, which is the most common income bracket and makes up 27.4% of all families.
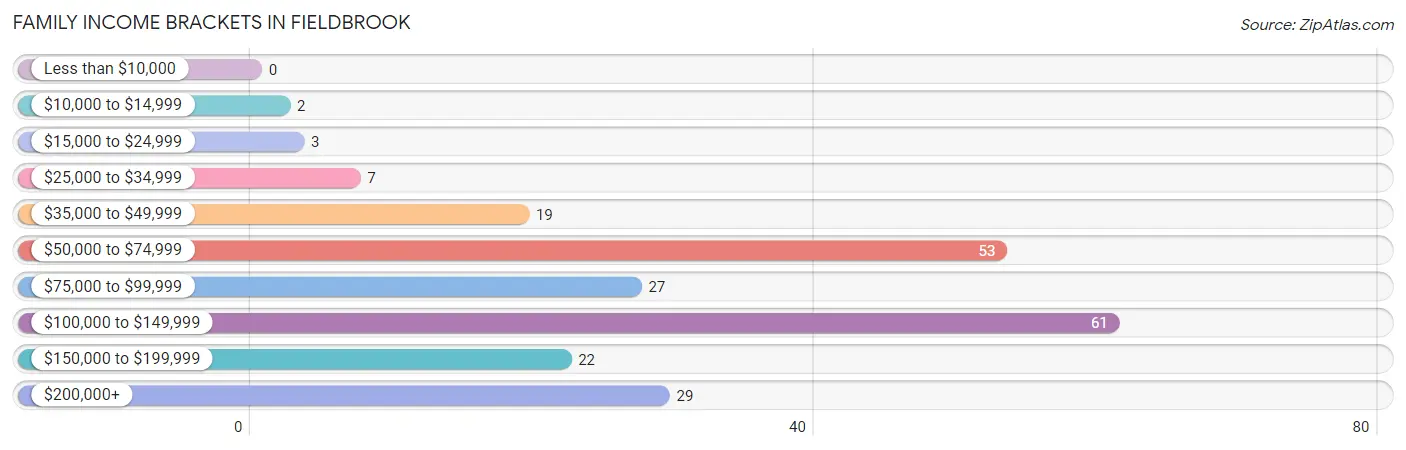
| Income Bracket | # Families | % Families |
| Less than $10,000 | 0 | 0.0% |
| $10,000 to $14,999 | 2 | 0.9% |
| $15,000 to $24,999 | 3 | 1.3% |
| $25,000 to $34,999 | 7 | 3.1% |
| $35,000 to $49,999 | 19 | 8.5% |
| $50,000 to $74,999 | 53 | 23.8% |
| $75,000 to $99,999 | 27 | 12.1% |
| $100,000 to $149,999 | 61 | 27.4% |
| $150,000 to $199,999 | 22 | 9.9% |
| $200,000+ | 29 | 13.0% |
Family Income by Famaliy Size in Fieldbrook
4-person families (26 | 11.7%) account for the highest median family income in Fieldbrook with $117,500 per family, while 2-person families (137 | 61.4%) have the highest median income of $40,938 per family member.
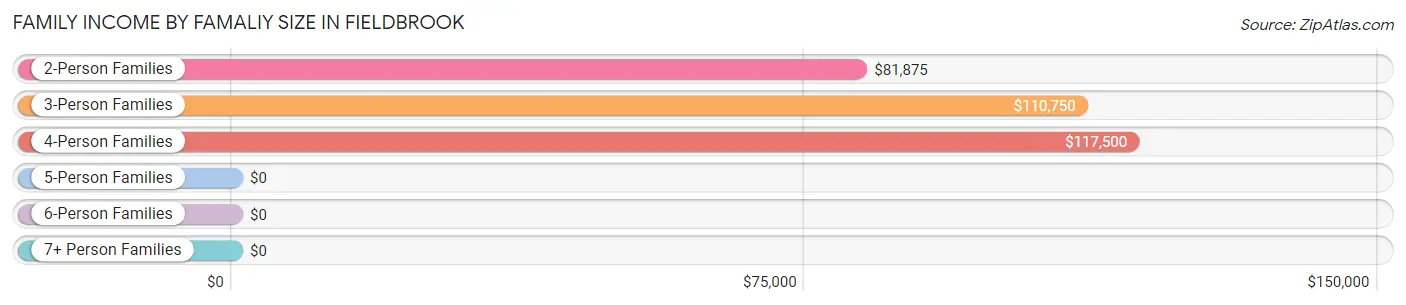
| Income Bracket | # Families | Median Income |
| 2-Person Families | 137 (61.4%) | $81,875 |
| 3-Person Families | 56 (25.1%) | $110,750 |
| 4-Person Families | 26 (11.7%) | $117,500 |
| 5-Person Families | 2 (0.9%) | $0 |
| 6-Person Families | 2 (0.9%) | $0 |
| 7+ Person Families | 0 (0.0%) | $0 |
| Total | 223 (100.0%) | $100,179 |
Family Income by Number of Earners in Fieldbrook
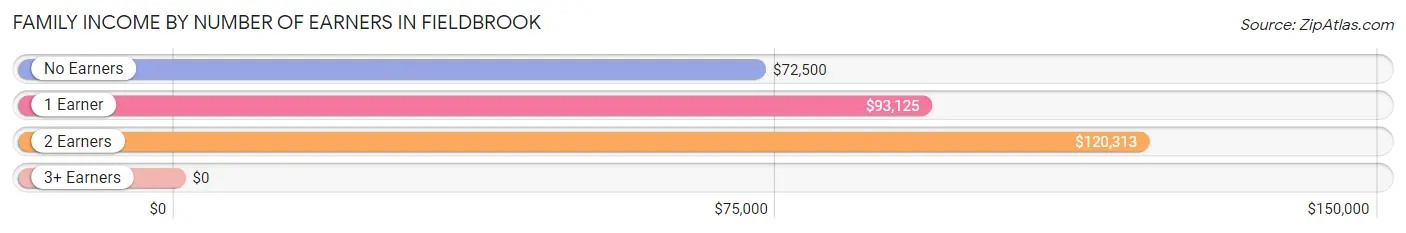
| Number of Earners | # Families | Median Income |
| No Earners | 42 (18.8%) | $72,500 |
| 1 Earner | 87 (39.0%) | $93,125 |
| 2 Earners | 93 (41.7%) | $120,313 |
| 3+ Earners | 1 (0.4%) | $0 |
| Total | 223 (100.0%) | $100,179 |
Household Income in Fieldbrook
Household Income Brackets in Fieldbrook
With 73 households falling in the category, the $100,000 to $149,999 income range is the most frequent in Fieldbrook, accounting for 21.0% of all households. In contrast, only 2 households (0.6%) fall into the $10,000 to $14,999 income bracket, making it the least populous group.
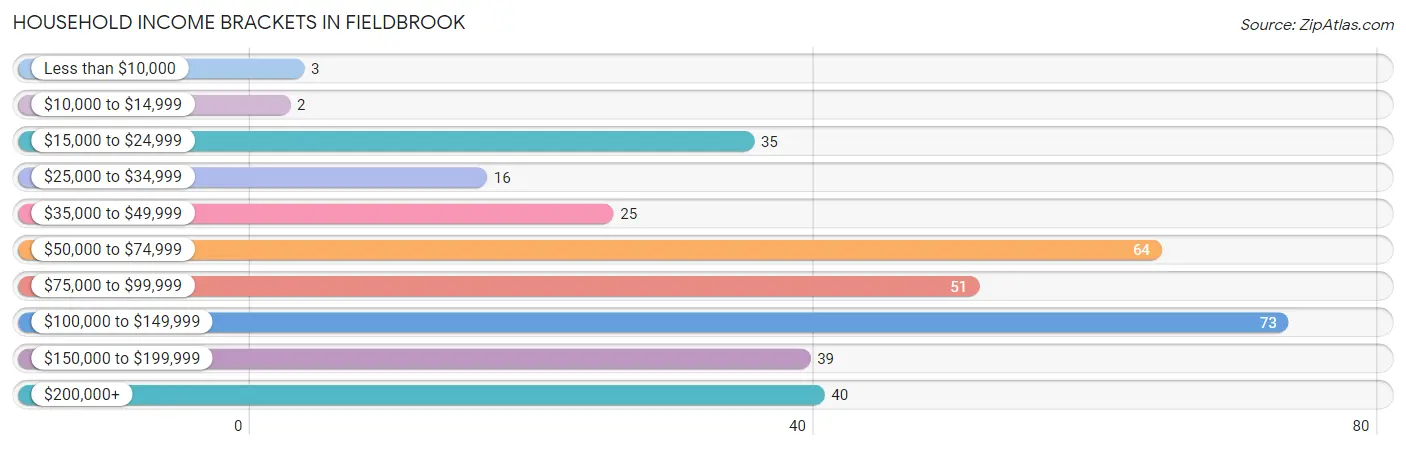
| Income Bracket | # Households | % Households |
| Less than $10,000 | 3 | 0.9% |
| $10,000 to $14,999 | 2 | 0.6% |
| $15,000 to $24,999 | 35 | 10.1% |
| $25,000 to $34,999 | 16 | 4.6% |
| $35,000 to $49,999 | 25 | 7.2% |
| $50,000 to $74,999 | 64 | 18.4% |
| $75,000 to $99,999 | 51 | 14.7% |
| $100,000 to $149,999 | 73 | 21.0% |
| $150,000 to $199,999 | 39 | 11.2% |
| $200,000+ | 40 | 11.5% |
Household Income by Householder Age in Fieldbrook
The median household income in Fieldbrook is $82,500, with the highest median household income of $122,083 found in the 25 to 44 years age bracket for the primary householder. A total of 70 households (20.1%) fall into this category.
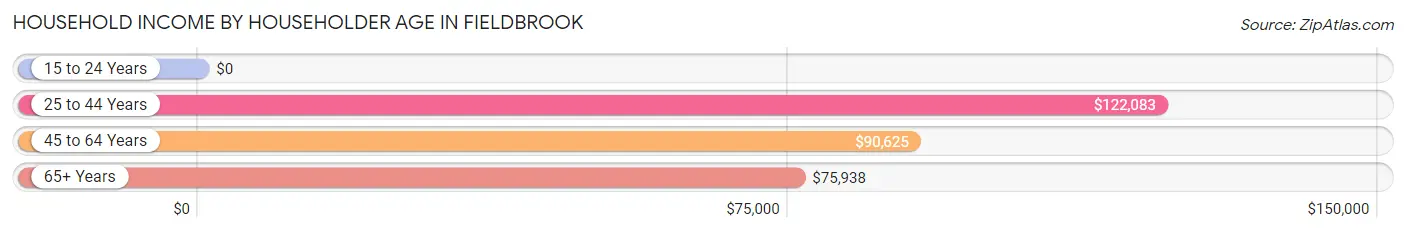
| Income Bracket | # Households | Median Income |
| 15 to 24 Years | 0 (0.0%) | $0 |
| 25 to 44 Years | 70 (20.1%) | $122,083 |
| 45 to 64 Years | 127 (36.5%) | $90,625 |
| 65+ Years | 151 (43.4%) | $75,938 |
| Total | 348 (100.0%) | $82,500 |
Poverty in Fieldbrook
Income Below Poverty by Sex and Age in Fieldbrook
With 5.6% poverty level for males and 6.5% for females among the residents of Fieldbrook, 5 year old males and 18 to 24 year old females are the most vulnerable to poverty, with 2 males (66.7%) and 3 females (100.0%) in their respective age groups living below the poverty level.
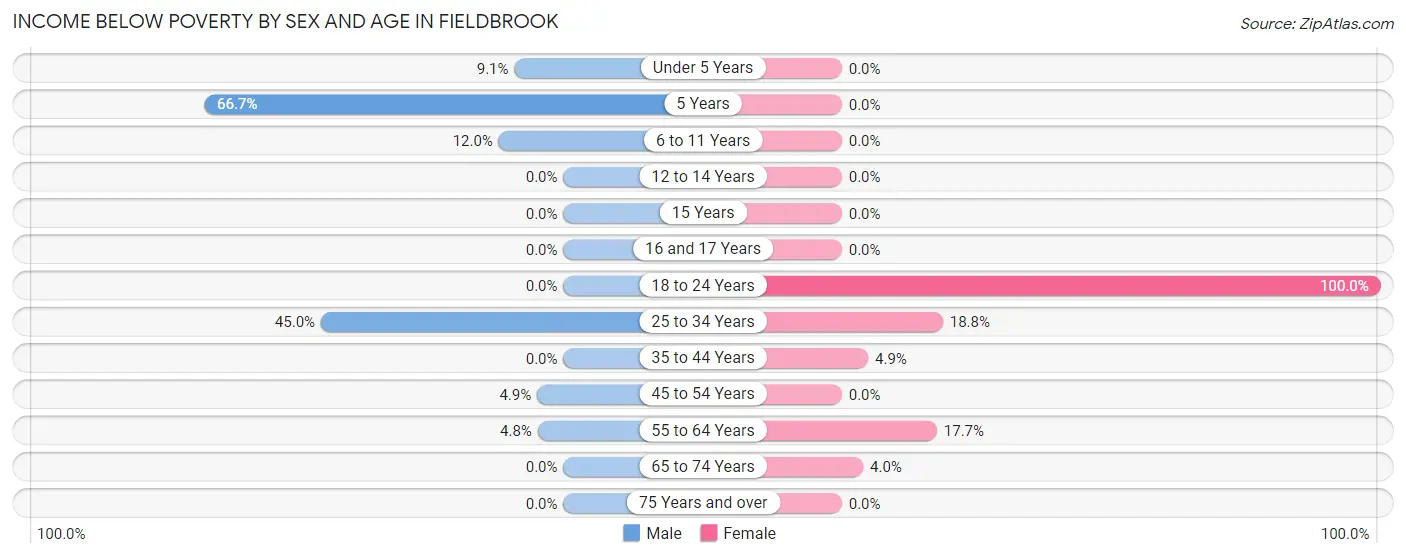
| Age Bracket | Male | Female |
| Under 5 Years | 1 (9.1%) | 0 (0.0%) |
| 5 Years | 2 (66.7%) | 0 (0.0%) |
| 6 to 11 Years | 3 (12.0%) | 0 (0.0%) |
| 12 to 14 Years | 0 (0.0%) | 0 (0.0%) |
| 15 Years | 0 (0.0%) | 0 (0.0%) |
| 16 and 17 Years | 0 (0.0%) | 0 (0.0%) |
| 18 to 24 Years | 0 (0.0%) | 3 (100.0%) |
| 25 to 34 Years | 9 (45.0%) | 6 (18.8%) |
| 35 to 44 Years | 0 (0.0%) | 2 (4.9%) |
| 45 to 54 Years | 4 (4.9%) | 0 (0.0%) |
| 55 to 64 Years | 3 (4.8%) | 9 (17.6%) |
| 65 to 74 Years | 0 (0.0%) | 4 (4.0%) |
| 75 Years and over | 0 (0.0%) | 0 (0.0%) |
| Total | 22 (5.6%) | 24 (6.5%) |
Income Above Poverty by Sex and Age in Fieldbrook
According to the poverty statistics in Fieldbrook, males aged 12 to 14 years and females aged under 5 years are the age groups that are most secure financially, with 100.0% of males and 100.0% of females in these age groups living above the poverty line.
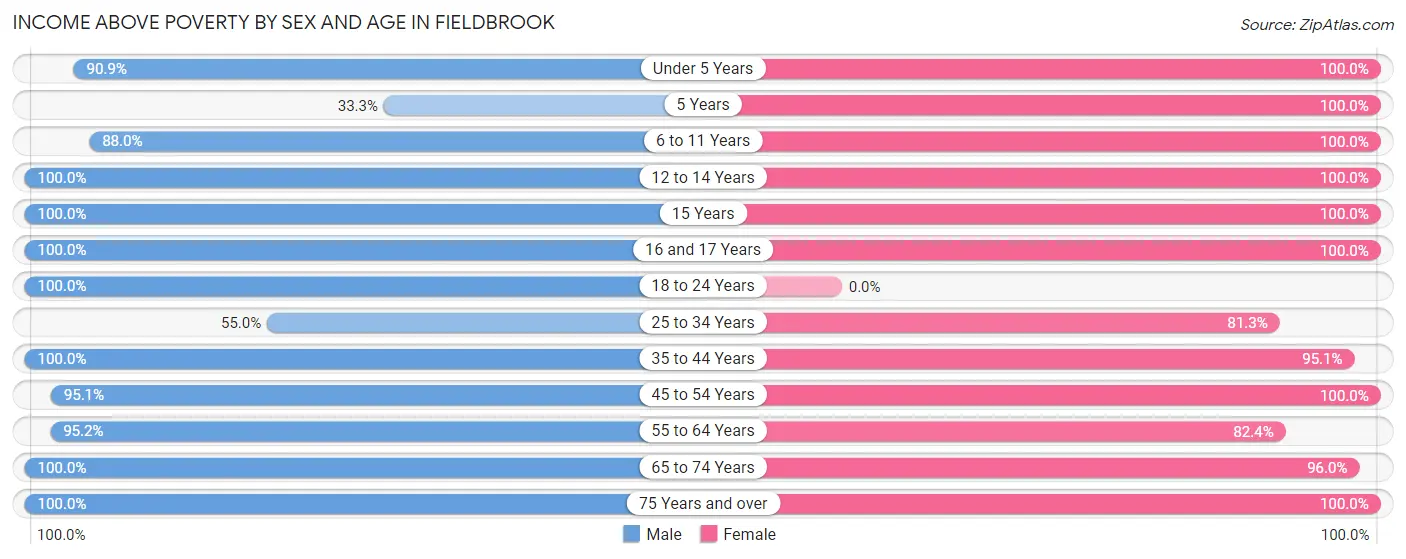
| Age Bracket | Male | Female |
| Under 5 Years | 10 (90.9%) | 31 (100.0%) |
| 5 Years | 1 (33.3%) | 2 (100.0%) |
| 6 to 11 Years | 22 (88.0%) | 9 (100.0%) |
| 12 to 14 Years | 11 (100.0%) | 6 (100.0%) |
| 15 Years | 5 (100.0%) | 1 (100.0%) |
| 16 and 17 Years | 15 (100.0%) | 3 (100.0%) |
| 18 to 24 Years | 7 (100.0%) | 0 (0.0%) |
| 25 to 34 Years | 11 (55.0%) | 26 (81.2%) |
| 35 to 44 Years | 55 (100.0%) | 39 (95.1%) |
| 45 to 54 Years | 78 (95.1%) | 66 (100.0%) |
| 55 to 64 Years | 60 (95.2%) | 42 (82.4%) |
| 65 to 74 Years | 81 (100.0%) | 97 (96.0%) |
| 75 Years and over | 18 (100.0%) | 25 (100.0%) |
| Total | 374 (94.4%) | 347 (93.5%) |
Income Below Poverty Among Married-Couple Families in Fieldbrook
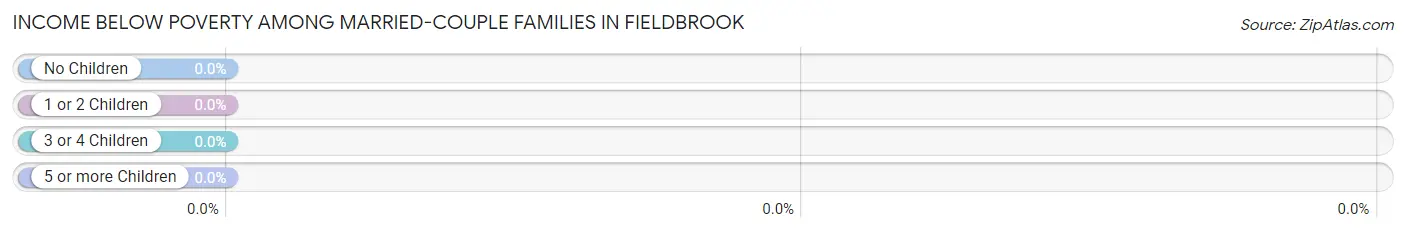
| Children | Above Poverty | Below Poverty |
| No Children | 142 (100.0%) | 0 (0.0%) |
| 1 or 2 Children | 56 (100.0%) | 0 (0.0%) |
| 3 or 4 Children | 2 (100.0%) | 0 (0.0%) |
| 5 or more Children | 0 (0.0%) | 0 (0.0%) |
| Total | 200 (100.0%) | 0 (0.0%) |
Income Below Poverty Among Single-Parent Households in Fieldbrook
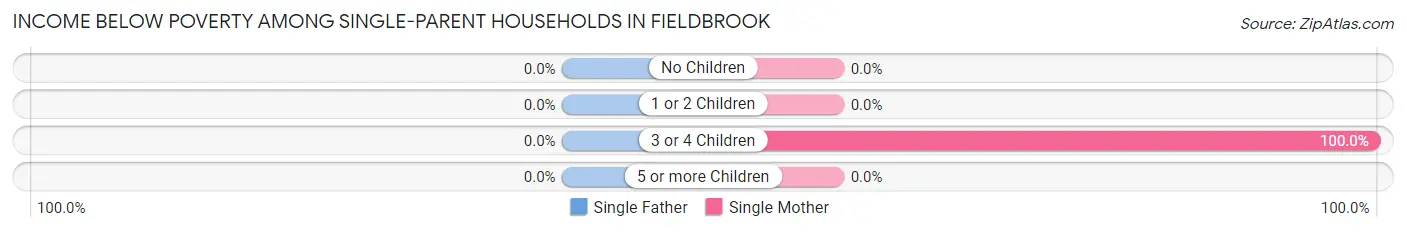
| Children | Single Father | Single Mother |
| No Children | 0 (0.0%) | 0 (0.0%) |
| 1 or 2 Children | 0 (0.0%) | 0 (0.0%) |
| 3 or 4 Children | 0 (0.0%) | 2 (100.0%) |
| 5 or more Children | 0 (0.0%) | 0 (0.0%) |
| Total | 0 (0.0%) | 2 (20.0%) |
Income Below Poverty Among Married-Couple vs Single-Parent Households in Fieldbrook
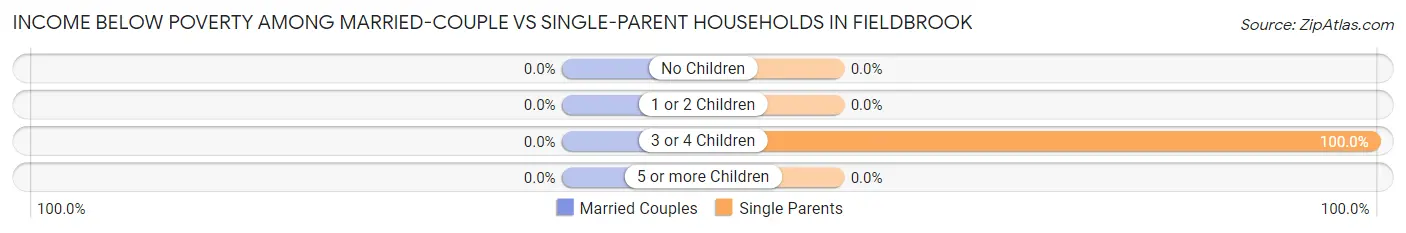
| Children | Married-Couple Families | Single-Parent Households |
| No Children | 0 (0.0%) | 0 (0.0%) |
| 1 or 2 Children | 0 (0.0%) | 0 (0.0%) |
| 3 or 4 Children | 0 (0.0%) | 2 (100.0%) |
| 5 or more Children | 0 (0.0%) | 0 (0.0%) |
| Total | 0 (0.0%) | 2 (8.7%) |
Race in Fieldbrook
The most populous races in Fieldbrook are White / Caucasian (725 | 93.3%), Two or more Races (33 | 4.3%), and Hispanic or Latino (28 | 3.6%).
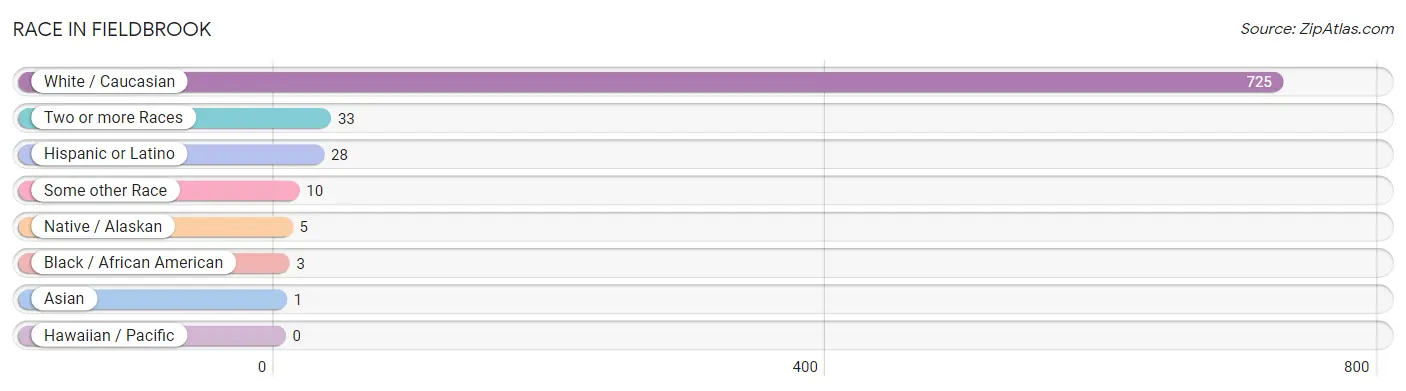
| Race | # Population | % Population |
| Asian | 1 | 0.1% |
| Black / African American | 3 | 0.4% |
| Hawaiian / Pacific | 0 | 0.0% |
| Hispanic or Latino | 28 | 3.6% |
| Native / Alaskan | 5 | 0.6% |
| White / Caucasian | 725 | 93.3% |
| Two or more Races | 33 | 4.3% |
| Some other Race | 10 | 1.3% |
| Total | 777 | 100.0% |
Ancestry in Fieldbrook
The most populous ancestries reported in Fieldbrook are German (189 | 24.3%), Irish (140 | 18.0%), European (88 | 11.3%), English (70 | 9.0%), and Welsh (33 | 4.3%), together accounting for 66.9% of all Fieldbrook residents.
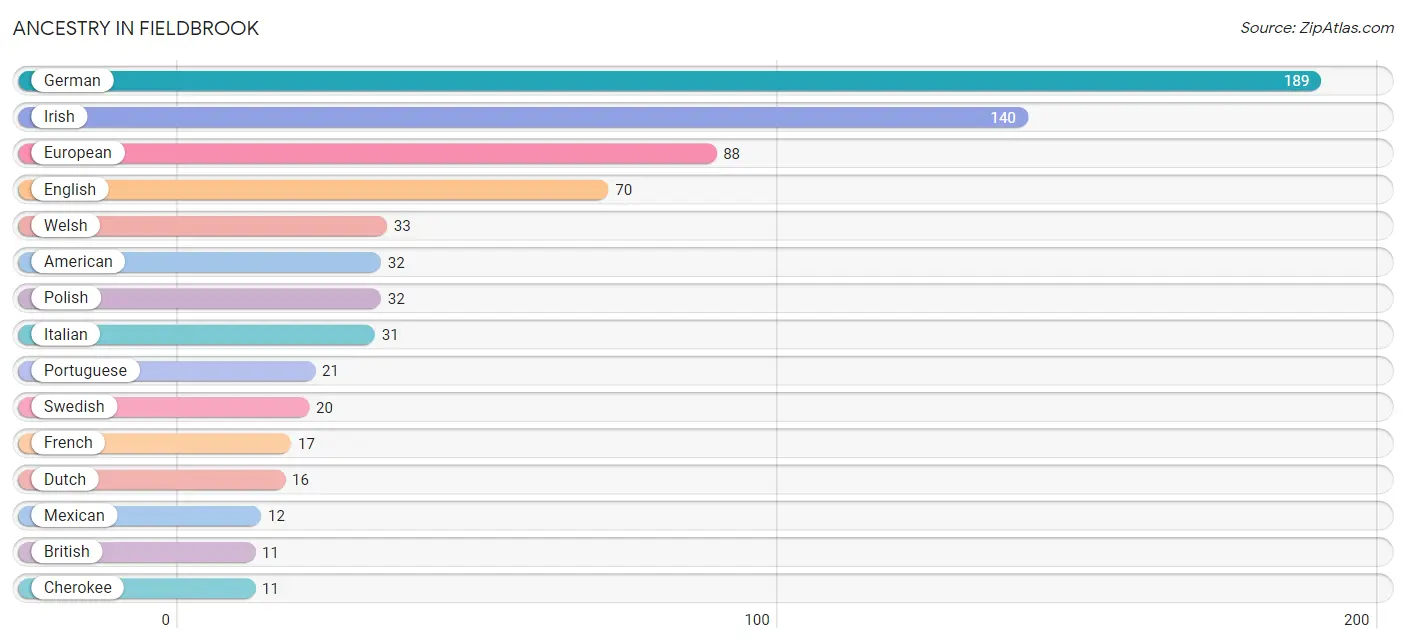
| Ancestry | # Population | % Population |
| American | 32 | 4.1% |
| Arab | 7 | 0.9% |
| Austrian | 10 | 1.3% |
| British | 11 | 1.4% |
| Canadian | 2 | 0.3% |
| Cherokee | 11 | 1.4% |
| Chilean | 7 | 0.9% |
| Comanche | 4 | 0.5% |
| Cuban | 5 | 0.6% |
| Danish | 3 | 0.4% |
| Dutch | 16 | 2.1% |
| Eastern European | 1 | 0.1% |
| English | 70 | 9.0% |
| European | 88 | 11.3% |
| French | 17 | 2.2% |
| French Canadian | 3 | 0.4% |
| German | 189 | 24.3% |
| Greek | 7 | 0.9% |
| Irish | 140 | 18.0% |
| Iroquois | 1 | 0.1% |
| Italian | 31 | 4.0% |
| Korean | 1 | 0.1% |
| Lebanese | 7 | 0.9% |
| Mexican | 12 | 1.5% |
| Navajo | 3 | 0.4% |
| Norwegian | 10 | 1.3% |
| Pennsylvania German | 4 | 0.5% |
| Polish | 32 | 4.1% |
| Portuguese | 21 | 2.7% |
| Russian | 7 | 0.9% |
| Scotch-Irish | 1 | 0.1% |
| Scottish | 5 | 0.6% |
| South American | 7 | 0.9% |
| Spaniard | 4 | 0.5% |
| Swedish | 20 | 2.6% |
| Swiss | 10 | 1.3% |
| Syrian | 7 | 0.9% |
| Ukrainian | 7 | 0.9% |
| Welsh | 33 | 4.3% | View All 39 Rows |
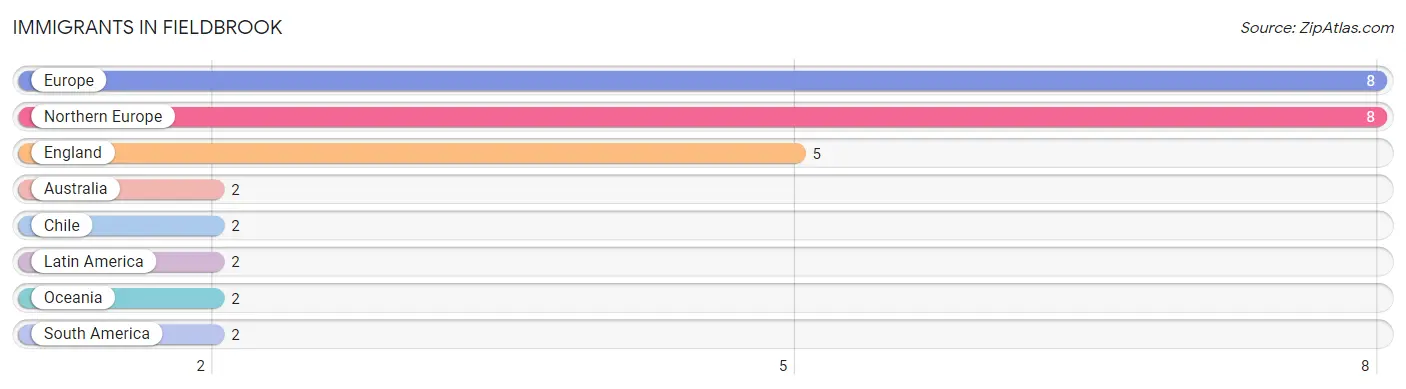
Immigrants in Fieldbrook
The most numerous immigrant groups reported in Fieldbrook came from Europe (8 | 1.0%), Northern Europe (8 | 1.0%), England (5 | 0.6%), Australia (2 | 0.3%), and Chile (2 | 0.3%), together accounting for 3.2% of all Fieldbrook residents.
| Immigration Origin | # Population | % Population |
| Australia | 2 | 0.3% |
| Chile | 2 | 0.3% |
| England | 5 | 0.6% |
| Europe | 8 | 1.0% |
| Latin America | 2 | 0.3% |
| Northern Europe | 8 | 1.0% |
| Oceania | 2 | 0.3% |
| South America | 2 | 0.3% | View All 8 Rows |
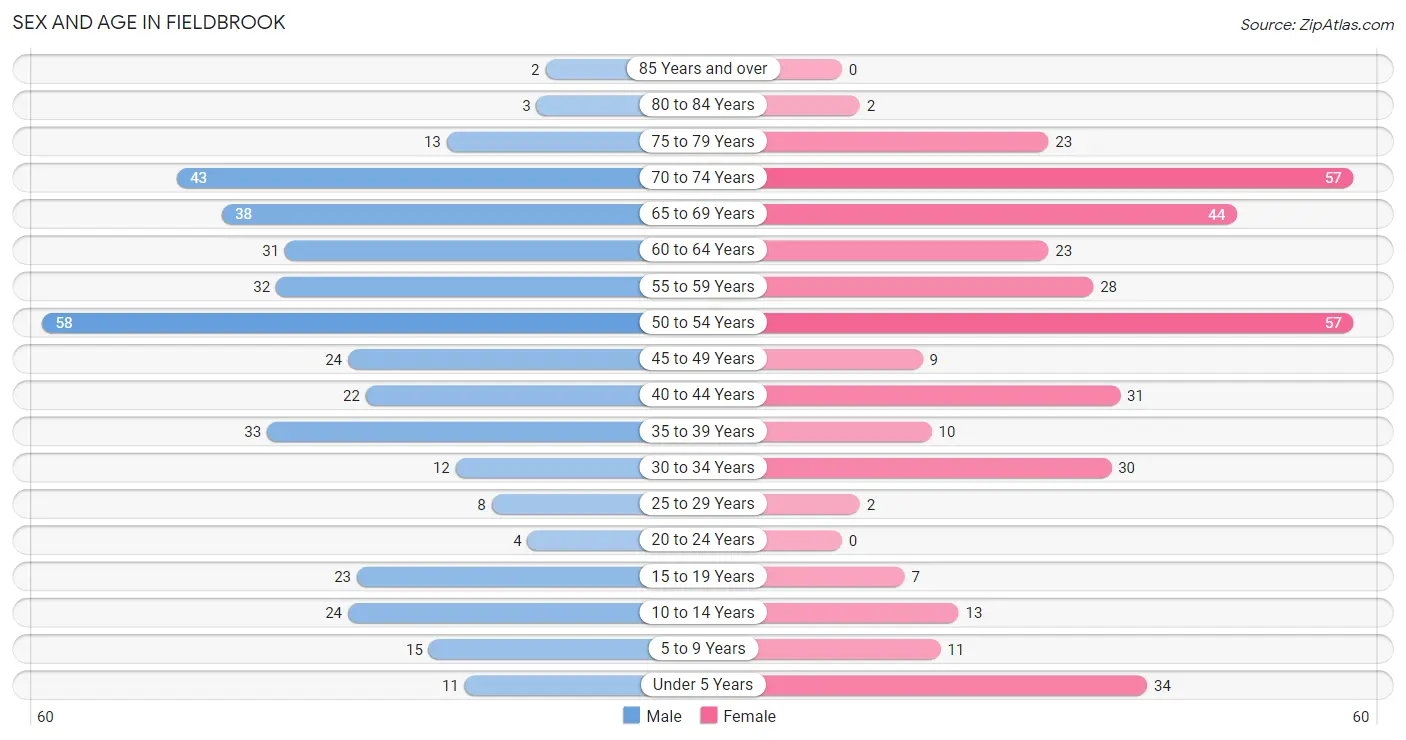
Sex and Age in Fieldbrook
Sex and Age in Fieldbrook
The most populous age groups in Fieldbrook are 50 to 54 Years (58 | 14.6%) for men and 50 to 54 Years (57 | 15.0%) for women.
| Age Bracket | Male | Female |
| Under 5 Years | 11 (2.8%) | 34 (8.9%) |
| 5 to 9 Years | 15 (3.8%) | 11 (2.9%) |
| 10 to 14 Years | 24 (6.1%) | 13 (3.4%) |
| 15 to 19 Years | 23 (5.8%) | 7 (1.8%) |
| 20 to 24 Years | 4 (1.0%) | 0 (0.0%) |
| 25 to 29 Years | 8 (2.0%) | 2 (0.5%) |
| 30 to 34 Years | 12 (3.0%) | 30 (7.9%) |
| 35 to 39 Years | 33 (8.3%) | 10 (2.6%) |
| 40 to 44 Years | 22 (5.6%) | 31 (8.1%) |
| 45 to 49 Years | 24 (6.1%) | 9 (2.4%) |
| 50 to 54 Years | 58 (14.6%) | 57 (15.0%) |
| 55 to 59 Years | 32 (8.1%) | 28 (7.3%) |
| 60 to 64 Years | 31 (7.8%) | 23 (6.0%) |
| 65 to 69 Years | 38 (9.6%) | 44 (11.6%) |
| 70 to 74 Years | 43 (10.9%) | 57 (15.0%) |
| 75 to 79 Years | 13 (3.3%) | 23 (6.0%) |
| 80 to 84 Years | 3 (0.8%) | 2 (0.5%) |
| 85 Years and over | 2 (0.5%) | 0 (0.0%) |
| Total | 396 (100.0%) | 381 (100.0%) |
Families and Households in Fieldbrook
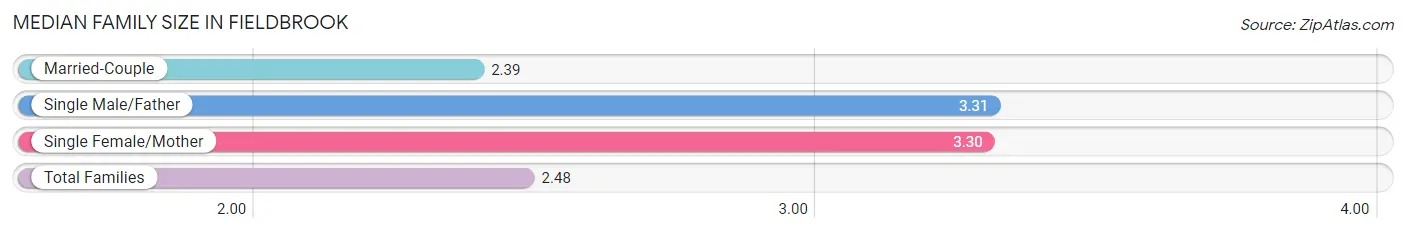
Median Family Size in Fieldbrook
The median family size in Fieldbrook is 2.48 persons per family, with single male/father families (13 | 5.8%) accounting for the largest median family size of 3.31 persons per family. On the other hand, married-couple families (200 | 89.7%) represent the smallest median family size with 2.39 persons per family.
| Family Type | # Families | Family Size |
| Married-Couple | 200 (89.7%) | 2.39 |
| Single Male/Father | 13 (5.8%) | 3.31 |
| Single Female/Mother | 10 (4.5%) | 3.30 |
| Total Families | 223 (100.0%) | 2.48 |
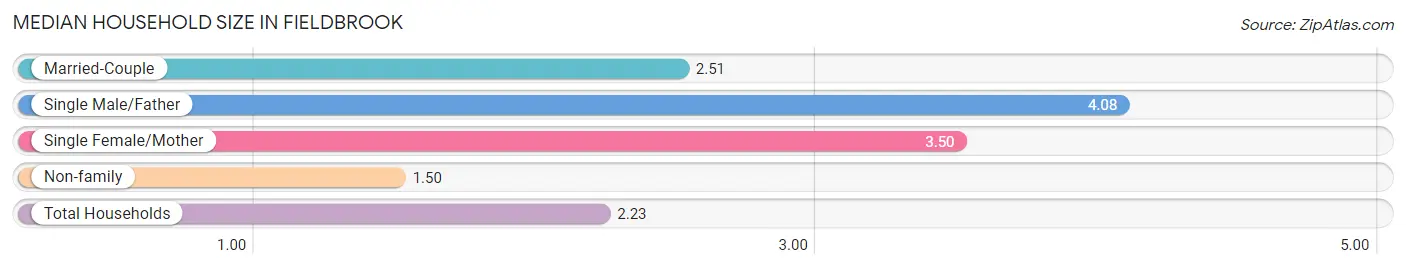
Median Household Size in Fieldbrook
The median household size in Fieldbrook is 2.23 persons per household, with single male/father households (13 | 3.7%) accounting for the largest median household size of 4.08 persons per household. non-family households (125 | 35.9%) represent the smallest median household size with 1.50 persons per household.
| Household Type | # Households | Household Size |
| Married-Couple | 200 (57.5%) | 2.51 |
| Single Male/Father | 13 (3.7%) | 4.08 |
| Single Female/Mother | 10 (2.9%) | 3.50 |
| Non-family | 125 (35.9%) | 1.50 |
| Total Households | 348 (100.0%) | 2.23 |
Household Size by Marriage Status in Fieldbrook
Out of a total of 348 households in Fieldbrook, 223 (64.1%) are family households, while 125 (35.9%) are nonfamily households. The most numerous type of family households are 2-person households, comprising 131, and the most common type of nonfamily households are 1-person households, comprising 93.
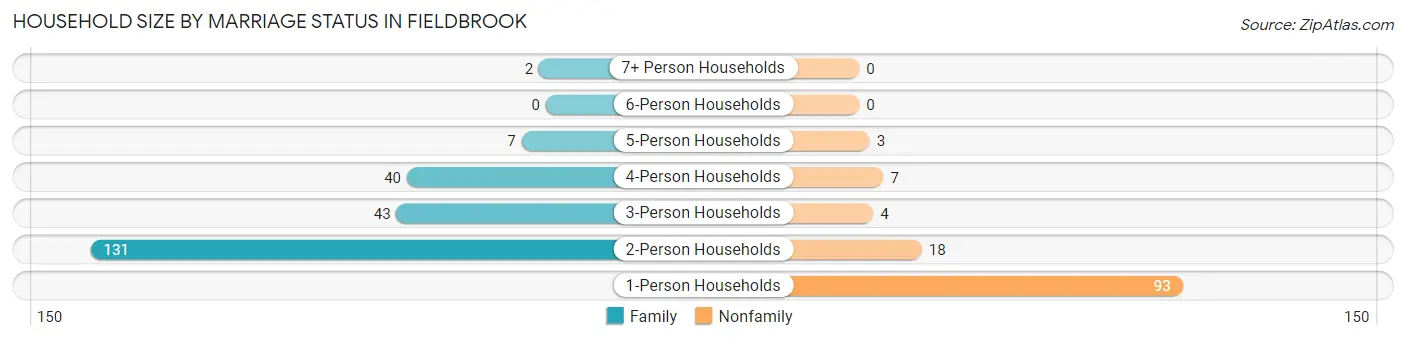
| Household Size | Family Households | Nonfamily Households |
| 1-Person Households | - | 93 (26.7%) |
| 2-Person Households | 131 (37.6%) | 18 (5.2%) |
| 3-Person Households | 43 (12.4%) | 4 (1.1%) |
| 4-Person Households | 40 (11.5%) | 7 (2.0%) |
| 5-Person Households | 7 (2.0%) | 3 (0.9%) |
| 6-Person Households | 0 (0.0%) | 0 (0.0%) |
| 7+ Person Households | 2 (0.6%) | 0 (0.0%) |
| Total | 223 (64.1%) | 125 (35.9%) |
Female Fertility in Fieldbrook
Fertility by Age in Fieldbrook
Average fertility rate in Fieldbrook is 185.0 births per 1,000 women. Women in the age bracket of 20 to 34 years have the highest fertility rate with 469.0 births per 1,000 women. Women in the age bracket of 20 to 34 years acount for 88.2% of all women with births.
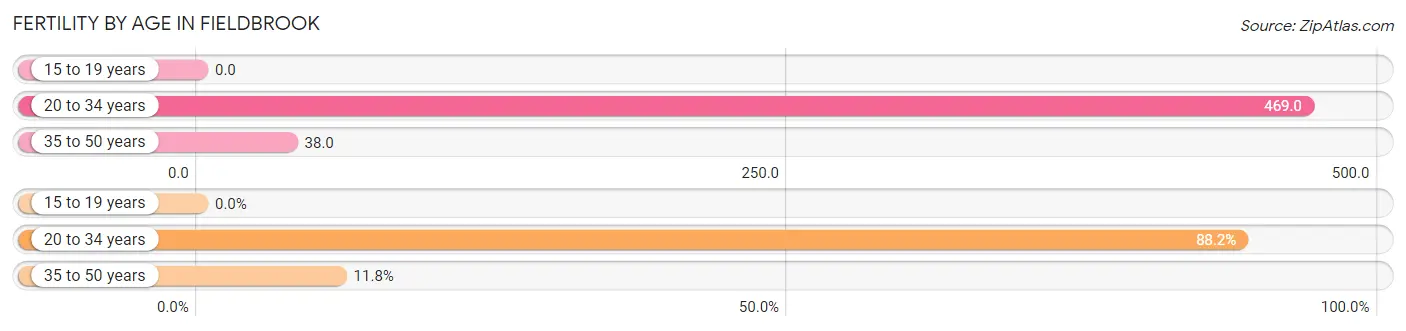
| Age Bracket | Women with Births | Births / 1,000 Women |
| 15 to 19 years | 0 (0.0%) | 0.0 |
| 20 to 34 years | 15 (88.2%) | 469.0 |
| 35 to 50 years | 2 (11.8%) | 38.0 |
| Total | 17 (100.0%) | 185.0 |
Fertility by Age by Marriage Status in Fieldbrook
52.9% of women with births (17) in Fieldbrook are married. The highest percentage of unmarried women with births falls into 35 to 50 years age bracket with 100.0% of them unmarried at the time of birth, while the lowest percentage of unmarried women with births belong to 20 to 34 years age bracket with 40.0% of them unmarried.
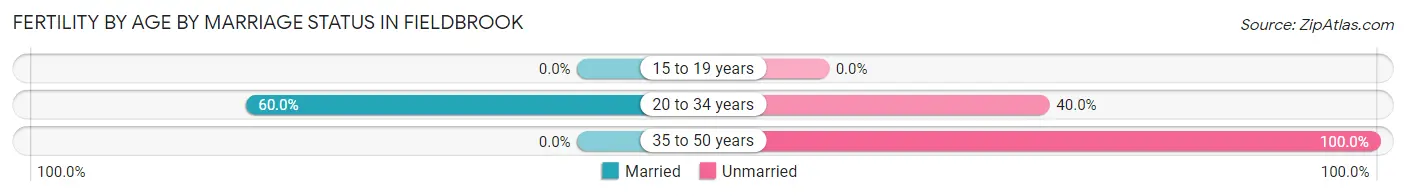
| Age Bracket | Married | Unmarried |
| 15 to 19 years | 0 (0.0%) | 0 (0.0%) |
| 20 to 34 years | 9 (60.0%) | 6 (40.0%) |
| 35 to 50 years | 0 (0.0%) | 2 (100.0%) |
| Total | 9 (52.9%) | 8 (47.1%) |
Fertility by Education in Fieldbrook
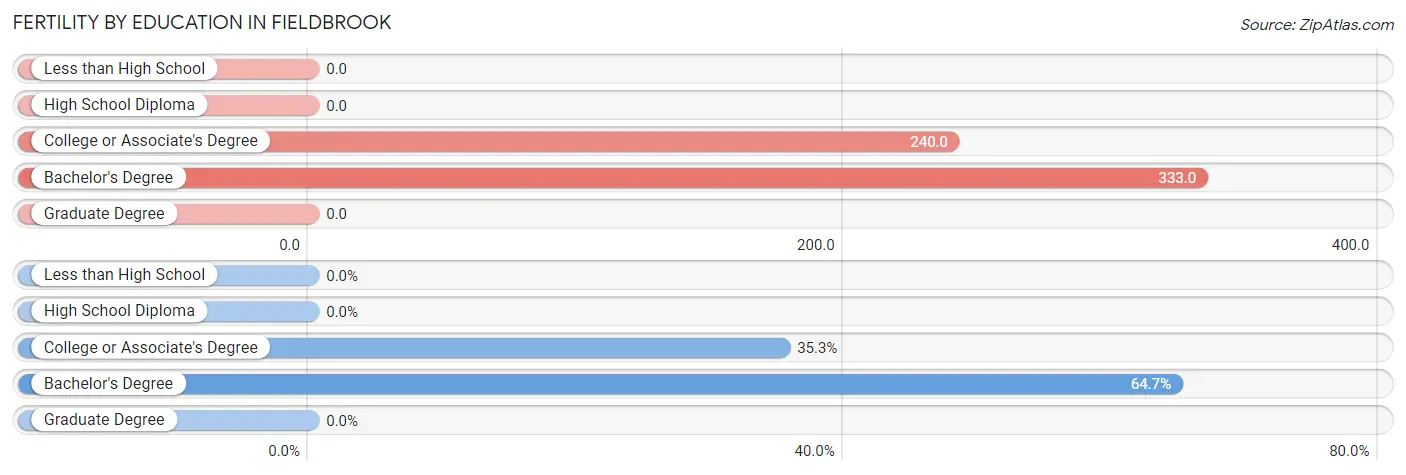
| Educational Attainment | Women with Births | Births / 1,000 Women |
| Less than High School | 0 (0.0%) | 0.0 |
| High School Diploma | 0 (0.0%) | 0.0 |
| College or Associate's Degree | 6 (35.3%) | 240.0 |
| Bachelor's Degree | 11 (64.7%) | 333.0 |
| Graduate Degree | 0 (0.0%) | 0.0 |
| Total | 17 (100.0%) | 185.0 |
Fertility by Education by Marriage Status in Fieldbrook
47.1% of women with births in Fieldbrook are unmarried. Women with the educational attainment of bachelor's degree are most likely to be married with 81.8% of them married at childbirth, while women with the educational attainment of college or associate's degree are least likely to be married with 100.0% of them unmarried at childbirth.
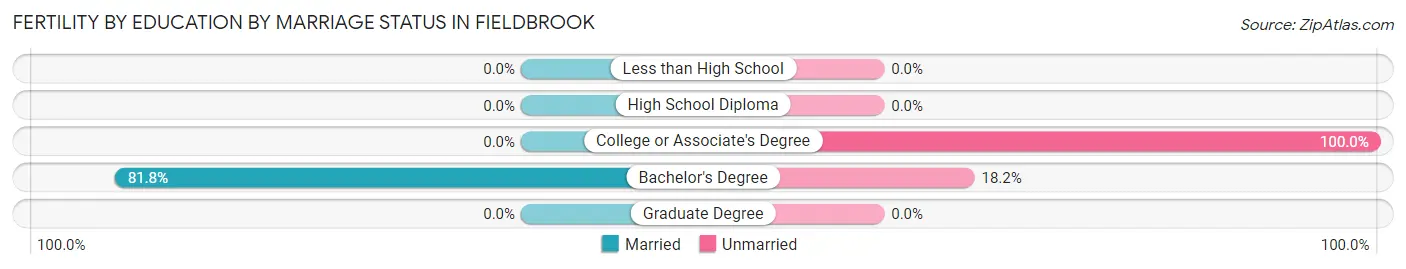
| Educational Attainment | Married | Unmarried |
| Less than High School | 0 (0.0%) | 0 (0.0%) |
| High School Diploma | 0 (0.0%) | 0 (0.0%) |
| College or Associate's Degree | 0 (0.0%) | 6 (100.0%) |
| Bachelor's Degree | 9 (81.8%) | 2 (18.2%) |
| Graduate Degree | 0 (0.0%) | 0 (0.0%) |
| Total | 9 (52.9%) | 8 (47.1%) |
Employment Characteristics in Fieldbrook
Employment by Class of Employer in Fieldbrook
Among the 340 employed individuals in Fieldbrook, private company employees (137 | 40.3%), self-employed (not incorporated) (103 | 30.3%), and self-employed (incorporated) (34 | 10.0%) make up the most common classes of employment.
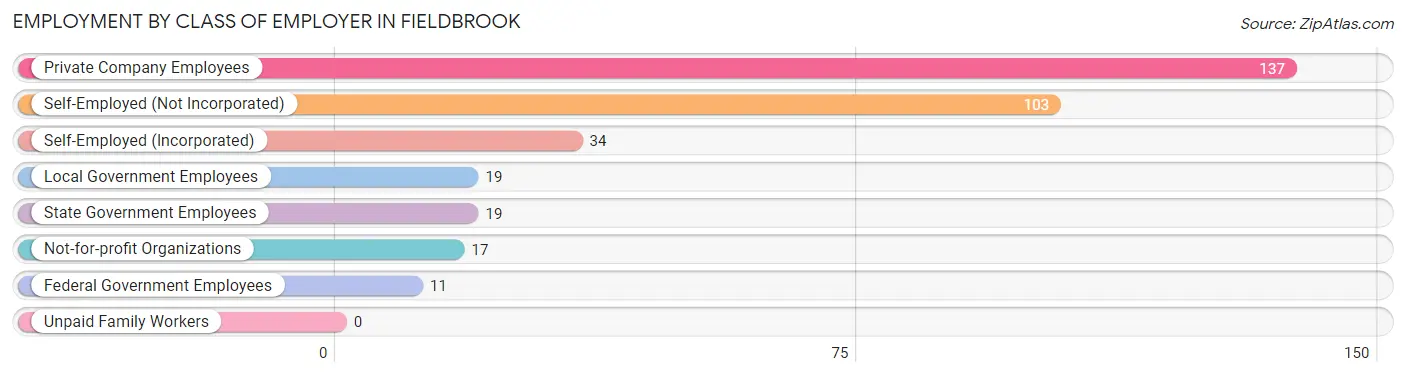
| Employer Class | # Employees | % Employees |
| Private Company Employees | 137 | 40.3% |
| Self-Employed (Incorporated) | 34 | 10.0% |
| Self-Employed (Not Incorporated) | 103 | 30.3% |
| Not-for-profit Organizations | 17 | 5.0% |
| Local Government Employees | 19 | 5.6% |
| State Government Employees | 19 | 5.6% |
| Federal Government Employees | 11 | 3.2% |
| Unpaid Family Workers | 0 | 0.0% |
| Total | 340 | 100.0% |
Employment Status by Age in Fieldbrook
According to the labor force statistics for Fieldbrook, out of the total population over 16 years of age (663), 58.1% or 385 individuals are in the labor force, with 5.2% or 20 of them unemployed. The age group with the highest labor force participation rate is 20 to 24 years, with 100.0% or 4 individuals in the labor force. Within the labor force, the 75 years and over age range has the highest percentage of unemployed individuals, with 25.0% or 2 of them being unemployed.
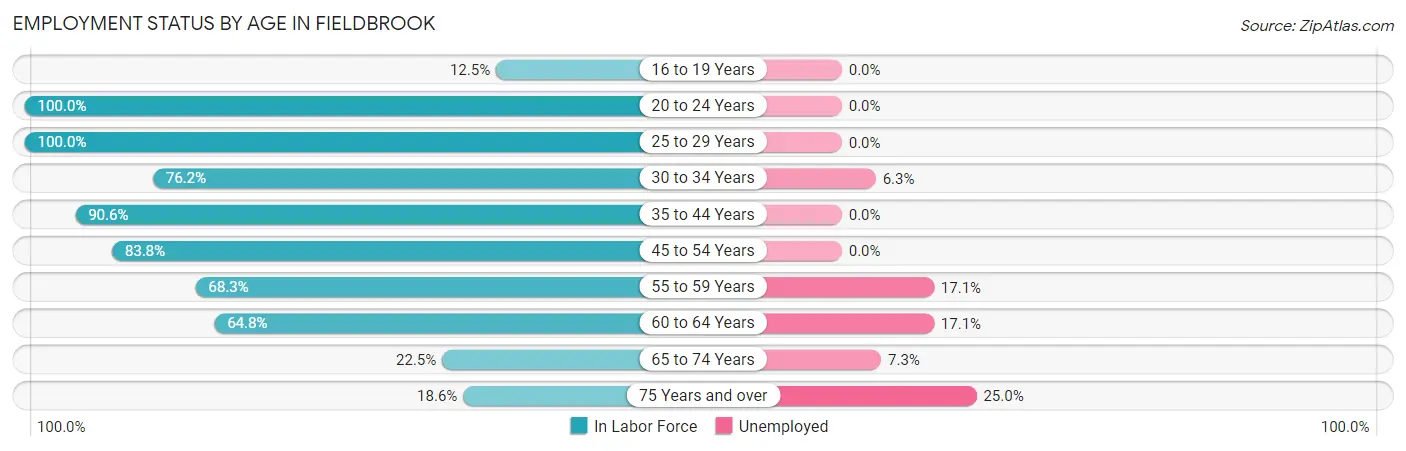
| Age Bracket | In Labor Force | Unemployed |
| 16 to 19 Years | 3 (12.5%) | 0 (0.0%) |
| 20 to 24 Years | 4 (100.0%) | 0 (0.0%) |
| 25 to 29 Years | 10 (100.0%) | 0 (0.0%) |
| 30 to 34 Years | 32 (76.2%) | 2 (6.3%) |
| 35 to 44 Years | 87 (90.6%) | 0 (0.0%) |
| 45 to 54 Years | 124 (83.8%) | 0 (0.0%) |
| 55 to 59 Years | 41 (68.3%) | 7 (17.1%) |
| 60 to 64 Years | 35 (64.8%) | 6 (17.1%) |
| 65 to 74 Years | 41 (22.5%) | 3 (7.3%) |
| 75 Years and over | 8 (18.6%) | 2 (25.0%) |
| Total | 385 (58.1%) | 20 (5.2%) |
Employment Status by Educational Attainment in Fieldbrook
According to labor force statistics for Fieldbrook, 80.2% of individuals (329) out of the total population between 25 and 64 years of age (410) are in the labor force, with 4.6% or 15 of them being unemployed. The group with the highest labor force participation rate are those with the educational attainment of bachelor's degree or higher, with 88.8% or 174 individuals in the labor force. Within the labor force, individuals with college / associate degree education have the highest percentage of unemployment, with 9.7% or 10 of them being unemployed.
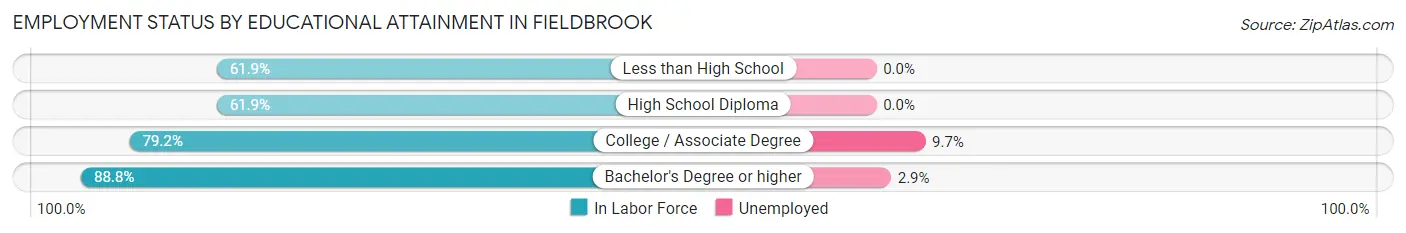
| Educational Attainment | In Labor Force | Unemployed |
| Less than High School | 26 (61.9%) | 0 (0.0%) |
| High School Diploma | 26 (61.9%) | 0 (0.0%) |
| College / Associate Degree | 103 (79.2%) | 13 (9.7%) |
| Bachelor's Degree or higher | 174 (88.8%) | 6 (2.9%) |
| Total | 329 (80.2%) | 19 (4.6%) |
Employment Occupations by Sex in Fieldbrook
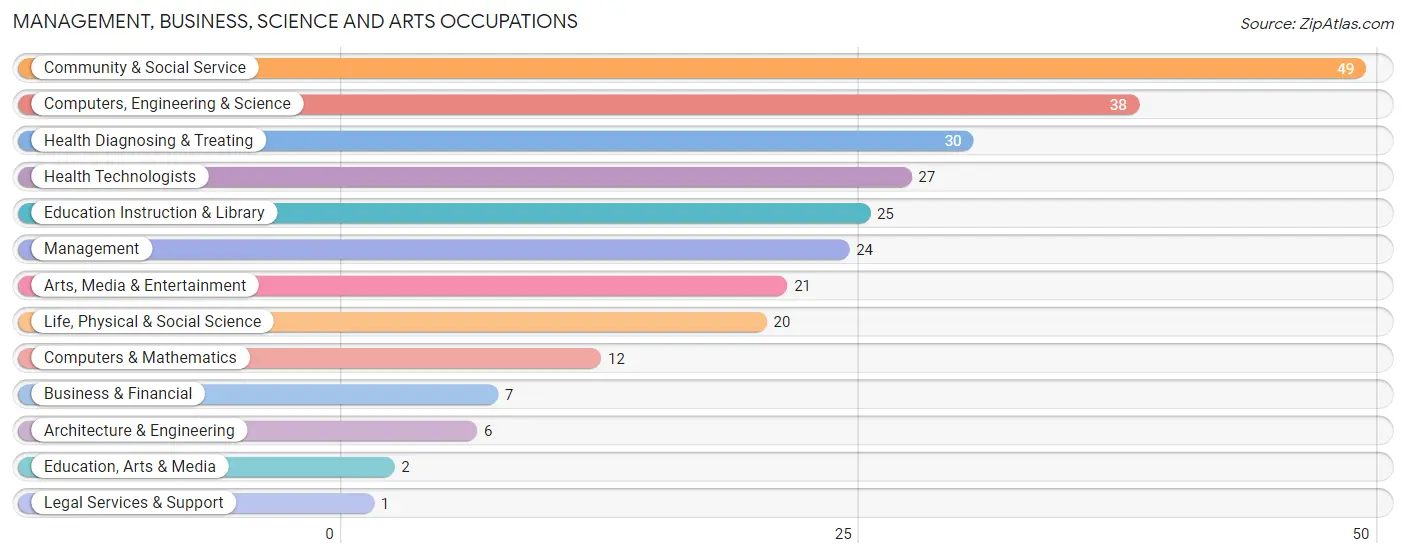
Management, Business, Science and Arts Occupations
The most common Management, Business, Science and Arts occupations in Fieldbrook are Community & Social Service (49 | 13.4%), Computers, Engineering & Science (38 | 10.4%), Health Diagnosing & Treating (30 | 8.2%), Health Technologists (27 | 7.4%), and Education Instruction & Library (25 | 6.9%).
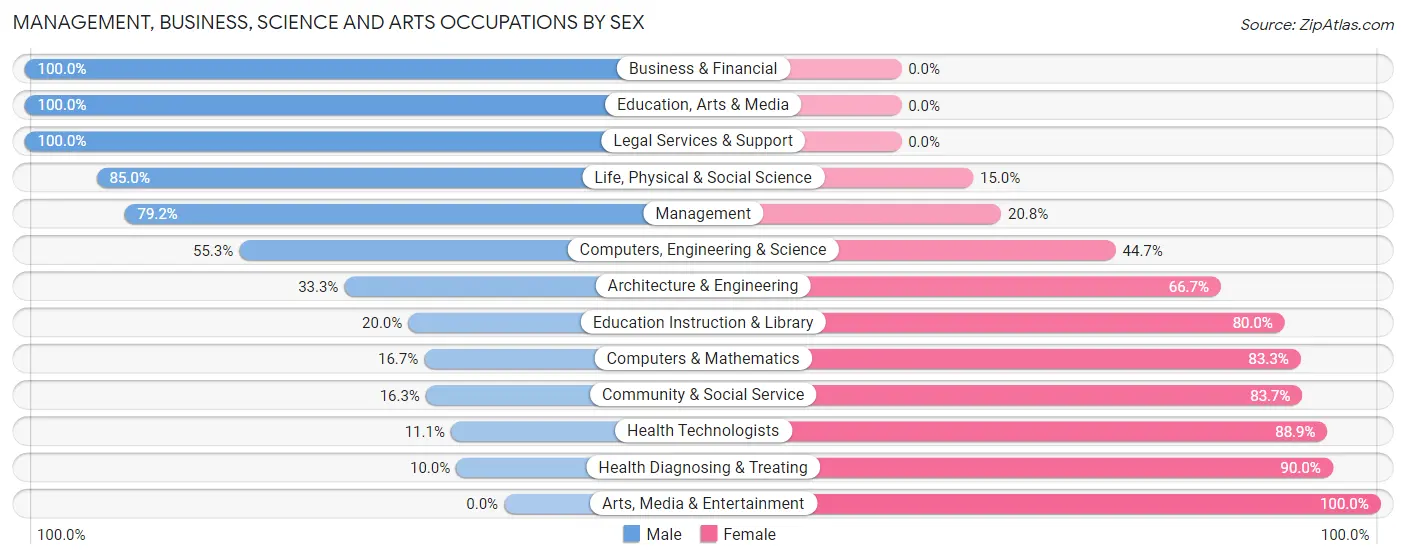
Management, Business, Science and Arts Occupations by Sex
Within the Management, Business, Science and Arts occupations in Fieldbrook, the most male-oriented occupations are Business & Financial (100.0%), Education, Arts & Media (100.0%), and Legal Services & Support (100.0%), while the most female-oriented occupations are Arts, Media & Entertainment (100.0%), Health Diagnosing & Treating (90.0%), and Health Technologists (88.9%).
| Occupation | Male | Female |
| Management | 19 (79.2%) | 5 (20.8%) |
| Business & Financial | 7 (100.0%) | 0 (0.0%) |
| Computers, Engineering & Science | 21 (55.3%) | 17 (44.7%) |
| Computers & Mathematics | 2 (16.7%) | 10 (83.3%) |
| Architecture & Engineering | 2 (33.3%) | 4 (66.7%) |
| Life, Physical & Social Science | 17 (85.0%) | 3 (15.0%) |
| Community & Social Service | 8 (16.3%) | 41 (83.7%) |
| Education, Arts & Media | 2 (100.0%) | 0 (0.0%) |
| Legal Services & Support | 1 (100.0%) | 0 (0.0%) |
| Education Instruction & Library | 5 (20.0%) | 20 (80.0%) |
| Arts, Media & Entertainment | 0 (0.0%) | 21 (100.0%) |
| Health Diagnosing & Treating | 3 (10.0%) | 27 (90.0%) |
| Health Technologists | 3 (11.1%) | 24 (88.9%) |
| Total (Category) | 58 (39.2%) | 90 (60.8%) |
| Total (Overall) | 206 (56.4%) | 159 (43.6%) |
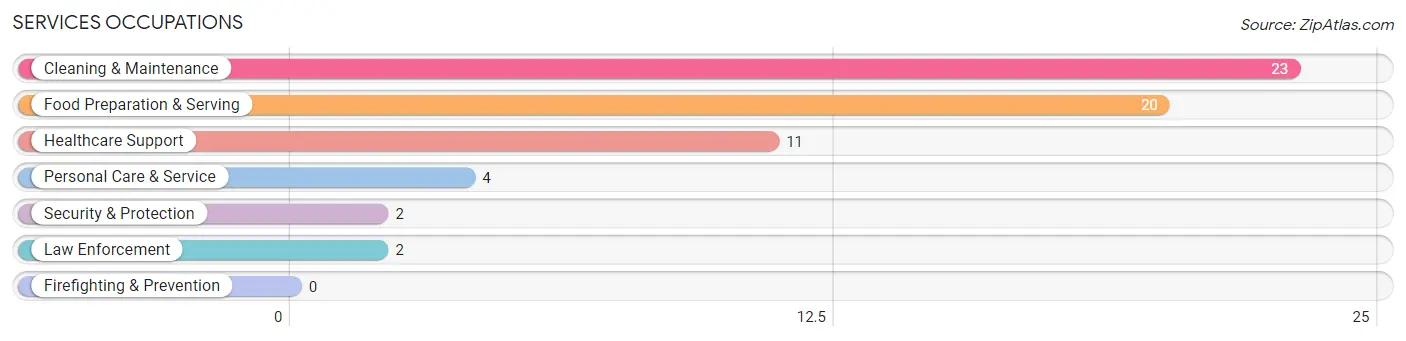
Services Occupations
The most common Services occupations in Fieldbrook are Cleaning & Maintenance (23 | 6.3%), Food Preparation & Serving (20 | 5.5%), Healthcare Support (11 | 3.0%), Personal Care & Service (4 | 1.1%), and Security & Protection (2 | 0.5%).
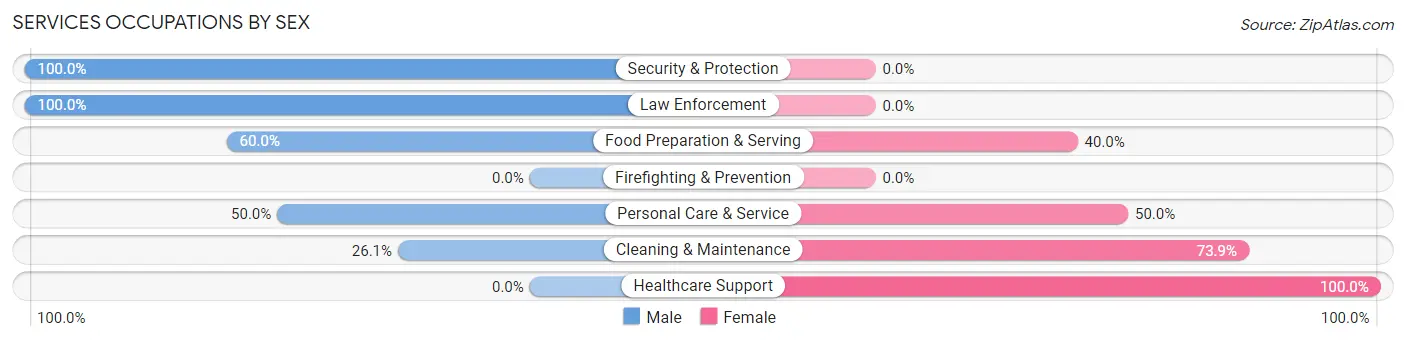
Services Occupations by Sex
Within the Services occupations in Fieldbrook, the most male-oriented occupations are Security & Protection (100.0%), Law Enforcement (100.0%), and Food Preparation & Serving (60.0%), while the most female-oriented occupations are Healthcare Support (100.0%), Cleaning & Maintenance (73.9%), and Personal Care & Service (50.0%).
| Occupation | Male | Female |
| Healthcare Support | 0 (0.0%) | 11 (100.0%) |
| Security & Protection | 2 (100.0%) | 0 (0.0%) |
| Firefighting & Prevention | 0 (0.0%) | 0 (0.0%) |
| Law Enforcement | 2 (100.0%) | 0 (0.0%) |
| Food Preparation & Serving | 12 (60.0%) | 8 (40.0%) |
| Cleaning & Maintenance | 6 (26.1%) | 17 (73.9%) |
| Personal Care & Service | 2 (50.0%) | 2 (50.0%) |
| Total (Category) | 22 (36.7%) | 38 (63.3%) |
| Total (Overall) | 206 (56.4%) | 159 (43.6%) |
Sales and Office Occupations
The most common Sales and Office occupations in Fieldbrook are Office & Administration (28 | 7.7%), and Sales & Related (14 | 3.8%).
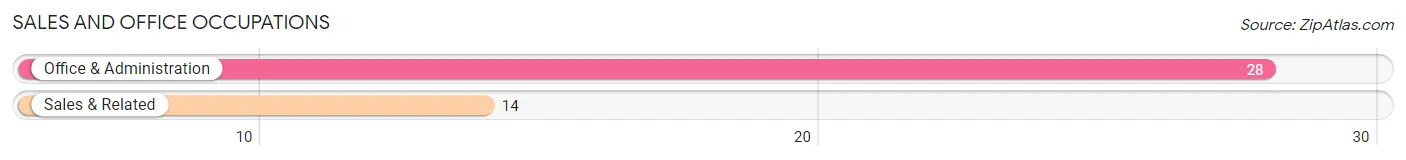
Sales and Office Occupations by Sex

| Occupation | Male | Female |
| Sales & Related | 8 (57.1%) | 6 (42.9%) |
| Office & Administration | 4 (14.3%) | 24 (85.7%) |
| Total (Category) | 12 (28.6%) | 30 (71.4%) |
| Total (Overall) | 206 (56.4%) | 159 (43.6%) |
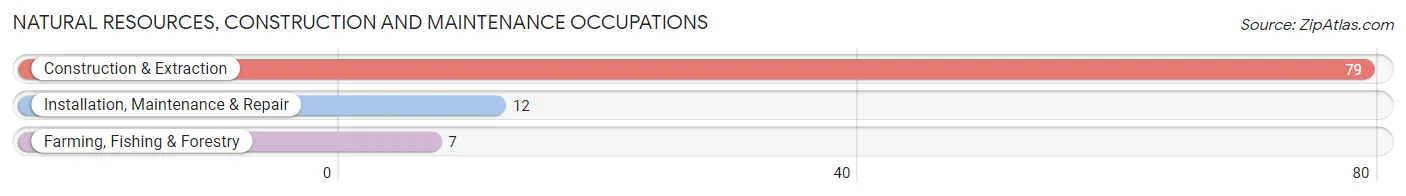
Natural Resources, Construction and Maintenance Occupations
The most common Natural Resources, Construction and Maintenance occupations in Fieldbrook are Construction & Extraction (79 | 21.6%), Installation, Maintenance & Repair (12 | 3.3%), and Farming, Fishing & Forestry (7 | 1.9%).
Natural Resources, Construction and Maintenance Occupations by Sex
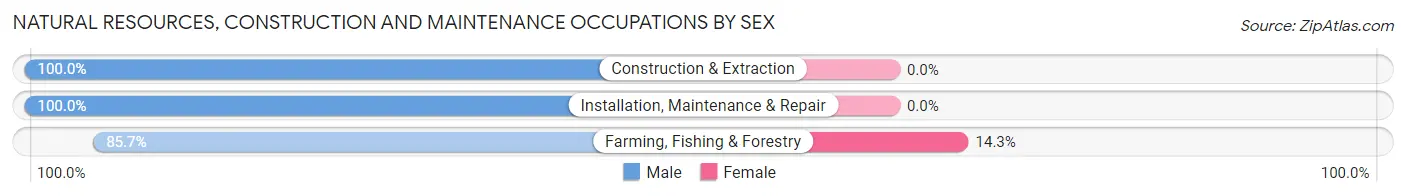
| Occupation | Male | Female |
| Farming, Fishing & Forestry | 6 (85.7%) | 1 (14.3%) |
| Construction & Extraction | 79 (100.0%) | 0 (0.0%) |
| Installation, Maintenance & Repair | 12 (100.0%) | 0 (0.0%) |
| Total (Category) | 97 (99.0%) | 1 (1.0%) |
| Total (Overall) | 206 (56.4%) | 159 (43.6%) |
Production, Transportation and Moving Occupations
The most common Production, Transportation and Moving occupations in Fieldbrook are Material Moving (14 | 3.8%), and Transportation (3 | 0.8%).
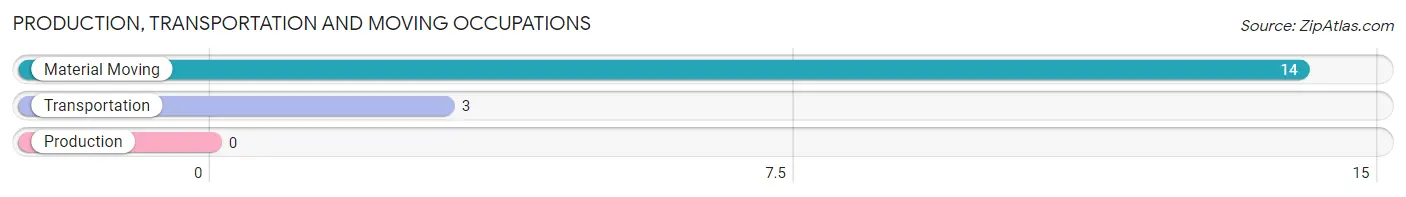
Production, Transportation and Moving Occupations by Sex
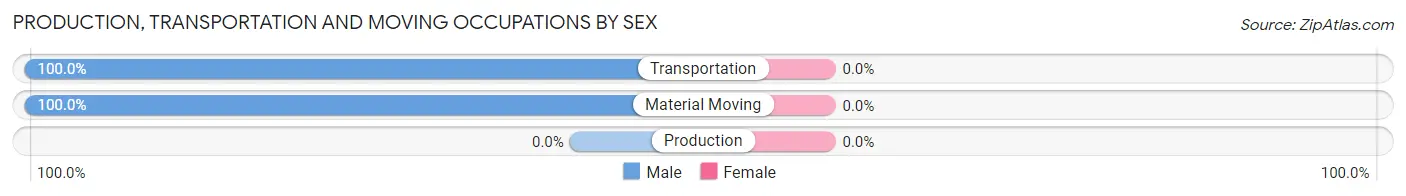
| Occupation | Male | Female |
| Production | 0 (0.0%) | 0 (0.0%) |
| Transportation | 3 (100.0%) | 0 (0.0%) |
| Material Moving | 14 (100.0%) | 0 (0.0%) |
| Total (Category) | 17 (100.0%) | 0 (0.0%) |
| Total (Overall) | 206 (56.4%) | 159 (43.6%) |
Employment Industries by Sex in Fieldbrook
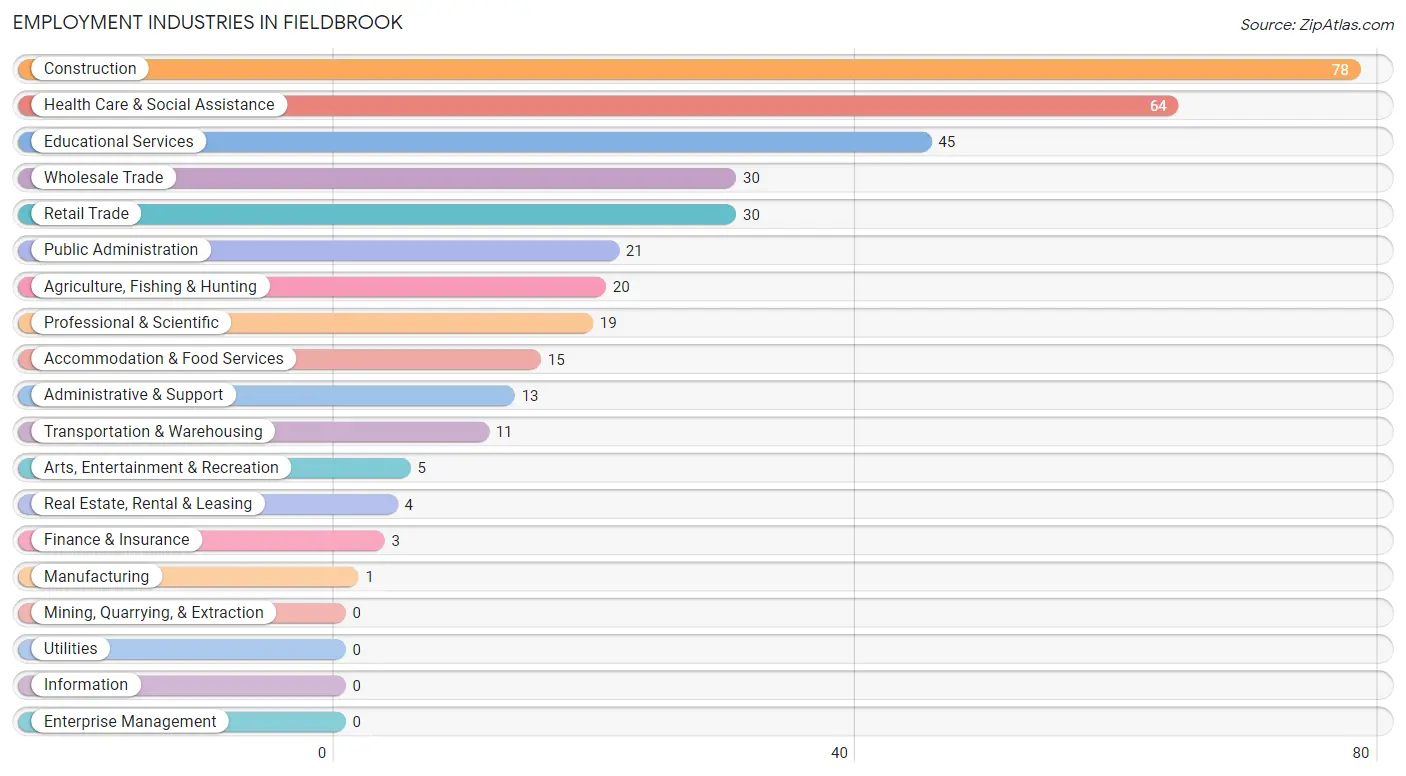
Employment Industries in Fieldbrook
The major employment industries in Fieldbrook include Construction (78 | 21.4%), Health Care & Social Assistance (64 | 17.5%), Educational Services (45 | 12.3%), Wholesale Trade (30 | 8.2%), and Retail Trade (30 | 8.2%).
Employment Industries by Sex in Fieldbrook
The Fieldbrook industries that see more men than women are Manufacturing (100.0%), Transportation & Warehousing (100.0%), and Finance & Insurance (100.0%), whereas the industries that tend to have a higher number of women are Health Care & Social Assistance (92.2%), Educational Services (88.9%), and Retail Trade (70.0%).
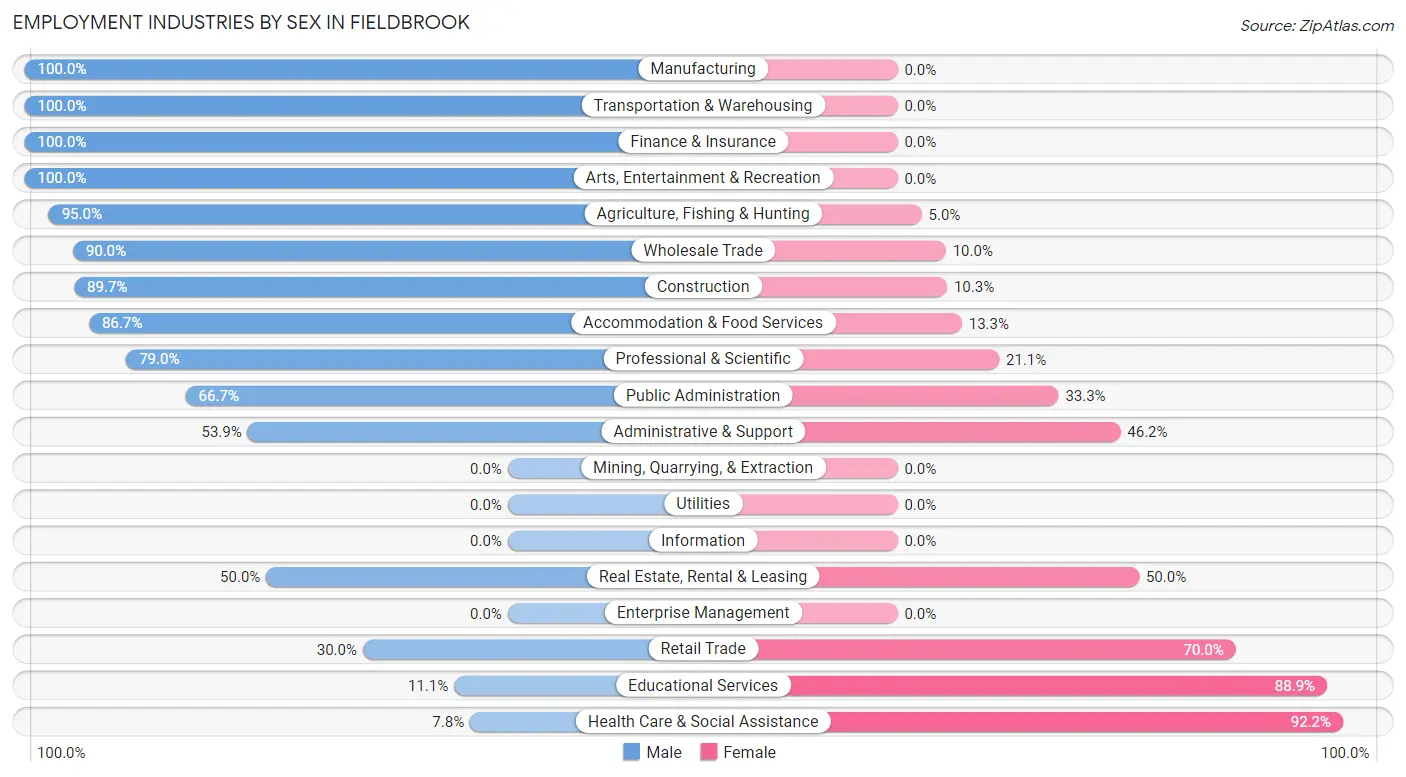
| Industry | Male | Female |
| Agriculture, Fishing & Hunting | 19 (95.0%) | 1 (5.0%) |
| Mining, Quarrying, & Extraction | 0 (0.0%) | 0 (0.0%) |
| Construction | 70 (89.7%) | 8 (10.3%) |
| Manufacturing | 1 (100.0%) | 0 (0.0%) |
| Wholesale Trade | 27 (90.0%) | 3 (10.0%) |
| Retail Trade | 9 (30.0%) | 21 (70.0%) |
| Transportation & Warehousing | 11 (100.0%) | 0 (0.0%) |
| Utilities | 0 (0.0%) | 0 (0.0%) |
| Information | 0 (0.0%) | 0 (0.0%) |
| Finance & Insurance | 3 (100.0%) | 0 (0.0%) |
| Real Estate, Rental & Leasing | 2 (50.0%) | 2 (50.0%) |
| Professional & Scientific | 15 (78.9%) | 4 (21.0%) |
| Enterprise Management | 0 (0.0%) | 0 (0.0%) |
| Administrative & Support | 7 (53.8%) | 6 (46.2%) |
| Educational Services | 5 (11.1%) | 40 (88.9%) |
| Health Care & Social Assistance | 5 (7.8%) | 59 (92.2%) |
| Arts, Entertainment & Recreation | 5 (100.0%) | 0 (0.0%) |
| Accommodation & Food Services | 13 (86.7%) | 2 (13.3%) |
| Public Administration | 14 (66.7%) | 7 (33.3%) |
| Total | 206 (56.4%) | 159 (43.6%) |
Education in Fieldbrook
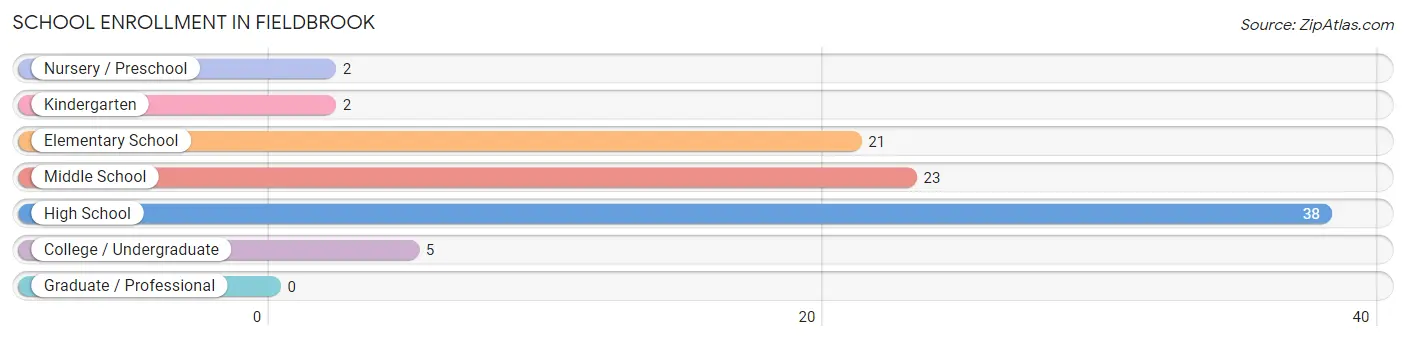
School Enrollment in Fieldbrook
The most common levels of schooling among the 91 students in Fieldbrook are high school (38 | 41.8%), middle school (23 | 25.3%), and elementary school (21 | 23.1%).
| School Level | # Students | % Students |
| Nursery / Preschool | 2 | 2.2% |
| Kindergarten | 2 | 2.2% |
| Elementary School | 21 | 23.1% |
| Middle School | 23 | 25.3% |
| High School | 38 | 41.8% |
| College / Undergraduate | 5 | 5.5% |
| Graduate / Professional | 0 | 0.0% |
| Total | 91 | 100.0% |
School Enrollment by Age by Funding Source in Fieldbrook
Out of a total of 91 students who are enrolled in schools in Fieldbrook, 3 (3.3%) attend a private institution, while the remaining 88 (96.7%) are enrolled in public schools. The age group of 18 to 19 year olds has the highest likelihood of being enrolled in private schools, with 3 (100.0% in the age bracket) enrolled. Conversely, the age group of 5 to 9 year old has the lowest likelihood of being enrolled in a private school, with 25 (100.0% in the age bracket) attending a public institution.
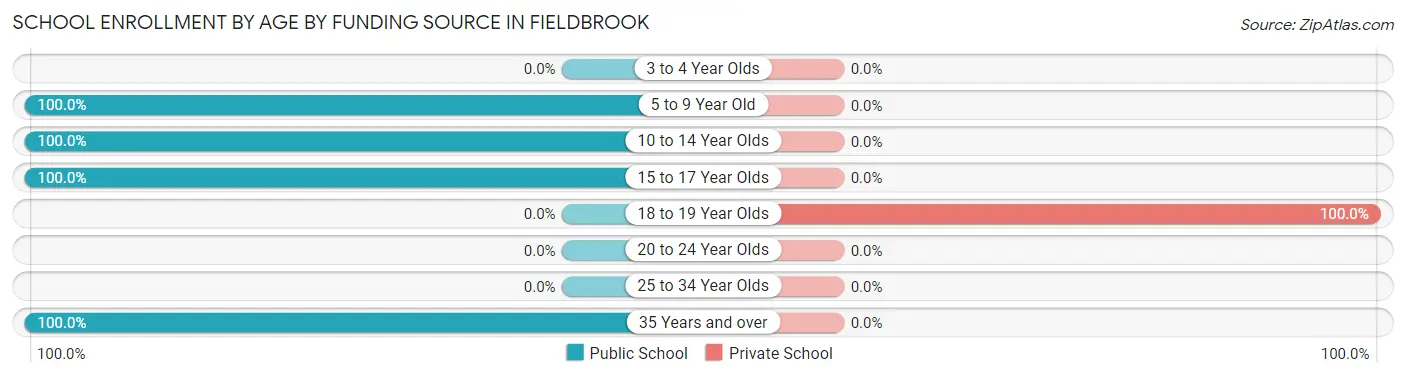
| Age Bracket | Public School | Private School |
| 3 to 4 Year Olds | 0 (0.0%) | 0 (0.0%) |
| 5 to 9 Year Old | 25 (100.0%) | 0 (0.0%) |
| 10 to 14 Year Olds | 37 (100.0%) | 0 (0.0%) |
| 15 to 17 Year Olds | 24 (100.0%) | 0 (0.0%) |
| 18 to 19 Year Olds | 0 (0.0%) | 3 (100.0%) |
| 20 to 24 Year Olds | 0 (0.0%) | 0 (0.0%) |
| 25 to 34 Year Olds | 0 (0.0%) | 0 (0.0%) |
| 35 Years and over | 2 (100.0%) | 0 (0.0%) |
| Total | 88 (96.7%) | 3 (3.3%) |
Educational Attainment by Field of Study in Fieldbrook
Bio, nature & agricultural (84 | 24.1%), social sciences (42 | 12.1%), visual & performing arts (38 | 10.9%), arts & humanities (25 | 7.2%), and science & technology (23 | 6.6%) are the most common fields of study among 348 individuals in Fieldbrook who have obtained a bachelor's degree or higher.
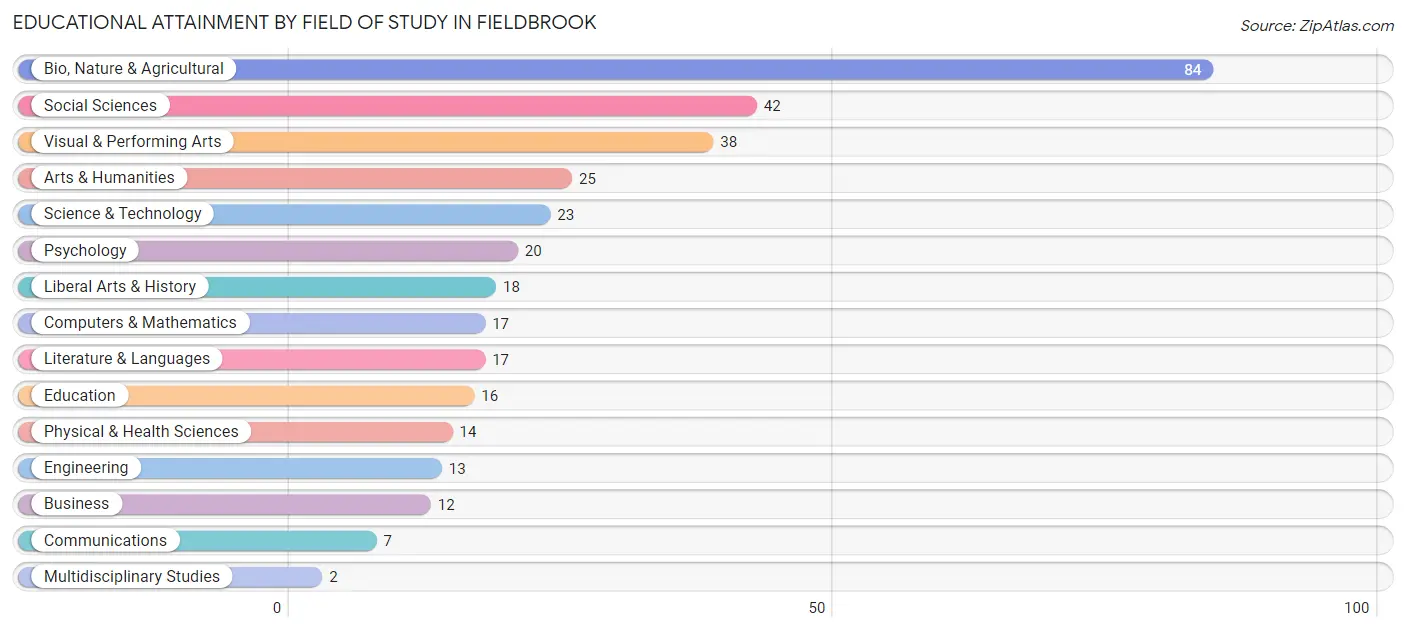
| Field of Study | # Graduates | % Graduates |
| Computers & Mathematics | 17 | 4.9% |
| Bio, Nature & Agricultural | 84 | 24.1% |
| Physical & Health Sciences | 14 | 4.0% |
| Psychology | 20 | 5.8% |
| Social Sciences | 42 | 12.1% |
| Engineering | 13 | 3.7% |
| Multidisciplinary Studies | 2 | 0.6% |
| Science & Technology | 23 | 6.6% |
| Business | 12 | 3.5% |
| Education | 16 | 4.6% |
| Literature & Languages | 17 | 4.9% |
| Liberal Arts & History | 18 | 5.2% |
| Visual & Performing Arts | 38 | 10.9% |
| Communications | 7 | 2.0% |
| Arts & Humanities | 25 | 7.2% |
| Total | 348 | 100.0% |
Transportation & Commute in Fieldbrook
Vehicle Availability by Sex in Fieldbrook
The most prevalent vehicle ownership categories in Fieldbrook are males with 2 vehicles (89, accounting for 45.2%) and females with 2 vehicles (65, making up 62.2%).
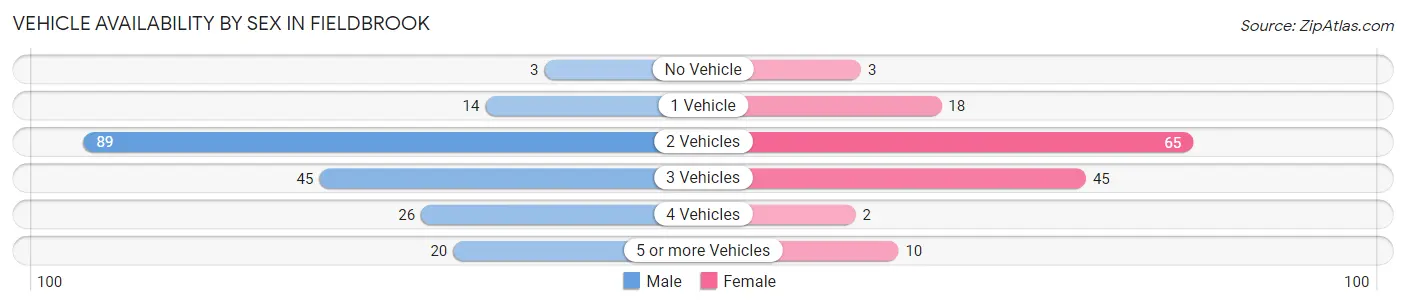
| Vehicles Available | Male | Female |
| No Vehicle | 3 (1.5%) | 3 (2.1%) |
| 1 Vehicle | 14 (7.1%) | 18 (12.6%) |
| 2 Vehicles | 89 (45.2%) | 65 (45.5%) |
| 3 Vehicles | 45 (22.8%) | 45 (31.5%) |
| 4 Vehicles | 26 (13.2%) | 2 (1.4%) |
| 5 or more Vehicles | 20 (10.2%) | 10 (7.0%) |
| Total | 197 (100.0%) | 143 (100.0%) |
Commute Time in Fieldbrook
The most frequently occuring commute durations in Fieldbrook are 20 to 24 minutes (92 commuters, 34.3%), 30 to 34 minutes (52 commuters, 19.4%), and 15 to 19 minutes (49 commuters, 18.3%).
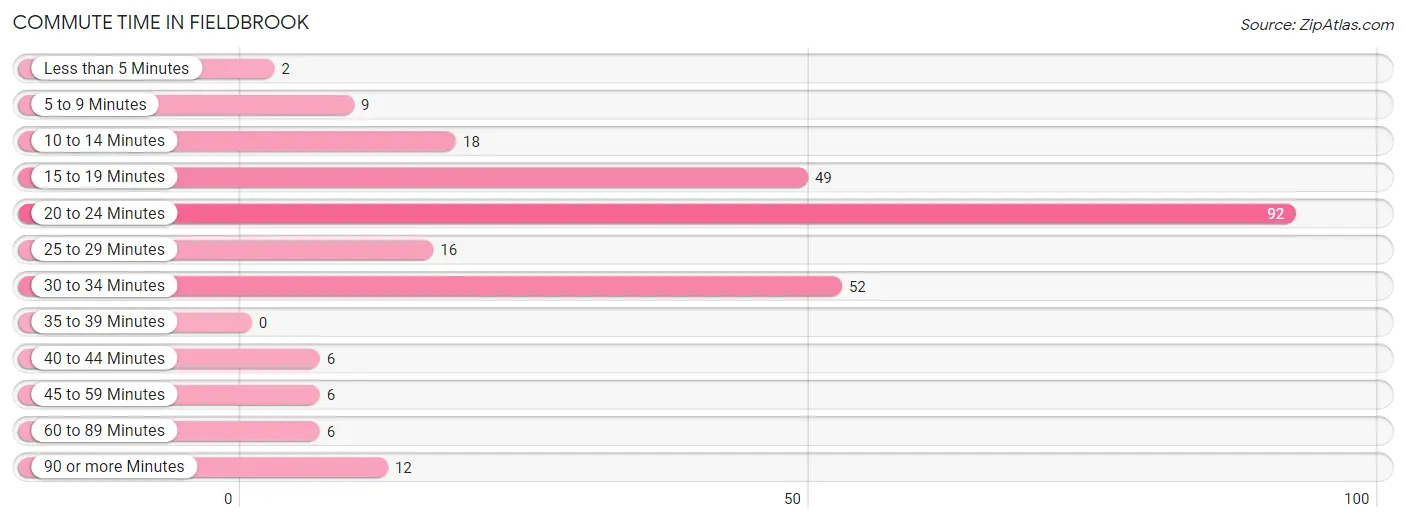
| Commute Time | # Commuters | % Commuters |
| Less than 5 Minutes | 2 | 0.7% |
| 5 to 9 Minutes | 9 | 3.4% |
| 10 to 14 Minutes | 18 | 6.7% |
| 15 to 19 Minutes | 49 | 18.3% |
| 20 to 24 Minutes | 92 | 34.3% |
| 25 to 29 Minutes | 16 | 6.0% |
| 30 to 34 Minutes | 52 | 19.4% |
| 35 to 39 Minutes | 0 | 0.0% |
| 40 to 44 Minutes | 6 | 2.2% |
| 45 to 59 Minutes | 6 | 2.2% |
| 60 to 89 Minutes | 6 | 2.2% |
| 90 or more Minutes | 12 | 4.5% |
Commute Time by Sex in Fieldbrook
The most common commute times in Fieldbrook are 15 to 19 minutes (46 commuters, 24.9%) for males and 20 to 24 minutes (47 commuters, 56.6%) for females.
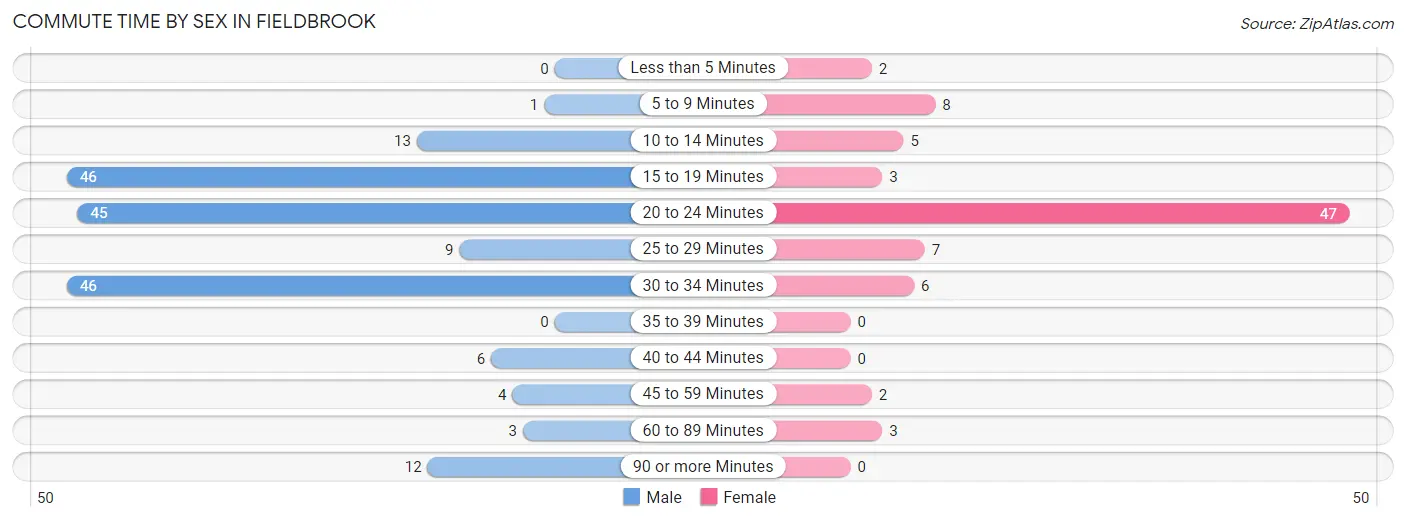
| Commute Time | Male | Female |
| Less than 5 Minutes | 0 (0.0%) | 2 (2.4%) |
| 5 to 9 Minutes | 1 (0.5%) | 8 (9.6%) |
| 10 to 14 Minutes | 13 (7.0%) | 5 (6.0%) |
| 15 to 19 Minutes | 46 (24.9%) | 3 (3.6%) |
| 20 to 24 Minutes | 45 (24.3%) | 47 (56.6%) |
| 25 to 29 Minutes | 9 (4.9%) | 7 (8.4%) |
| 30 to 34 Minutes | 46 (24.9%) | 6 (7.2%) |
| 35 to 39 Minutes | 0 (0.0%) | 0 (0.0%) |
| 40 to 44 Minutes | 6 (3.2%) | 0 (0.0%) |
| 45 to 59 Minutes | 4 (2.2%) | 2 (2.4%) |
| 60 to 89 Minutes | 3 (1.6%) | 3 (3.6%) |
| 90 or more Minutes | 12 (6.5%) | 0 (0.0%) |
Time of Departure to Work by Sex in Fieldbrook
The most frequent times of departure to work in Fieldbrook are 9:00 AM to 9:59 AM (57, 30.8%) for males and 8:00 AM to 8:29 AM (32, 38.6%) for females.
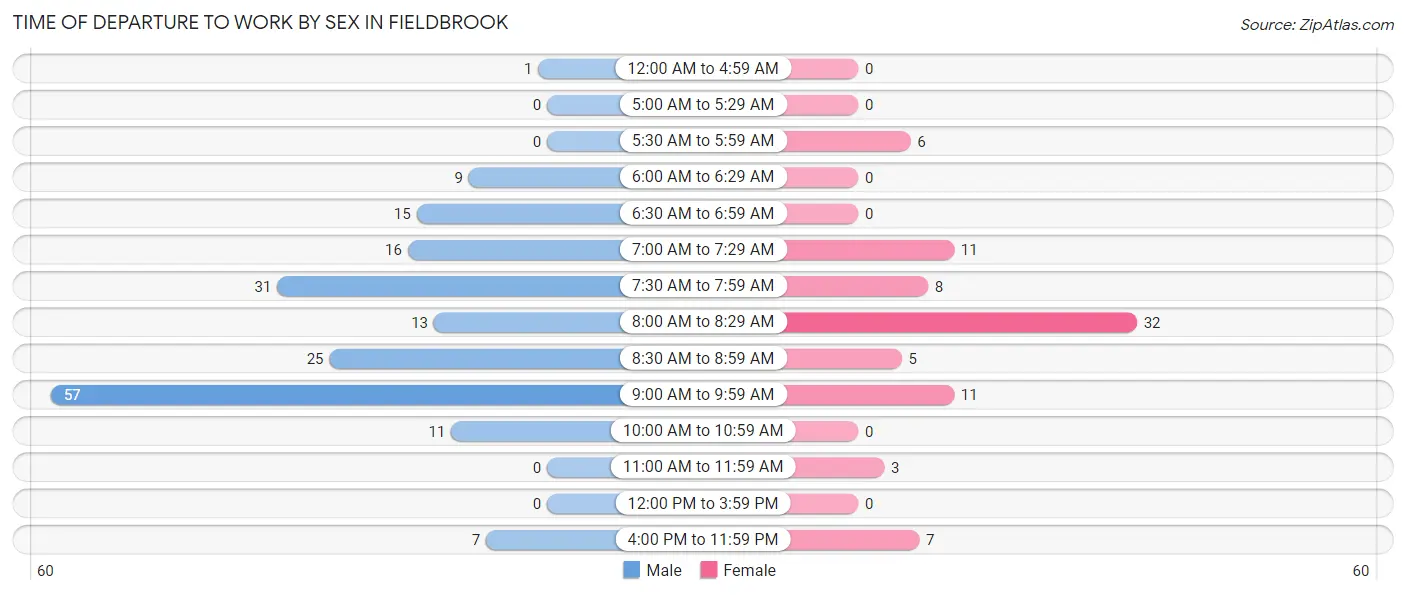
| Time of Departure | Male | Female |
| 12:00 AM to 4:59 AM | 1 (0.5%) | 0 (0.0%) |
| 5:00 AM to 5:29 AM | 0 (0.0%) | 0 (0.0%) |
| 5:30 AM to 5:59 AM | 0 (0.0%) | 6 (7.2%) |
| 6:00 AM to 6:29 AM | 9 (4.9%) | 0 (0.0%) |
| 6:30 AM to 6:59 AM | 15 (8.1%) | 0 (0.0%) |
| 7:00 AM to 7:29 AM | 16 (8.6%) | 11 (13.3%) |
| 7:30 AM to 7:59 AM | 31 (16.8%) | 8 (9.6%) |
| 8:00 AM to 8:29 AM | 13 (7.0%) | 32 (38.6%) |
| 8:30 AM to 8:59 AM | 25 (13.5%) | 5 (6.0%) |
| 9:00 AM to 9:59 AM | 57 (30.8%) | 11 (13.3%) |
| 10:00 AM to 10:59 AM | 11 (5.9%) | 0 (0.0%) |
| 11:00 AM to 11:59 AM | 0 (0.0%) | 3 (3.6%) |
| 12:00 PM to 3:59 PM | 0 (0.0%) | 0 (0.0%) |
| 4:00 PM to 11:59 PM | 7 (3.8%) | 7 (8.4%) |
| Total | 185 (100.0%) | 83 (100.0%) |
Housing Occupancy in Fieldbrook
Occupancy by Ownership in Fieldbrook
Of the total 348 dwellings in Fieldbrook, owner-occupied units account for 306 (87.9%), while renter-occupied units make up 42 (12.1%).
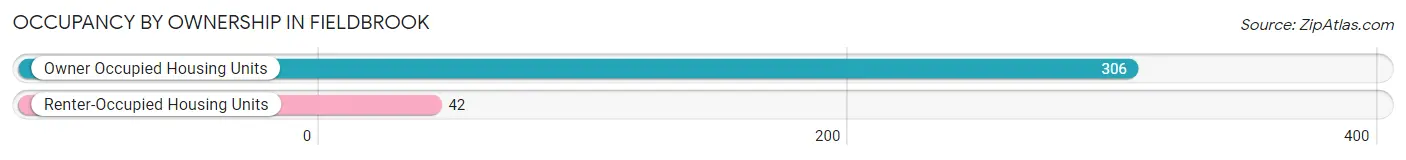
| Occupancy | # Housing Units | % Housing Units |
| Owner Occupied Housing Units | 306 | 87.9% |
| Renter-Occupied Housing Units | 42 | 12.1% |
| Total Occupied Housing Units | 348 | 100.0% |
Occupancy by Household Size in Fieldbrook
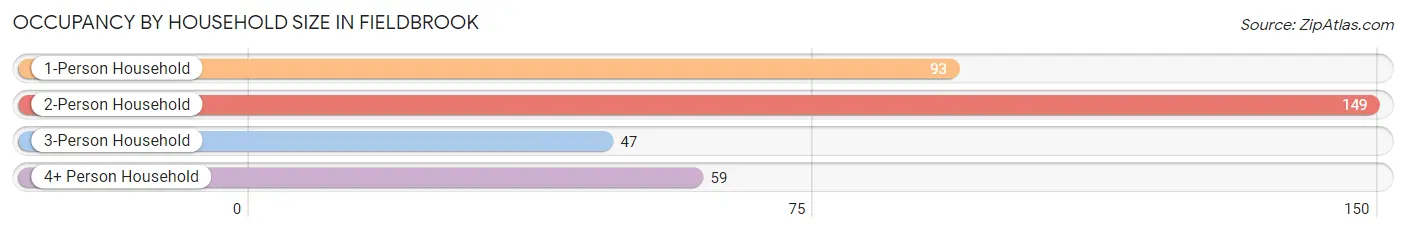
| Household Size | # Housing Units | % Housing Units |
| 1-Person Household | 93 | 26.7% |
| 2-Person Household | 149 | 42.8% |
| 3-Person Household | 47 | 13.5% |
| 4+ Person Household | 59 | 17.0% |
| Total Housing Units | 348 | 100.0% |
Occupancy by Ownership by Household Size in Fieldbrook
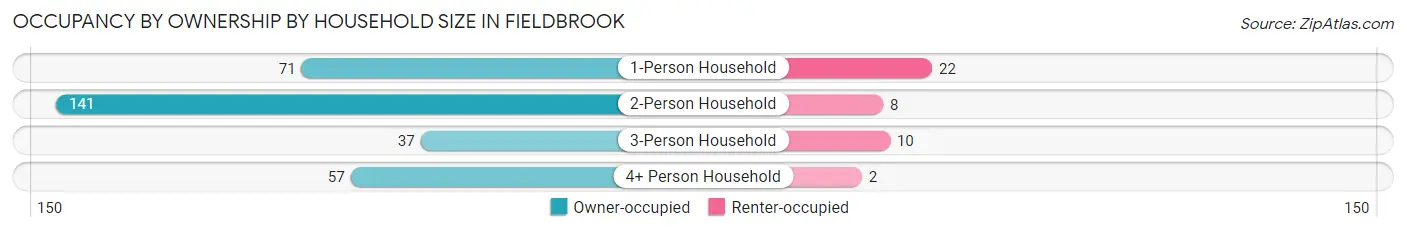
| Household Size | Owner-occupied | Renter-occupied |
| 1-Person Household | 71 (76.3%) | 22 (23.7%) |
| 2-Person Household | 141 (94.6%) | 8 (5.4%) |
| 3-Person Household | 37 (78.7%) | 10 (21.3%) |
| 4+ Person Household | 57 (96.6%) | 2 (3.4%) |
| Total Housing Units | 306 (87.9%) | 42 (12.1%) |
Occupancy by Educational Attainment in Fieldbrook
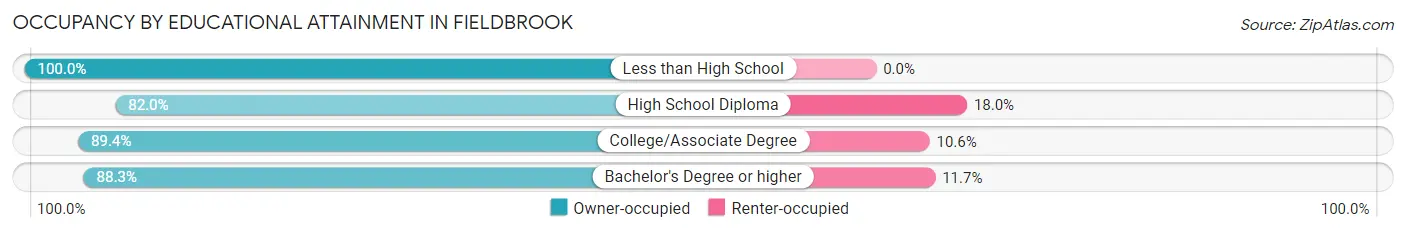
| Household Size | Owner-occupied | Renter-occupied |
| Less than High School | 8 (100.0%) | 0 (0.0%) |
| High School Diploma | 41 (82.0%) | 9 (18.0%) |
| College/Associate Degree | 76 (89.4%) | 9 (10.6%) |
| Bachelor's Degree or higher | 181 (88.3%) | 24 (11.7%) |
Occupancy by Age of Householder in Fieldbrook
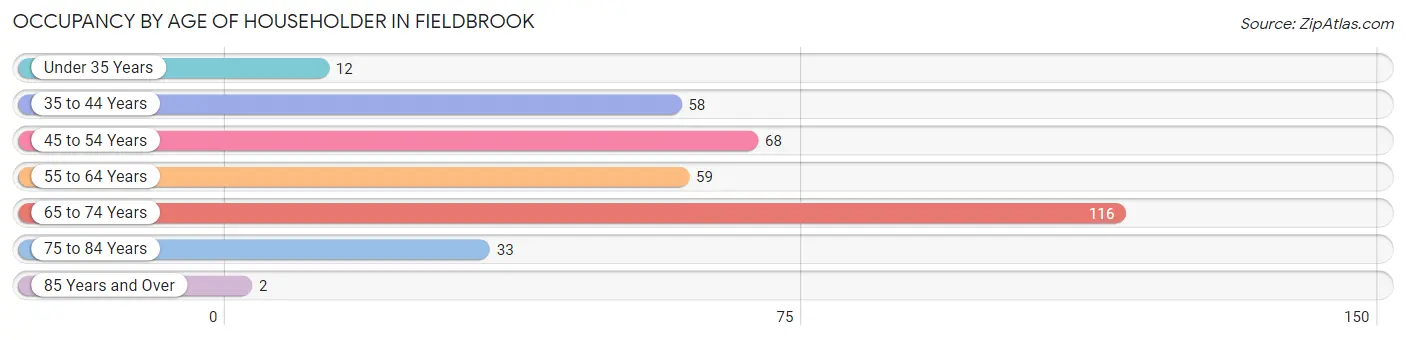
| Age Bracket | # Households | % Households |
| Under 35 Years | 12 | 3.5% |
| 35 to 44 Years | 58 | 16.7% |
| 45 to 54 Years | 68 | 19.5% |
| 55 to 64 Years | 59 | 17.0% |
| 65 to 74 Years | 116 | 33.3% |
| 75 to 84 Years | 33 | 9.5% |
| 85 Years and Over | 2 | 0.6% |
| Total | 348 | 100.0% |
Housing Finances in Fieldbrook
Median Income by Occupancy in Fieldbrook
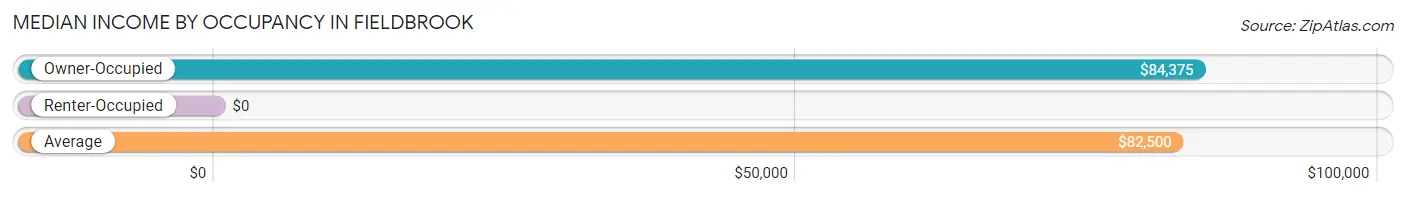
| Occupancy Type | # Households | Median Income |
| Owner-Occupied | 306 (87.9%) | $84,375 |
| Renter-Occupied | 42 (12.1%) | $0 |
| Average | 348 (100.0%) | $82,500 |
Occupancy by Householder Income Bracket in Fieldbrook
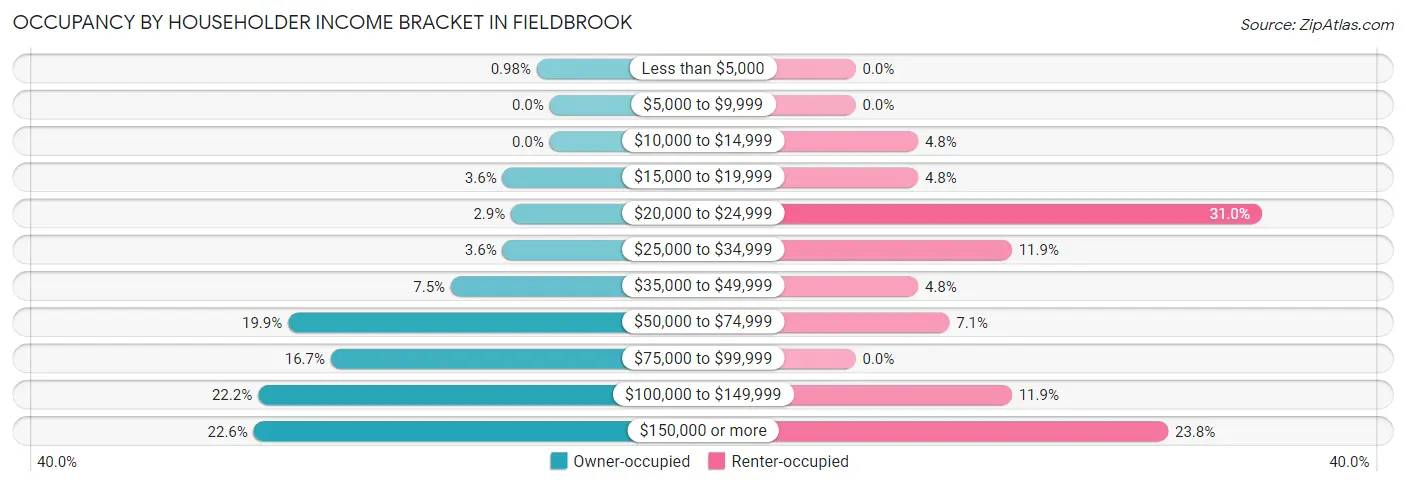
| Income Bracket | Owner-occupied | Renter-occupied |
| Less than $5,000 | 3 (1.0%) | 0 (0.0%) |
| $5,000 to $9,999 | 0 (0.0%) | 0 (0.0%) |
| $10,000 to $14,999 | 0 (0.0%) | 2 (4.8%) |
| $15,000 to $19,999 | 11 (3.6%) | 2 (4.8%) |
| $20,000 to $24,999 | 9 (2.9%) | 13 (30.9%) |
| $25,000 to $34,999 | 11 (3.6%) | 5 (11.9%) |
| $35,000 to $49,999 | 23 (7.5%) | 2 (4.8%) |
| $50,000 to $74,999 | 61 (19.9%) | 3 (7.1%) |
| $75,000 to $99,999 | 51 (16.7%) | 0 (0.0%) |
| $100,000 to $149,999 | 68 (22.2%) | 5 (11.9%) |
| $150,000 or more | 69 (22.6%) | 10 (23.8%) |
| Total | 306 (100.0%) | 42 (100.0%) |
Monthly Housing Cost Tiers in Fieldbrook
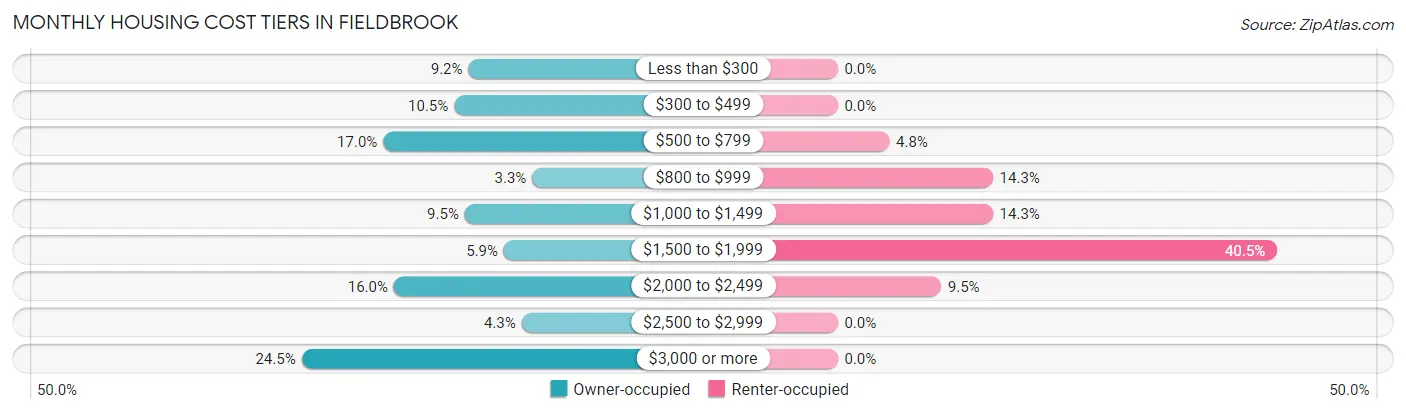
| Monthly Cost | Owner-occupied | Renter-occupied |
| Less than $300 | 28 (9.1%) | 0 (0.0%) |
| $300 to $499 | 32 (10.5%) | 0 (0.0%) |
| $500 to $799 | 52 (17.0%) | 2 (4.8%) |
| $800 to $999 | 10 (3.3%) | 6 (14.3%) |
| $1,000 to $1,499 | 29 (9.5%) | 6 (14.3%) |
| $1,500 to $1,999 | 18 (5.9%) | 17 (40.5%) |
| $2,000 to $2,499 | 49 (16.0%) | 4 (9.5%) |
| $2,500 to $2,999 | 13 (4.3%) | 0 (0.0%) |
| $3,000 or more | 75 (24.5%) | 0 (0.0%) |
| Total | 306 (100.0%) | 42 (100.0%) |
Physical Housing Characteristics in Fieldbrook
Housing Structures in Fieldbrook
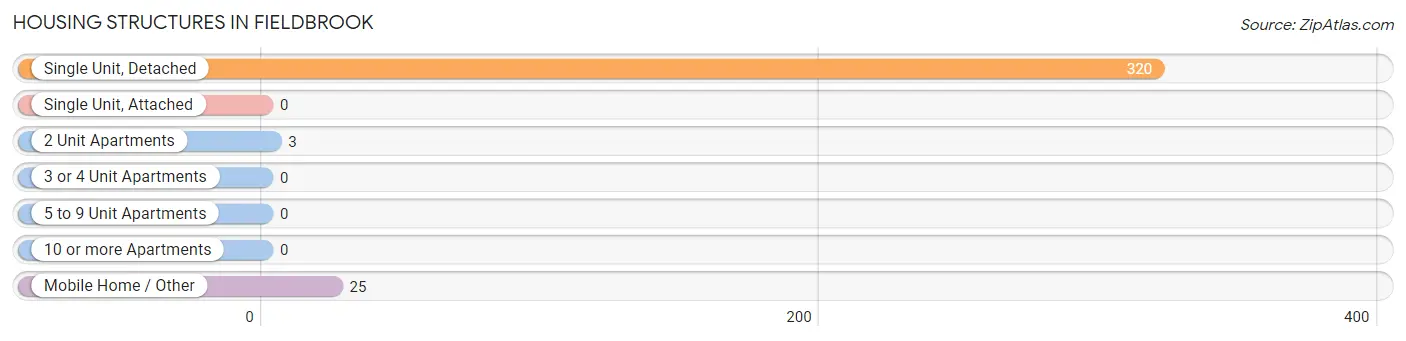
| Structure Type | # Housing Units | % Housing Units |
| Single Unit, Detached | 320 | 91.9% |
| Single Unit, Attached | 0 | 0.0% |
| 2 Unit Apartments | 3 | 0.9% |
| 3 or 4 Unit Apartments | 0 | 0.0% |
| 5 to 9 Unit Apartments | 0 | 0.0% |
| 10 or more Apartments | 0 | 0.0% |
| Mobile Home / Other | 25 | 7.2% |
| Total | 348 | 100.0% |
Housing Structures by Occupancy in Fieldbrook
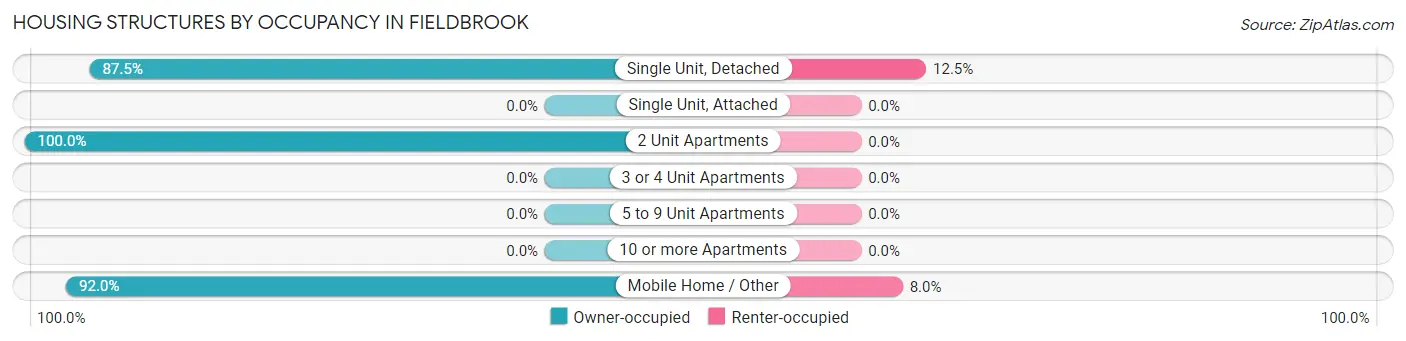
| Structure Type | Owner-occupied | Renter-occupied |
| Single Unit, Detached | 280 (87.5%) | 40 (12.5%) |
| Single Unit, Attached | 0 (0.0%) | 0 (0.0%) |
| 2 Unit Apartments | 3 (100.0%) | 0 (0.0%) |
| 3 or 4 Unit Apartments | 0 (0.0%) | 0 (0.0%) |
| 5 to 9 Unit Apartments | 0 (0.0%) | 0 (0.0%) |
| 10 or more Apartments | 0 (0.0%) | 0 (0.0%) |
| Mobile Home / Other | 23 (92.0%) | 2 (8.0%) |
| Total | 306 (87.9%) | 42 (12.1%) |
Housing Structures by Number of Rooms in Fieldbrook
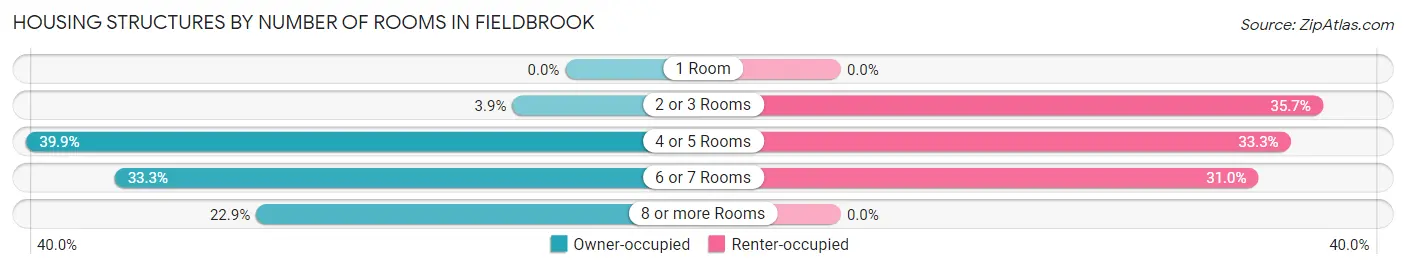
| Number of Rooms | Owner-occupied | Renter-occupied |
| 1 Room | 0 (0.0%) | 0 (0.0%) |
| 2 or 3 Rooms | 12 (3.9%) | 15 (35.7%) |
| 4 or 5 Rooms | 122 (39.9%) | 14 (33.3%) |
| 6 or 7 Rooms | 102 (33.3%) | 13 (30.9%) |
| 8 or more Rooms | 70 (22.9%) | 0 (0.0%) |
| Total | 306 (100.0%) | 42 (100.0%) |
Housing Structure by Heating Type in Fieldbrook
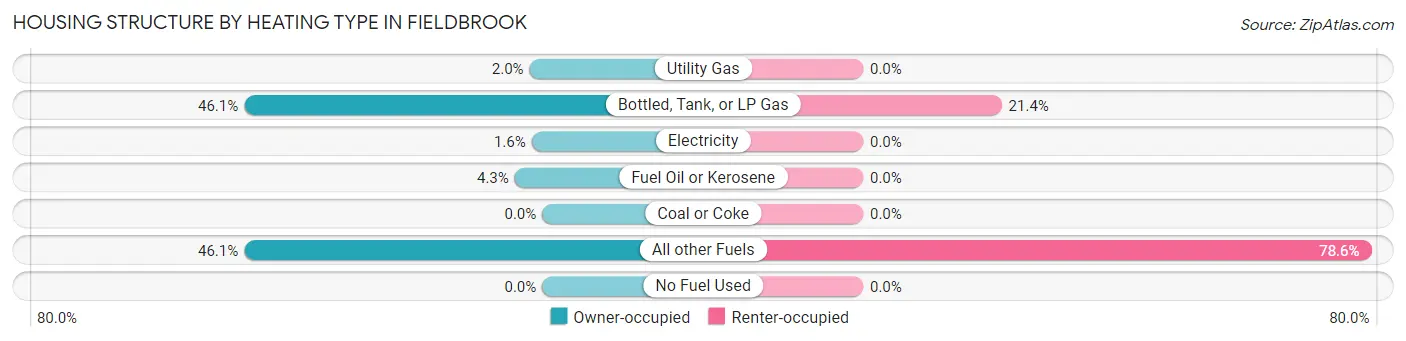
| Heating Type | Owner-occupied | Renter-occupied |
| Utility Gas | 6 (2.0%) | 0 (0.0%) |
| Bottled, Tank, or LP Gas | 141 (46.1%) | 9 (21.4%) |
| Electricity | 5 (1.6%) | 0 (0.0%) |
| Fuel Oil or Kerosene | 13 (4.3%) | 0 (0.0%) |
| Coal or Coke | 0 (0.0%) | 0 (0.0%) |
| All other Fuels | 141 (46.1%) | 33 (78.6%) |
| No Fuel Used | 0 (0.0%) | 0 (0.0%) |
| Total | 306 (100.0%) | 42 (100.0%) |
Household Vehicle Usage in Fieldbrook
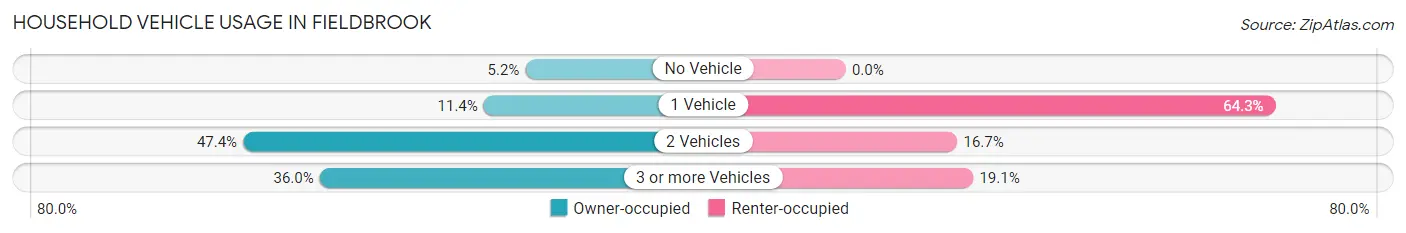
| Vehicles per Household | Owner-occupied | Renter-occupied |
| No Vehicle | 16 (5.2%) | 0 (0.0%) |
| 1 Vehicle | 35 (11.4%) | 27 (64.3%) |
| 2 Vehicles | 145 (47.4%) | 7 (16.7%) |
| 3 or more Vehicles | 110 (35.9%) | 8 (19.1%) |
| Total | 306 (100.0%) | 42 (100.0%) |
Real Estate & Mortgages in Fieldbrook
Real Estate and Mortgage Overview in Fieldbrook
| Characteristic | Without Mortgage | With Mortgage |
| Housing Units | 139 | 167 |
| Median Property Value | $451,100 | $640,200 |
| Median Household Income | $80,313 | $43 |
| Monthly Housing Costs | $556 | $75 |
| Real Estate Taxes | $2,097 | $0 |
Property Value by Mortgage Status in Fieldbrook
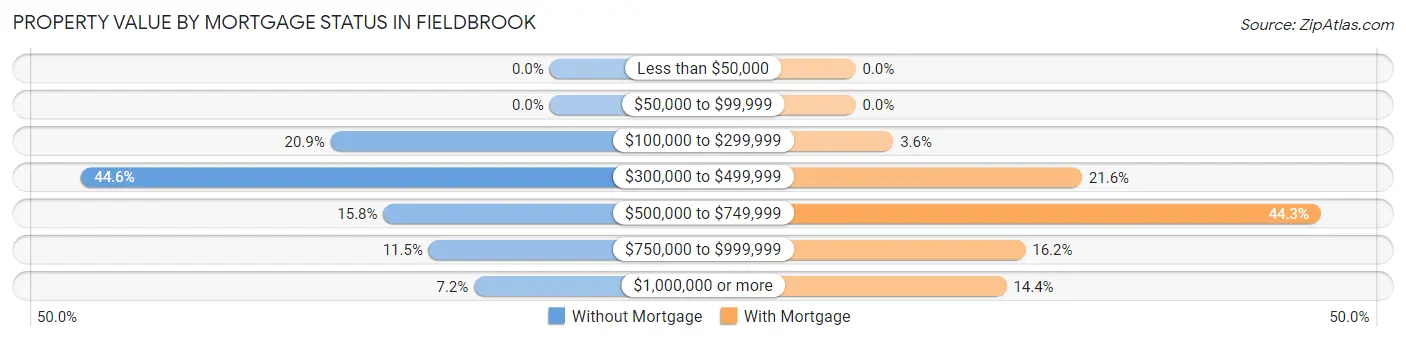
| Property Value | Without Mortgage | With Mortgage |
| Less than $50,000 | 0 (0.0%) | 0 (0.0%) |
| $50,000 to $99,999 | 0 (0.0%) | 0 (0.0%) |
| $100,000 to $299,999 | 29 (20.9%) | 6 (3.6%) |
| $300,000 to $499,999 | 62 (44.6%) | 36 (21.6%) |
| $500,000 to $749,999 | 22 (15.8%) | 74 (44.3%) |
| $750,000 to $999,999 | 16 (11.5%) | 27 (16.2%) |
| $1,000,000 or more | 10 (7.2%) | 24 (14.4%) |
| Total | 139 (100.0%) | 167 (100.0%) |
Household Income by Mortgage Status in Fieldbrook
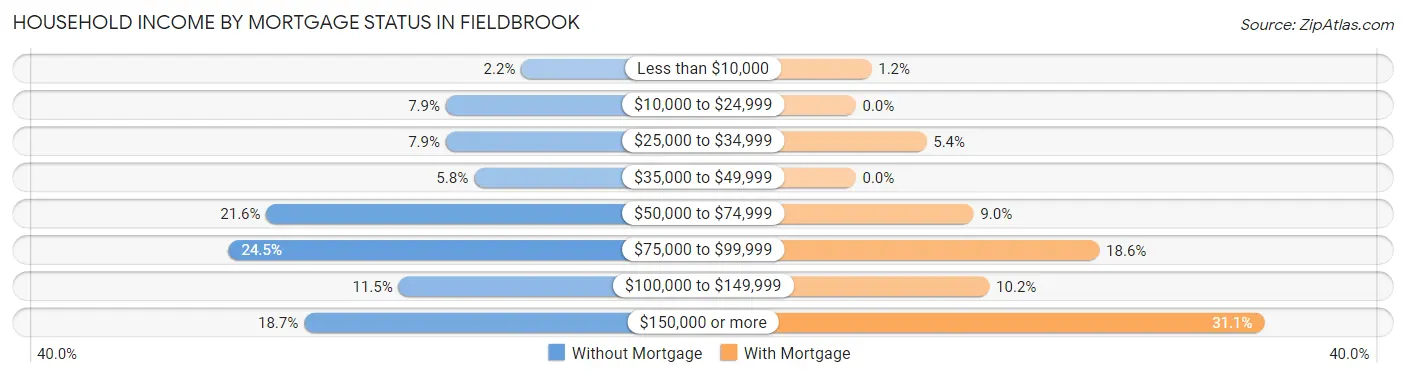
| Household Income | Without Mortgage | With Mortgage |
| Less than $10,000 | 3 (2.2%) | 2 (1.2%) |
| $10,000 to $24,999 | 11 (7.9%) | 0 (0.0%) |
| $25,000 to $34,999 | 11 (7.9%) | 9 (5.4%) |
| $35,000 to $49,999 | 8 (5.8%) | 0 (0.0%) |
| $50,000 to $74,999 | 30 (21.6%) | 15 (9.0%) |
| $75,000 to $99,999 | 34 (24.5%) | 31 (18.6%) |
| $100,000 to $149,999 | 16 (11.5%) | 17 (10.2%) |
| $150,000 or more | 26 (18.7%) | 52 (31.1%) |
| Total | 139 (100.0%) | 167 (100.0%) |
Property Value to Household Income Ratio in Fieldbrook
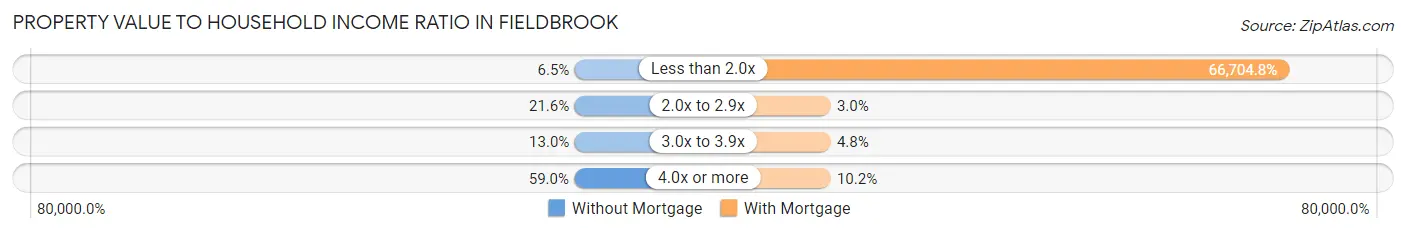
| Value-to-Income Ratio | Without Mortgage | With Mortgage |
| Less than 2.0x | 9 (6.5%) | 111,397 (66,704.8%) |
| 2.0x to 2.9x | 30 (21.6%) | 5 (3.0%) |
| 3.0x to 3.9x | 18 (13.0%) | 8 (4.8%) |
| 4.0x or more | 82 (59.0%) | 17 (10.2%) |
| Total | 139 (100.0%) | 167 (100.0%) |
Real Estate Taxes by Mortgage Status in Fieldbrook
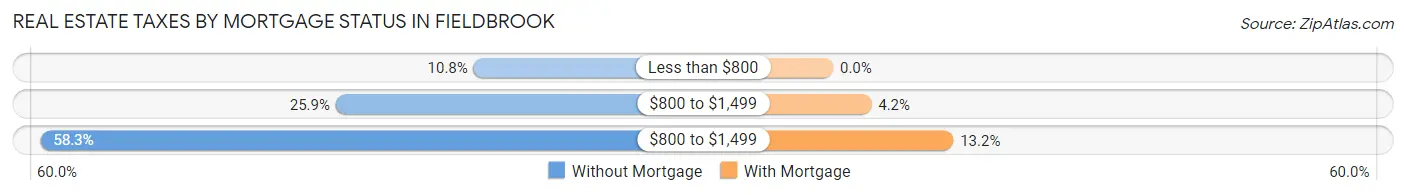
| Property Taxes | Without Mortgage | With Mortgage |
| Less than $800 | 15 (10.8%) | 0 (0.0%) |
| $800 to $1,499 | 36 (25.9%) | 7 (4.2%) |
| $800 to $1,499 | 81 (58.3%) | 22 (13.2%) |
| Total | 139 (100.0%) | 167 (100.0%) |
Health & Disability in Fieldbrook
Health Insurance Coverage by Age in Fieldbrook
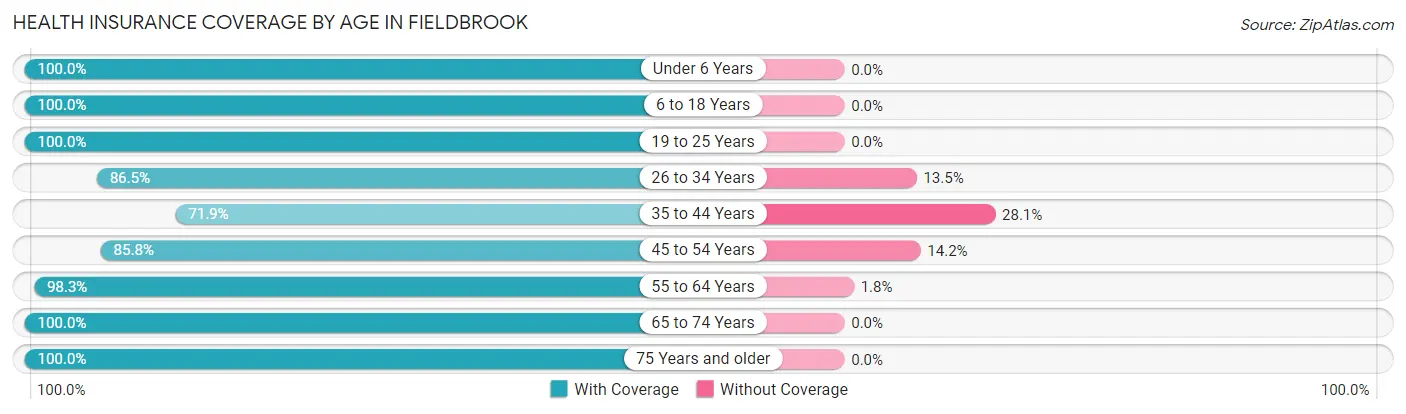
| Age Bracket | With Coverage | Without Coverage |
| Under 6 Years | 50 (100.0%) | 0 (0.0%) |
| 6 to 18 Years | 82 (100.0%) | 0 (0.0%) |
| 19 to 25 Years | 10 (100.0%) | 0 (0.0%) |
| 26 to 34 Years | 45 (86.5%) | 7 (13.5%) |
| 35 to 44 Years | 69 (71.9%) | 27 (28.1%) |
| 45 to 54 Years | 127 (85.8%) | 21 (14.2%) |
| 55 to 64 Years | 112 (98.3%) | 2 (1.8%) |
| 65 to 74 Years | 182 (100.0%) | 0 (0.0%) |
| 75 Years and older | 43 (100.0%) | 0 (0.0%) |
| Total | 720 (92.7%) | 57 (7.3%) |
Health Insurance Coverage by Citizenship Status in Fieldbrook
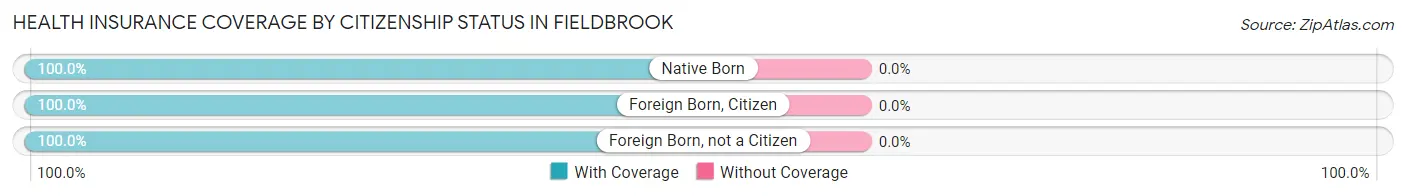
| Citizenship Status | With Coverage | Without Coverage |
| Native Born | 50 (100.0%) | 0 (0.0%) |
| Foreign Born, Citizen | 82 (100.0%) | 0 (0.0%) |
| Foreign Born, not a Citizen | 10 (100.0%) | 0 (0.0%) |
Health Insurance Coverage by Household Income in Fieldbrook
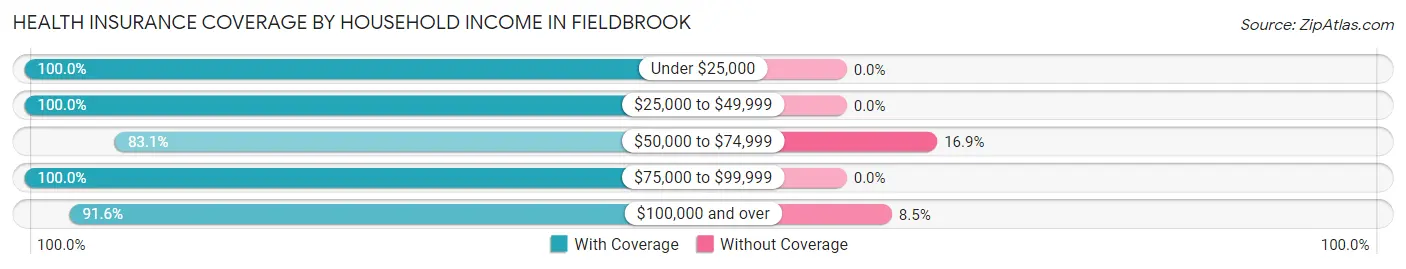
| Household Income | With Coverage | Without Coverage |
| Under $25,000 | 49 (100.0%) | 0 (0.0%) |
| $25,000 to $49,999 | 79 (100.0%) | 0 (0.0%) |
| $50,000 to $74,999 | 103 (83.1%) | 21 (16.9%) |
| $75,000 to $99,999 | 99 (100.0%) | 0 (0.0%) |
| $100,000 and over | 390 (91.5%) | 36 (8.5%) |
Public vs Private Health Insurance Coverage by Age in Fieldbrook
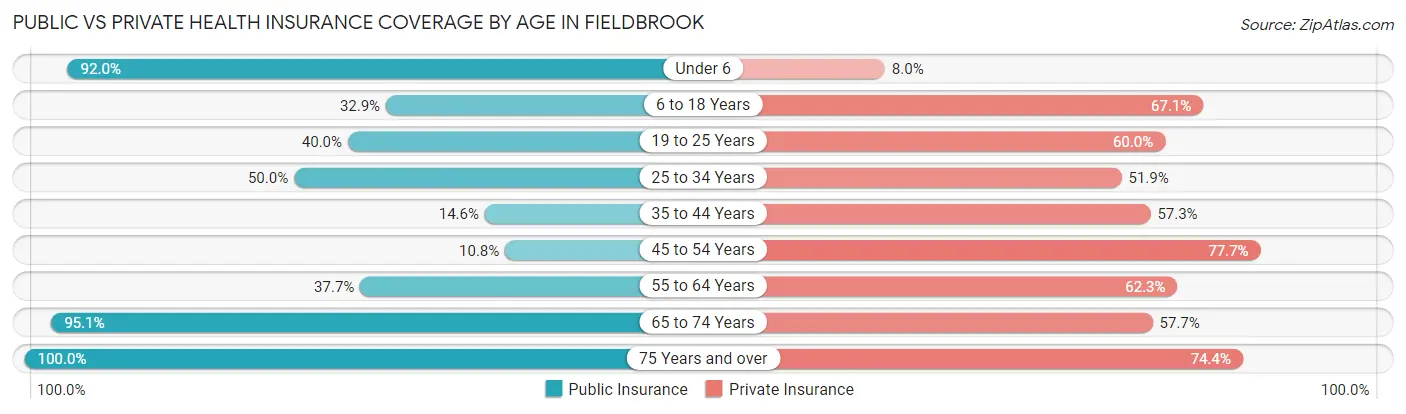
| Age Bracket | Public Insurance | Private Insurance |
| Under 6 | 46 (92.0%) | 4 (8.0%) |
| 6 to 18 Years | 27 (32.9%) | 55 (67.1%) |
| 19 to 25 Years | 4 (40.0%) | 6 (60.0%) |
| 25 to 34 Years | 26 (50.0%) | 27 (51.9%) |
| 35 to 44 Years | 14 (14.6%) | 55 (57.3%) |
| 45 to 54 Years | 16 (10.8%) | 115 (77.7%) |
| 55 to 64 Years | 43 (37.7%) | 71 (62.3%) |
| 65 to 74 Years | 173 (95.1%) | 105 (57.7%) |
| 75 Years and over | 43 (100.0%) | 32 (74.4%) |
| Total | 392 (50.4%) | 470 (60.5%) |
Disability Status by Sex by Age in Fieldbrook
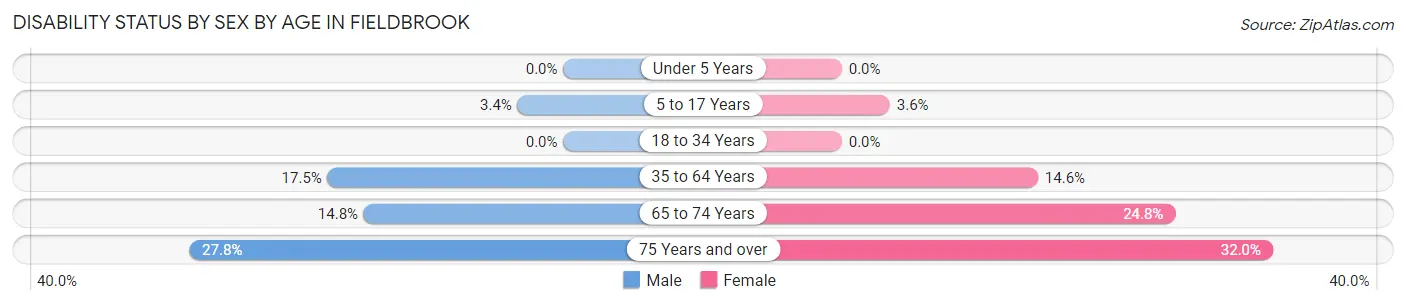
| Age Bracket | Male | Female |
| Under 5 Years | 0 (0.0%) | 0 (0.0%) |
| 5 to 17 Years | 2 (3.4%) | 1 (3.6%) |
| 18 to 34 Years | 0 (0.0%) | 0 (0.0%) |
| 35 to 64 Years | 35 (17.5%) | 23 (14.6%) |
| 65 to 74 Years | 12 (14.8%) | 25 (24.7%) |
| 75 Years and over | 5 (27.8%) | 8 (32.0%) |
Disability Class by Sex by Age in Fieldbrook
Disability Class: Hearing Difficulty
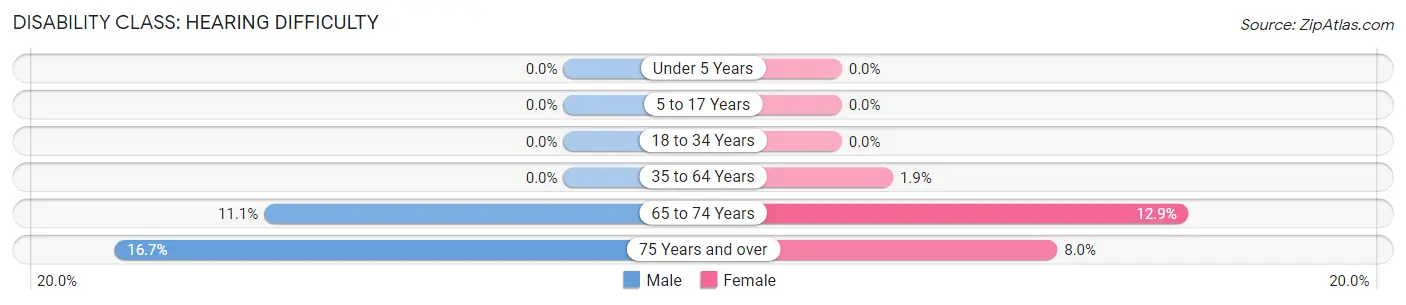
| Age Bracket | Male | Female |
| Under 5 Years | 0 (0.0%) | 0 (0.0%) |
| 5 to 17 Years | 0 (0.0%) | 0 (0.0%) |
| 18 to 34 Years | 0 (0.0%) | 0 (0.0%) |
| 35 to 64 Years | 0 (0.0%) | 3 (1.9%) |
| 65 to 74 Years | 9 (11.1%) | 13 (12.9%) |
| 75 Years and over | 3 (16.7%) | 2 (8.0%) |
Disability Class: Vision Difficulty
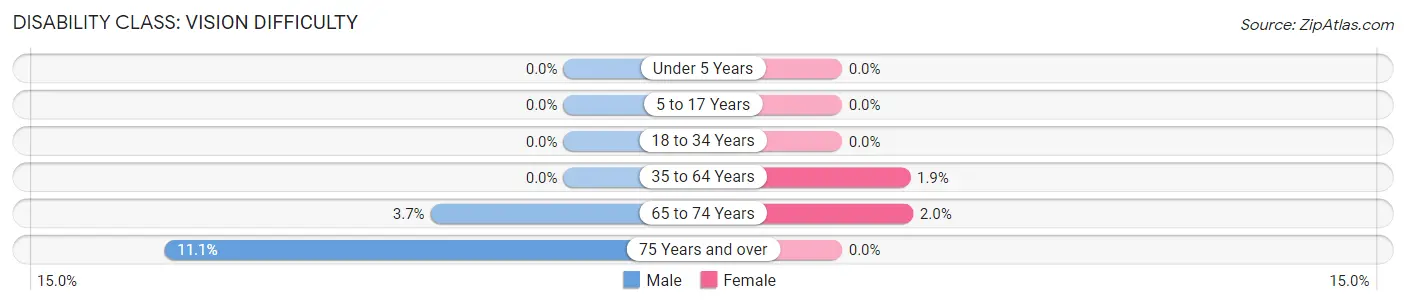
| Age Bracket | Male | Female |
| Under 5 Years | 0 (0.0%) | 0 (0.0%) |
| 5 to 17 Years | 0 (0.0%) | 0 (0.0%) |
| 18 to 34 Years | 0 (0.0%) | 0 (0.0%) |
| 35 to 64 Years | 0 (0.0%) | 3 (1.9%) |
| 65 to 74 Years | 3 (3.7%) | 2 (2.0%) |
| 75 Years and over | 2 (11.1%) | 0 (0.0%) |
Disability Class: Cognitive Difficulty
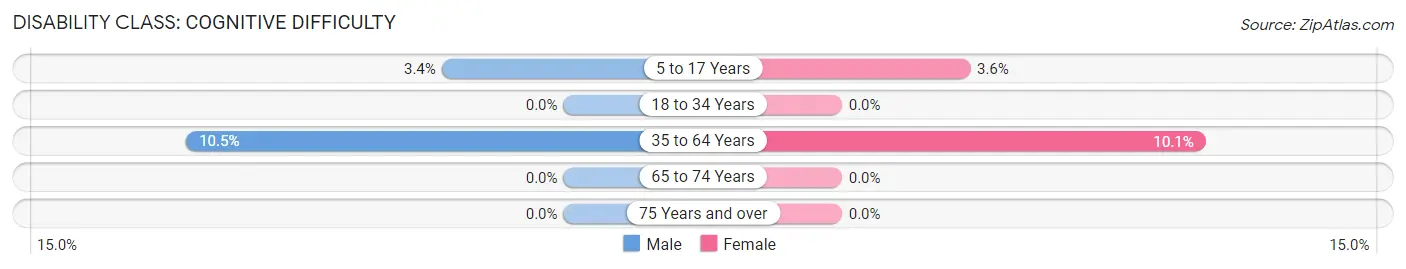
| Age Bracket | Male | Female |
| 5 to 17 Years | 2 (3.4%) | 1 (3.6%) |
| 18 to 34 Years | 0 (0.0%) | 0 (0.0%) |
| 35 to 64 Years | 21 (10.5%) | 16 (10.1%) |
| 65 to 74 Years | 0 (0.0%) | 0 (0.0%) |
| 75 Years and over | 0 (0.0%) | 0 (0.0%) |
Disability Class: Ambulatory Difficulty
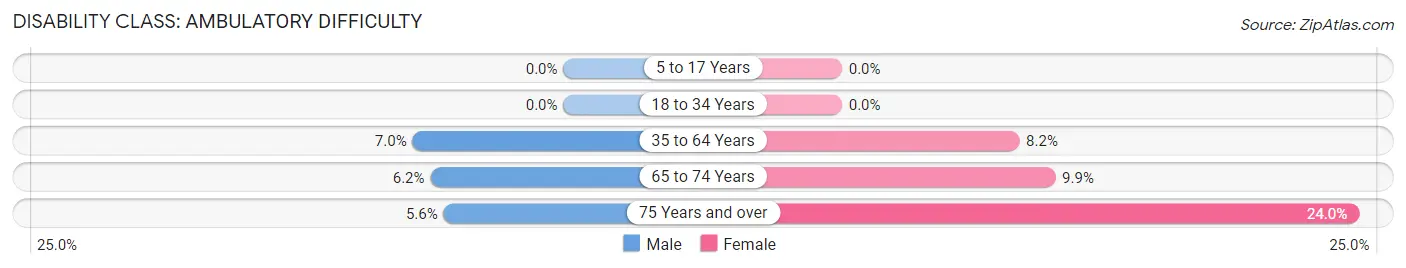
| Age Bracket | Male | Female |
| 5 to 17 Years | 0 (0.0%) | 0 (0.0%) |
| 18 to 34 Years | 0 (0.0%) | 0 (0.0%) |
| 35 to 64 Years | 14 (7.0%) | 13 (8.2%) |
| 65 to 74 Years | 5 (6.2%) | 10 (9.9%) |
| 75 Years and over | 1 (5.6%) | 6 (24.0%) |
Disability Class: Self-Care Difficulty
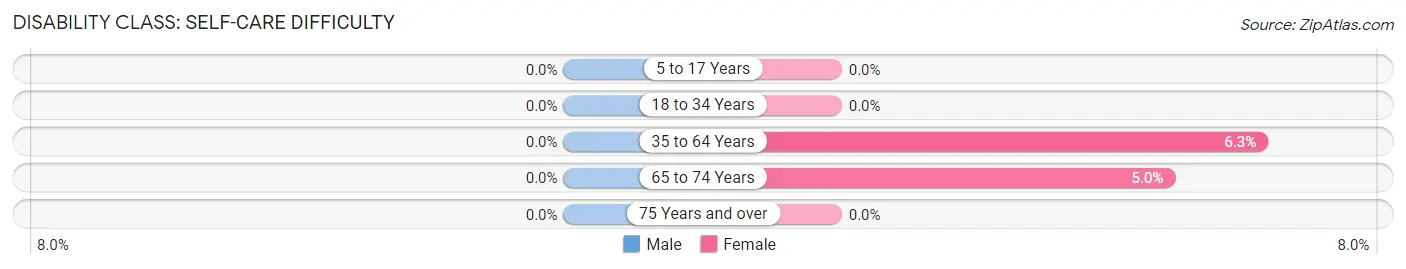
| Age Bracket | Male | Female |
| 5 to 17 Years | 0 (0.0%) | 0 (0.0%) |
| 18 to 34 Years | 0 (0.0%) | 0 (0.0%) |
| 35 to 64 Years | 0 (0.0%) | 10 (6.3%) |
| 65 to 74 Years | 0 (0.0%) | 5 (5.0%) |
| 75 Years and over | 0 (0.0%) | 0 (0.0%) |
Technology Access in Fieldbrook
Computing Device Access in Fieldbrook
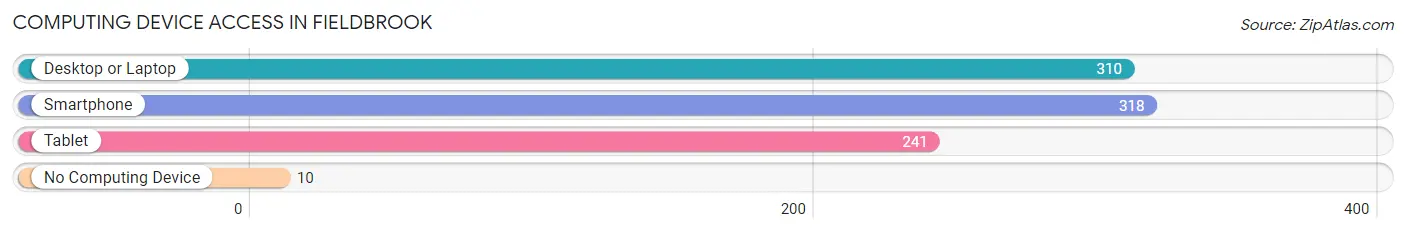
| Device Type | # Households | % Households |
| Desktop or Laptop | 310 | 89.1% |
| Smartphone | 318 | 91.4% |
| Tablet | 241 | 69.3% |
| No Computing Device | 10 | 2.9% |
| Total | 348 | 100.0% |
Internet Access in Fieldbrook
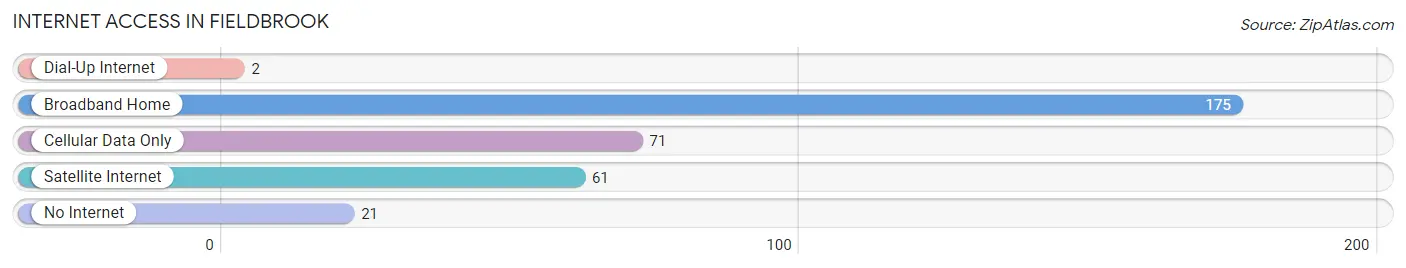
| Internet Type | # Households | % Households |
| Dial-Up Internet | 2 | 0.6% |
| Broadband Home | 175 | 50.3% |
| Cellular Data Only | 71 | 20.4% |
| Satellite Internet | 61 | 17.5% |
| No Internet | 21 | 6.0% |
| Total | 348 | 100.0% |
Fieldbrook Summary
History
Fieldbrook is an unincorporated community located in Humboldt County, California. It is situated in the Redwood Empire region of the state, approximately 8 miles south of the city of Arcata. The area was first settled in the late 1800s by a group of settlers from the Midwest. The settlers were attracted to the area due to its abundance of natural resources, including timber, fish, and game. The community was originally known as Field’s Brook, named after the first settler, John Field.
The town was officially established in 1891 and was home to a variety of businesses, including a general store, a blacksmith shop, a sawmill, and a post office. The town also had a school, which was built in 1895. The school was later replaced by a larger school in the early 1900s.
Fieldbrook was a popular destination for tourists in the early 1900s, as it was located near the Redwood National Park. The town was also home to a number of resorts, including the Fieldbrook Hotel, which was built in the 1920s.
Geography
Fieldbrook is located in the Redwood Empire region of California, approximately 8 miles south of the city of Arcata. The town is situated in a valley surrounded by hills and mountains. The area is known for its lush forests and abundant wildlife. The nearby Mad River flows through the town, providing a source of water for the community.
The climate in Fieldbrook is mild and temperate, with average temperatures ranging from the mid-50s to the mid-70s. The area receives an average of 35 inches of rain per year.
Economy
Fieldbrook’s economy is largely based on tourism and timber. The town is home to a number of resorts, including the Fieldbrook Hotel, which was built in the 1920s. The town also has a number of restaurants, shops, and other businesses that cater to tourists.
The timber industry is also an important part of the local economy. The area is home to a number of timber companies, which harvest the area’s abundant redwood trees. The timber is then processed and sold to lumberyards and other businesses.
Demographics
As of the 2010 census, the population of Fieldbrook was 1,845. The population is largely white (90.2%), with small percentages of Hispanic (3.2%), Asian (2.2%), and African American (1.2%) residents. The median household income in the town is $45,000, and the median age is 44.
Fieldbrook is a small, rural community with a close-knit population. The town is known for its friendly atmosphere and its commitment to preserving its natural resources. The town is also home to a number of festivals and events throughout the year, including the Fieldbrook Harvest Festival and the Fieldbrook Bluegrass Festival.
Common Questions
What is Per Capita Income in Fieldbrook?
Per Capita income in Fieldbrook is $46,235.
What is the Median Family Income in Fieldbrook?
Median Family Income in Fieldbrook is $100,179.
What is the Median Household income in Fieldbrook?
Median Household Income in Fieldbrook is $82,500.
What is Income or Wage Gap in Fieldbrook?
Income or Wage Gap in Fieldbrook is 39.1%.
Women in Fieldbrook earn 60.9 cents for every dollar earned by a man.
What is Inequality or Gini Index in Fieldbrook?
Inequality or Gini Index in Fieldbrook is 0.40.
What is the Total Population of Fieldbrook?
Total Population of Fieldbrook is 777.
What is the Total Male Population of Fieldbrook?
Total Male Population of Fieldbrook is 396.
What is the Total Female Population of Fieldbrook?
Total Female Population of Fieldbrook is 381.
What is the Ratio of Males per 100 Females in Fieldbrook?
There are 103.94 Males per 100 Females in Fieldbrook.
What is the Ratio of Females per 100 Males in Fieldbrook?
There are 96.21 Females per 100 Males in Fieldbrook.
What is the Median Population Age in Fieldbrook?
Median Population Age in Fieldbrook is 52.3 Years.
What is the Average Family Size in Fieldbrook
Average Family Size in Fieldbrook is 2.5 People.
What is the Average Household Size in Fieldbrook
Average Household Size in Fieldbrook is 2.2 People.
How Large is the Labor Force in Fieldbrook?
There are 385 People in the Labor Forcein in Fieldbrook.
What is the Percentage of People in the Labor Force in Fieldbrook?
58.1% of People are in the Labor Force in Fieldbrook.
What is the Unemployment Rate in Fieldbrook?
Unemployment Rate in Fieldbrook is 5.2%.