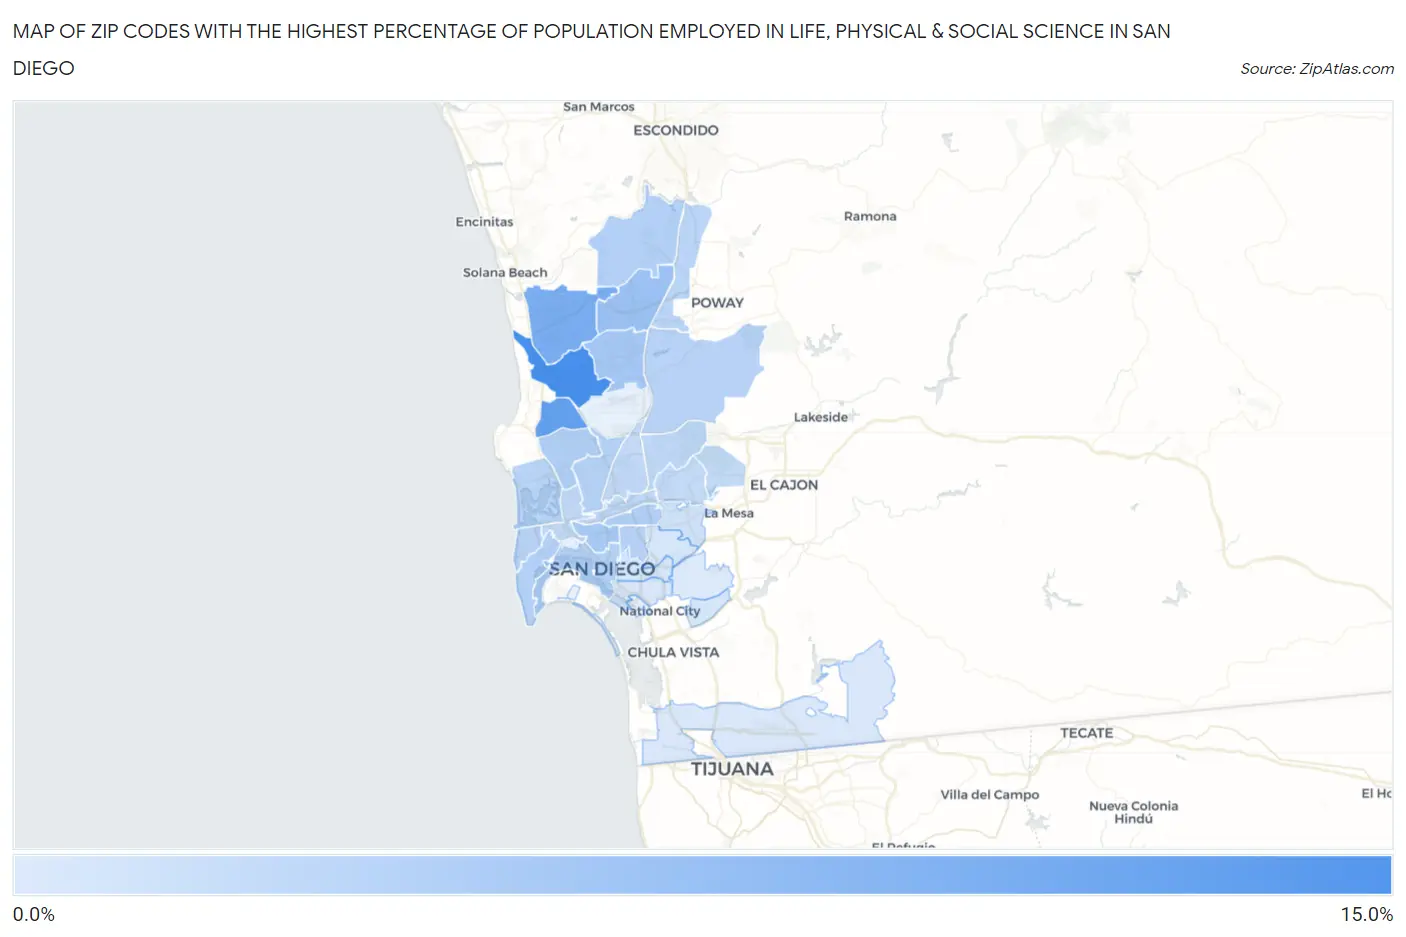
Zip Codes with the Highest Percentage of Population Employed in Life, Physical & Social Science in San Diego, CA
RELATED REPORTS & OPTIONS
Life, Physical & Social Science
San Diego
Compare Zip Codes
Map of Zip Codes with the Highest Percentage of Population Employed in Life, Physical & Social Science in San Diego
0.36%
10.9%
Zip Codes with the Highest Percentage of Population Employed in Life, Physical & Social Science in San Diego, CA
| Zip Code | % Employed | vs State | vs National | |
| 1. | 92121 | 10.9% | 1.3%(+9.59)#15 | 1.1%(+9.81)#174 |
| 2. | 92122 | 8.9% | 1.3%(+7.55)#33 | 1.1%(+7.76)#263 |
| 3. | 92130 | 7.2% | 1.3%(+5.94)#46 | 1.1%(+6.15)#387 |
| 4. | 92129 | 4.9% | 1.3%(+3.60)#88 | 1.1%(+3.82)#792 |
| 5. | 92126 | 4.1% | 1.3%(+2.79)#116 | 1.1%(+3.01)#1,098 |
| 6. | 92103 | 3.9% | 1.3%(+2.59)#128 | 1.1%(+2.81)#1,217 |
| 7. | 92116 | 3.4% | 1.3%(+2.05)#155 | 1.1%(+2.26)#1,532 |
| 8. | 92117 | 3.3% | 1.3%(+2.01)#158 | 1.1%(+2.23)#1,561 |
| 9. | 92106 | 3.2% | 1.3%(+1.94)#163 | 1.1%(+2.15)#1,631 |
| 10. | 92127 | 3.2% | 1.3%(+1.91)#167 | 1.1%(+2.12)#1,658 |
| 11. | 92101 | 3.1% | 1.3%(+1.75)#187 | 1.1%(+1.97)#1,809 |
| 12. | 92111 | 3.0% | 1.3%(+1.68)#190 | 1.1%(+1.89)#1,896 |
| 13. | 92131 | 2.9% | 1.3%(+1.59)#198 | 1.1%(+1.81)#1,997 |
| 14. | 92104 | 2.8% | 1.3%(+1.53)#202 | 1.1%(+1.75)#2,062 |
| 15. | 92107 | 2.8% | 1.3%(+1.49)#207 | 1.1%(+1.70)#2,124 |
| 16. | 92109 | 2.7% | 1.3%(+1.41)#218 | 1.1%(+1.63)#2,224 |
| 17. | 92128 | 2.6% | 1.3%(+1.33)#228 | 1.1%(+1.54)#2,340 |
| 18. | 92108 | 2.3% | 1.3%(+1.02)#258 | 1.1%(+1.24)#2,884 |
| 19. | 92124 | 2.3% | 1.3%(+1.02)#259 | 1.1%(+1.23)#2,898 |
| 20. | 92123 | 2.2% | 1.3%(+0.939)#277 | 1.1%(+1.16)#3,072 |
| 21. | 92110 | 2.2% | 1.3%(+0.876)#295 | 1.1%(+1.09)#3,220 |
| 22. | 92120 | 2.1% | 1.3%(+0.813)#306 | 1.1%(+1.03)#3,368 |
| 23. | 92119 | 2.1% | 1.3%(+0.795)#311 | 1.1%(+1.01)#3,417 |
| 24. | 92115 | 1.3% | 1.3%(-0.040)#581 | 1.1%(+0.177)#7,020 |
| 25. | 92139 | 0.89% | 1.3%(-0.417)#808 | 1.1%(-0.200)#10,042 |
| 26. | 92102 | 0.88% | 1.3%(-0.426)#815 | 1.1%(-0.209)#10,126 |
| 27. | 92105 | 0.81% | 1.3%(-0.499)#875 | 1.1%(-0.282)#10,907 |
| 28. | 92113 | 0.63% | 1.3%(-0.680)#990 | 1.1%(-0.463)#12,937 |
| 29. | 92154 | 0.47% | 1.3%(-0.840)#1,101 | 1.1%(-0.623)#14,929 |
| 30. | 92114 | 0.36% | 1.3%(-0.951)#1,167 | 1.1%(-0.734)#16,328 |
1
Common Questions
What are the Top 10 Zip Codes with the Highest Percentage of Population Employed in Life, Physical & Social Science in San Diego, CA?
Top 10 Zip Codes with the Highest Percentage of Population Employed in Life, Physical & Social Science in San Diego, CA are:
What zip code has the Highest Percentage of Population Employed in Life, Physical & Social Science in San Diego, CA?
92121 has the Highest Percentage of Population Employed in Life, Physical & Social Science in San Diego, CA with 10.9%.
What is the Percentage of Population Employed in Life, Physical & Social Science in San Diego, CA?
Percentage of Population Employed in Life, Physical & Social Science in San Diego is 2.9%.
What is the Percentage of Population Employed in Life, Physical & Social Science in California?
Percentage of Population Employed in Life, Physical & Social Science in California is 1.3%.
What is the Percentage of Population Employed in Life, Physical & Social Science in the United States?
Percentage of Population Employed in Life, Physical & Social Science in the United States is 1.1%.