Running Springs, CA Map & Demographics
Running Springs Map
Running Springs Overview
$37,894
PER CAPITA INCOME
$89,301
AVG FAMILY INCOME
$84,060
AVG HOUSEHOLD INCOME
67.2%
WAGE / INCOME GAP [ % ]
32.8¢/ $1
WAGE / INCOME GAP [ $ ]
0.35
INEQUALITY / GINI INDEX
4,589
TOTAL POPULATION
2,251
MALE POPULATION
2,338
FEMALE POPULATION
96.28
MALES / 100 FEMALES
103.86
FEMALES / 100 MALES
37.9
MEDIAN AGE
3.1
AVG FAMILY SIZE
2.5
AVG HOUSEHOLD SIZE
2,279
LABOR FORCE [ PEOPLE ]
64.9%
PERCENT IN LABOR FORCE
4.3%
UNEMPLOYMENT RATE
Running Springs Zip Codes
Income in Running Springs
Income Overview in Running Springs
Per Capita Income in Running Springs is $37,894, while median incomes of families and households are $89,301 and $84,060 respectively.
| Characteristic | Number | Measure |
| Per Capita Income | 4,589 | $37,894 |
| Median Family Income | 1,221 | $89,301 |
| Mean Family Income | 1,221 | $106,374 |
| Median Household Income | 1,812 | $84,060 |
| Mean Household Income | 1,812 | $94,380 |
| Income Deficit | 1,221 | $0 |
| Wage / Income Gap (%) | 4,589 | 67.17% |
| Wage / Income Gap ($) | 4,589 | 32.83¢ per $1 |
| Gini / Inequality Index | 4,589 | 0.35 |
Earnings by Sex in Running Springs
Average Earnings in Running Springs are $53,839, $67,955 for men and $22,310 for women, a difference of 67.2%.
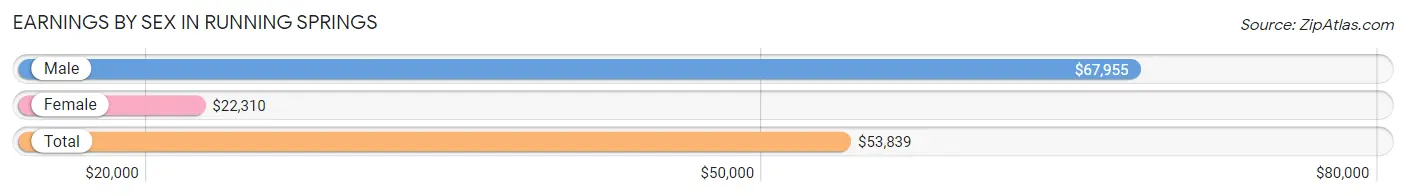
| Sex | Number | Average Earnings |
| Male | 1,276 (54.2%) | $67,955 |
| Female | 1,077 (45.8%) | $22,310 |
| Total | 2,353 (100.0%) | $53,839 |
Earnings by Sex by Income Bracket in Running Springs
The most common earnings brackets in Running Springs are $100,000+ for men (343 | 26.9%) and $75,000 to $99,999 for women (127 | 11.8%).
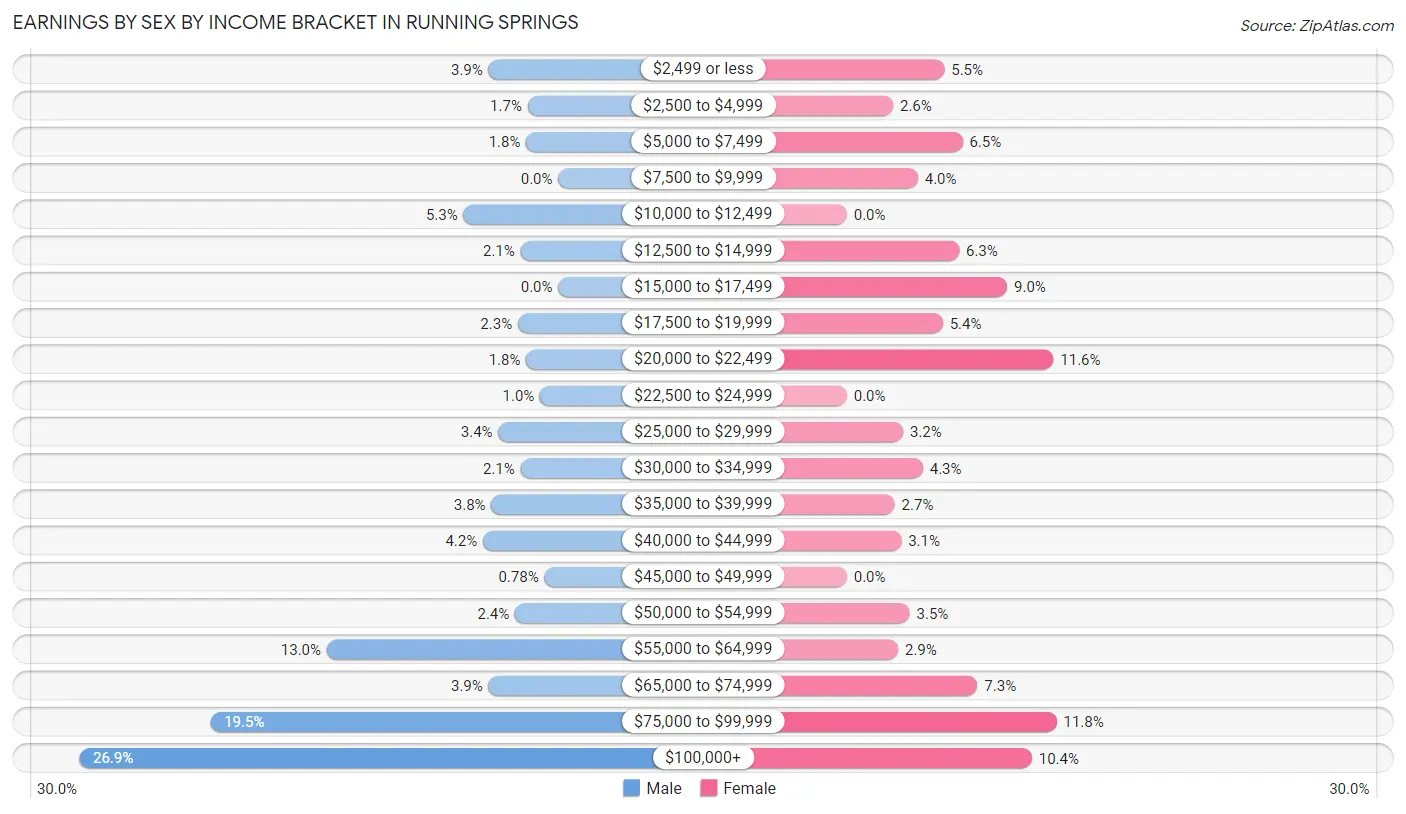
| Income | Male | Female |
| $2,499 or less | 50 (3.9%) | 59 (5.5%) |
| $2,500 to $4,999 | 22 (1.7%) | 28 (2.6%) |
| $5,000 to $7,499 | 23 (1.8%) | 70 (6.5%) |
| $7,500 to $9,999 | 0 (0.0%) | 43 (4.0%) |
| $10,000 to $12,499 | 68 (5.3%) | 0 (0.0%) |
| $12,500 to $14,999 | 27 (2.1%) | 68 (6.3%) |
| $15,000 to $17,499 | 0 (0.0%) | 97 (9.0%) |
| $17,500 to $19,999 | 29 (2.3%) | 58 (5.4%) |
| $20,000 to $22,499 | 23 (1.8%) | 125 (11.6%) |
| $22,500 to $24,999 | 13 (1.0%) | 0 (0.0%) |
| $25,000 to $29,999 | 43 (3.4%) | 34 (3.2%) |
| $30,000 to $34,999 | 27 (2.1%) | 46 (4.3%) |
| $35,000 to $39,999 | 48 (3.8%) | 29 (2.7%) |
| $40,000 to $44,999 | 54 (4.2%) | 33 (3.1%) |
| $45,000 to $49,999 | 10 (0.8%) | 0 (0.0%) |
| $50,000 to $54,999 | 31 (2.4%) | 38 (3.5%) |
| $55,000 to $64,999 | 166 (13.0%) | 31 (2.9%) |
| $65,000 to $74,999 | 50 (3.9%) | 79 (7.3%) |
| $75,000 to $99,999 | 249 (19.5%) | 127 (11.8%) |
| $100,000+ | 343 (26.9%) | 112 (10.4%) |
| Total | 1,276 (100.0%) | 1,077 (100.0%) |
Earnings by Sex by Educational Attainment in Running Springs
Average earnings in Running Springs are $77,188 for men and $30,833 for women, a difference of 60.1%. Men with an educational attainment of bachelor's degree enjoy the highest average annual earnings of $82,045, while those with college or associate's degree education earn the least with $61,967. Women with an educational attainment of graduate degree earn the most with the average annual earnings of $68,224, while those with high school diploma education have the smallest earnings of $20,625.
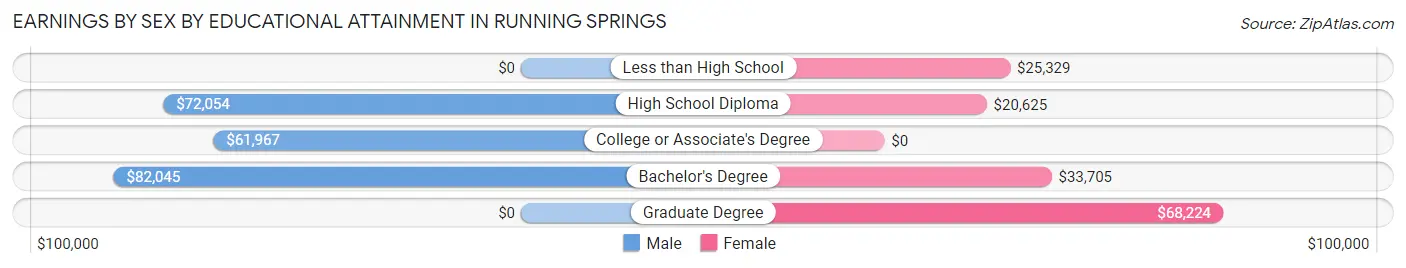
| Educational Attainment | Male Income | Female Income |
| Less than High School | - | - |
| High School Diploma | $72,054 | $20,625 |
| College or Associate's Degree | $61,967 | $0 |
| Bachelor's Degree | $82,045 | $33,705 |
| Graduate Degree | - | - |
| Total | $77,188 | $30,833 |
Family Income in Running Springs
Family Income Brackets in Running Springs
According to the Running Springs family income data, there are 317 families falling into the $75,000 to $99,999 income range, which is the most common income bracket and makes up 26.0% of all families. Conversely, the $10,000 to $14,999 income bracket is the least frequent group with only 24 families (2.0%) belonging to this category.
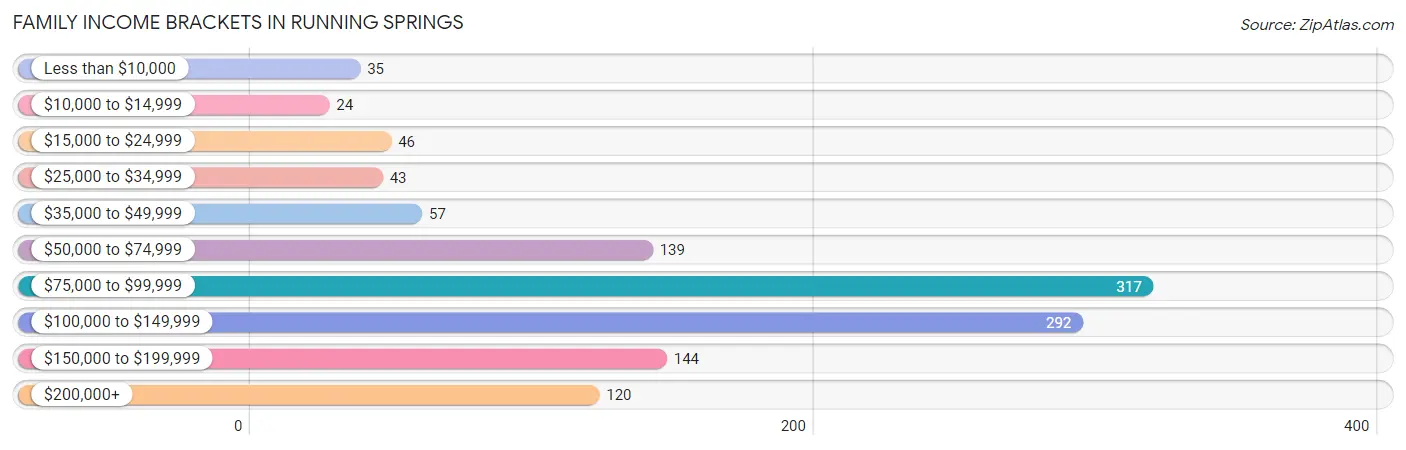
| Income Bracket | # Families | % Families |
| Less than $10,000 | 35 | 2.9% |
| $10,000 to $14,999 | 24 | 2.0% |
| $15,000 to $24,999 | 46 | 3.8% |
| $25,000 to $34,999 | 43 | 3.5% |
| $35,000 to $49,999 | 57 | 4.7% |
| $50,000 to $74,999 | 139 | 11.4% |
| $75,000 to $99,999 | 317 | 26.0% |
| $100,000 to $149,999 | 292 | 23.9% |
| $150,000 to $199,999 | 144 | 11.8% |
| $200,000+ | 120 | 9.8% |
Family Income by Famaliy Size in Running Springs
4-person families (204 | 16.7%) account for the highest median family income in Running Springs with $129,773 per family, while 2-person families (691 | 56.6%) have the highest median income of $48,867 per family member.
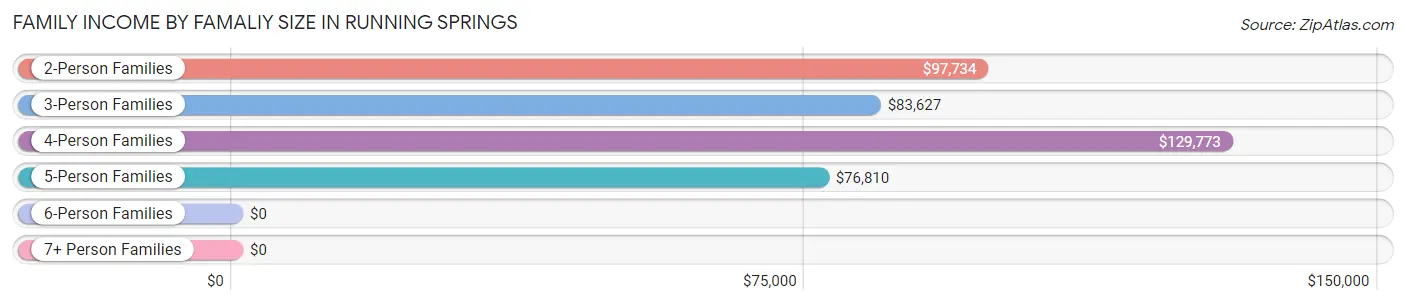
| Income Bracket | # Families | Median Income |
| 2-Person Families | 691 (56.6%) | $97,734 |
| 3-Person Families | 141 (11.6%) | $83,627 |
| 4-Person Families | 204 (16.7%) | $129,773 |
| 5-Person Families | 152 (12.4%) | $76,810 |
| 6-Person Families | 0 (0.0%) | $0 |
| 7+ Person Families | 33 (2.7%) | $0 |
| Total | 1,221 (100.0%) | $89,301 |
Family Income by Number of Earners in Running Springs
The median family income in Running Springs is $89,301, with families comprising 3+ earners (124) having the highest median family income of $124,732, while families with no earners (171) have the lowest median family income of $58,781, accounting for 10.2% and 14.0% of families, respectively.
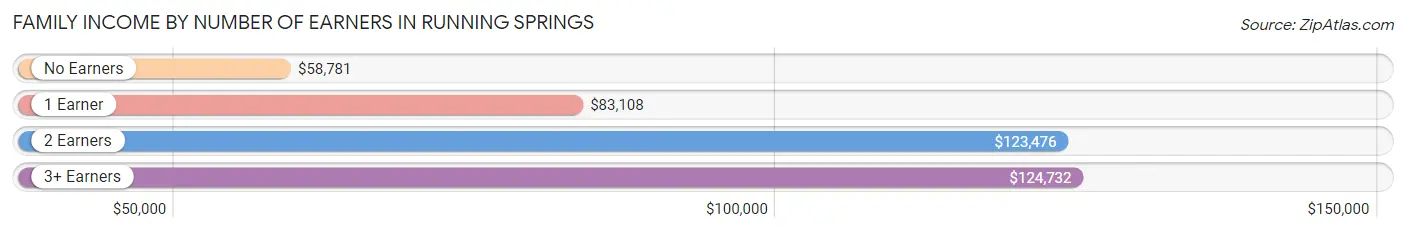
| Number of Earners | # Families | Median Income |
| No Earners | 171 (14.0%) | $58,781 |
| 1 Earner | 419 (34.3%) | $83,108 |
| 2 Earners | 507 (41.5%) | $123,476 |
| 3+ Earners | 124 (10.2%) | $124,732 |
| Total | 1,221 (100.0%) | $89,301 |
Household Income in Running Springs
Household Income Brackets in Running Springs
With 431 households falling in the category, the $100,000 to $149,999 income range is the most frequent in Running Springs, accounting for 23.8% of all households. In contrast, only 53 households (2.9%) fall into the $10,000 to $14,999 income bracket, making it the least populous group.
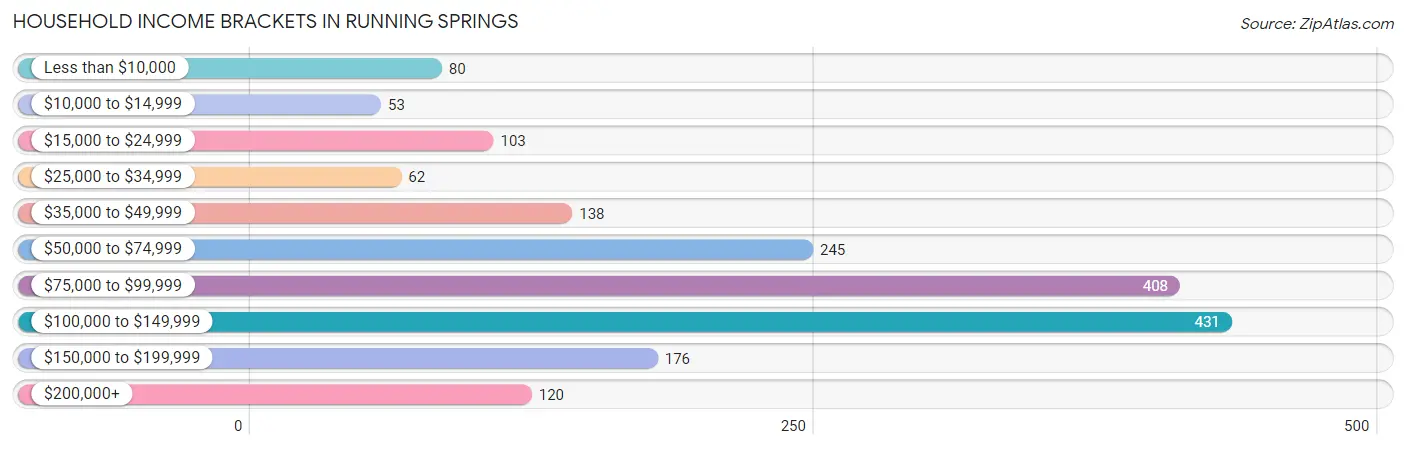
| Income Bracket | # Households | % Households |
| Less than $10,000 | 80 | 4.4% |
| $10,000 to $14,999 | 53 | 2.9% |
| $15,000 to $24,999 | 103 | 5.7% |
| $25,000 to $34,999 | 62 | 3.4% |
| $35,000 to $49,999 | 138 | 7.6% |
| $50,000 to $74,999 | 245 | 13.5% |
| $75,000 to $99,999 | 408 | 22.5% |
| $100,000 to $149,999 | 431 | 23.8% |
| $150,000 to $199,999 | 176 | 9.7% |
| $200,000+ | 120 | 6.6% |
Household Income by Householder Age in Running Springs
The median household income in Running Springs is $84,060, with the highest median household income of $96,250 found in the 45 to 64 years age bracket for the primary householder. A total of 517 households (28.5%) fall into this category. Meanwhile, the 15 to 24 years age bracket for the primary householder has the lowest median household income of $0, with 8 households (0.4%) in this group.
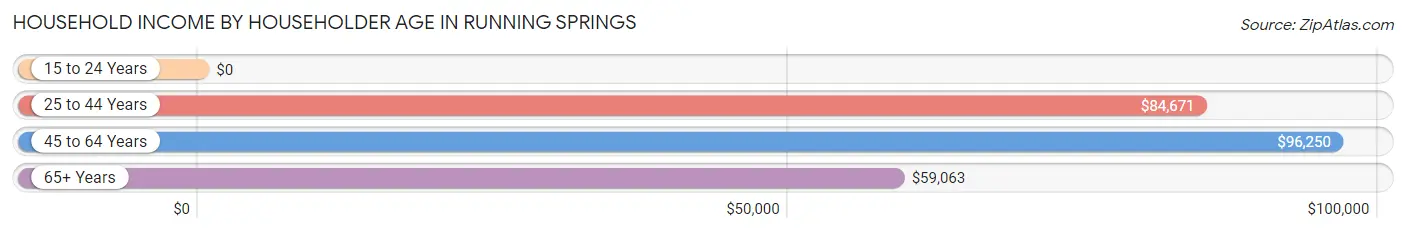
| Income Bracket | # Households | Median Income |
| 15 to 24 Years | 8 (0.4%) | $0 |
| 25 to 44 Years | 765 (42.2%) | $84,671 |
| 45 to 64 Years | 517 (28.5%) | $96,250 |
| 65+ Years | 522 (28.8%) | $59,063 |
| Total | 1,812 (100.0%) | $84,060 |
Poverty in Running Springs
Income Below Poverty by Sex and Age in Running Springs
With 4.8% poverty level for males and 9.3% for females among the residents of Running Springs, 12 to 14 year old males and 5 year old females are the most vulnerable to poverty, with 30 males (30.6%) and 29 females (100.0%) in their respective age groups living below the poverty level.
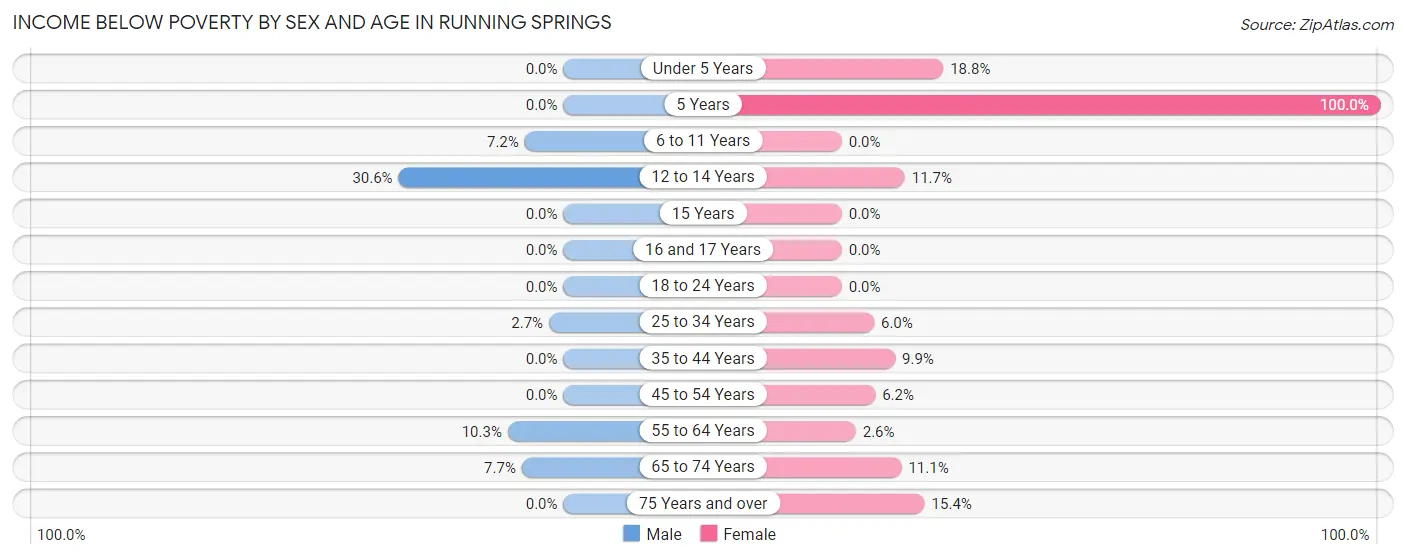
| Age Bracket | Male | Female |
| Under 5 Years | 0 (0.0%) | 45 (18.8%) |
| 5 Years | 0 (0.0%) | 29 (100.0%) |
| 6 to 11 Years | 12 (7.2%) | 0 (0.0%) |
| 12 to 14 Years | 30 (30.6%) | 9 (11.7%) |
| 15 Years | 0 (0.0%) | 0 (0.0%) |
| 16 and 17 Years | 0 (0.0%) | 0 (0.0%) |
| 18 to 24 Years | 0 (0.0%) | 0 (0.0%) |
| 25 to 34 Years | 9 (2.7%) | 22 (6.0%) |
| 35 to 44 Years | 0 (0.0%) | 30 (9.9%) |
| 45 to 54 Years | 0 (0.0%) | 17 (6.2%) |
| 55 to 64 Years | 36 (10.3%) | 6 (2.6%) |
| 65 to 74 Years | 21 (7.7%) | 36 (11.1%) |
| 75 Years and over | 0 (0.0%) | 24 (15.4%) |
| Total | 108 (4.8%) | 218 (9.3%) |
Income Above Poverty by Sex and Age in Running Springs
According to the poverty statistics in Running Springs, males aged under 5 years and females aged 6 to 11 years are the age groups that are most secure financially, with 100.0% of males and 100.0% of females in these age groups living above the poverty line.
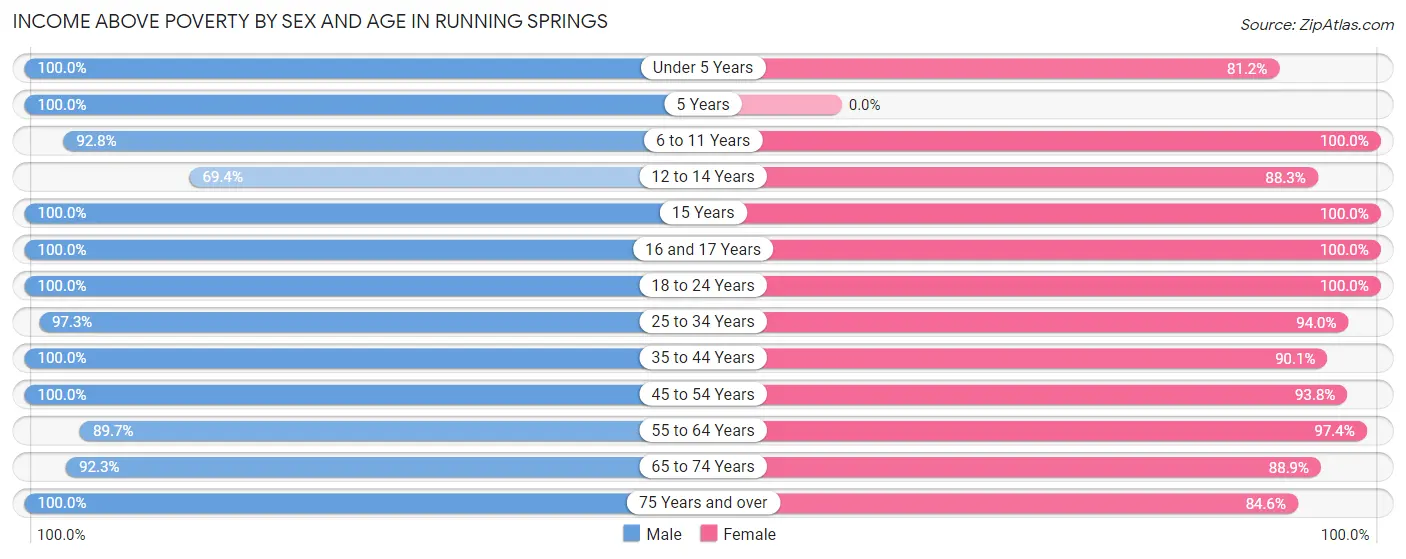
| Age Bracket | Male | Female |
| Under 5 Years | 126 (100.0%) | 194 (81.2%) |
| 5 Years | 20 (100.0%) | 0 (0.0%) |
| 6 to 11 Years | 155 (92.8%) | 165 (100.0%) |
| 12 to 14 Years | 68 (69.4%) | 68 (88.3%) |
| 15 Years | 120 (100.0%) | 36 (100.0%) |
| 16 and 17 Years | 22 (100.0%) | 35 (100.0%) |
| 18 to 24 Years | 146 (100.0%) | 100 (100.0%) |
| 25 to 34 Years | 328 (97.3%) | 346 (94.0%) |
| 35 to 44 Years | 308 (100.0%) | 273 (90.1%) |
| 45 to 54 Years | 139 (100.0%) | 257 (93.8%) |
| 55 to 64 Years | 313 (89.7%) | 225 (97.4%) |
| 65 to 74 Years | 251 (92.3%) | 289 (88.9%) |
| 75 Years and over | 147 (100.0%) | 132 (84.6%) |
| Total | 2,143 (95.2%) | 2,120 (90.7%) |
Income Below Poverty Among Married-Couple Families in Running Springs
The poverty statistics for married-couple families in Running Springs show that 1.7% or 16 of the total 968 families live below the poverty line. Families with no children have the highest poverty rate of 2.7%, comprising of 16 families. On the other hand, families with 1 or 2 children have the lowest poverty rate of 0.0%, which includes 0 families.
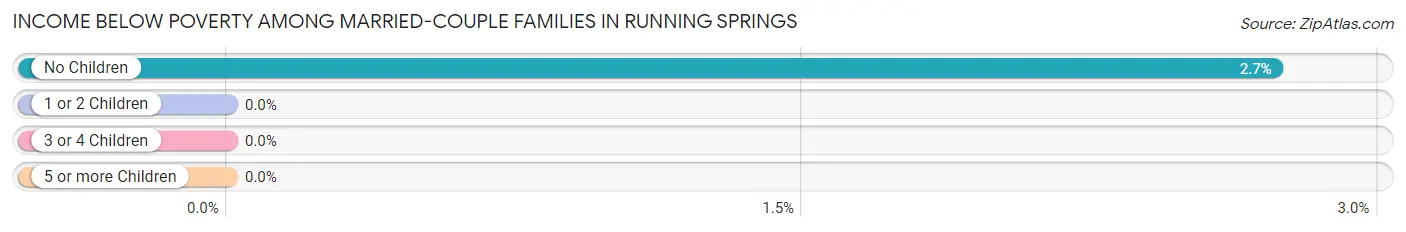
| Children | Above Poverty | Below Poverty |
| No Children | 571 (97.3%) | 16 (2.7%) |
| 1 or 2 Children | 261 (100.0%) | 0 (0.0%) |
| 3 or 4 Children | 103 (100.0%) | 0 (0.0%) |
| 5 or more Children | 17 (100.0%) | 0 (0.0%) |
| Total | 952 (98.4%) | 16 (1.7%) |
Income Below Poverty Among Single-Parent Households in Running Springs
According to the poverty data in Running Springs, 11.0% or 9 single-father households and 21.0% or 36 single-mother households are living below the poverty line. Among single-father households, those with 1 or 2 children have the highest poverty rate, with 9 households (37.5%) experiencing poverty. Likewise, among single-mother households, those with 3 or 4 children have the highest poverty rate, with 30 households (100.0%) falling below the poverty line.
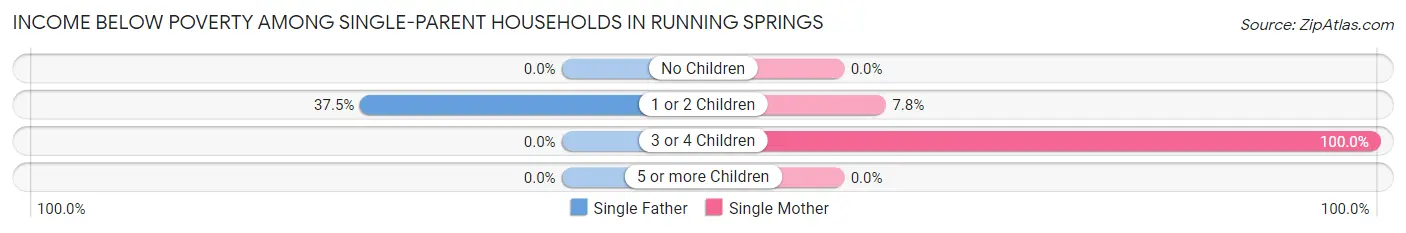
| Children | Single Father | Single Mother |
| No Children | 0 (0.0%) | 0 (0.0%) |
| 1 or 2 Children | 9 (37.5%) | 6 (7.8%) |
| 3 or 4 Children | 0 (0.0%) | 30 (100.0%) |
| 5 or more Children | 0 (0.0%) | 0 (0.0%) |
| Total | 9 (11.0%) | 36 (21.0%) |
Income Below Poverty Among Married-Couple vs Single-Parent Households in Running Springs
The poverty data for Running Springs shows that 16 of the married-couple family households (1.7%) and 45 of the single-parent households (17.8%) are living below the poverty level. Within the married-couple family households, those with no children have the highest poverty rate, with 16 households (2.7%) falling below the poverty line. Among the single-parent households, those with 3 or 4 children have the highest poverty rate, with 30 household (85.7%) living below poverty.
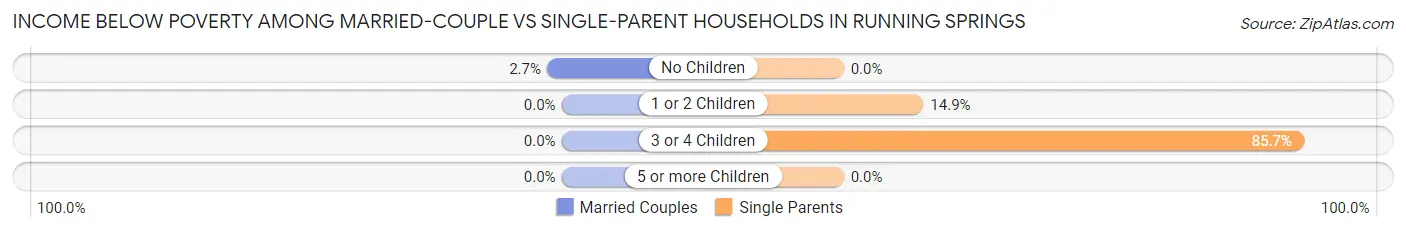
| Children | Married-Couple Families | Single-Parent Households |
| No Children | 16 (2.7%) | 0 (0.0%) |
| 1 or 2 Children | 0 (0.0%) | 15 (14.8%) |
| 3 or 4 Children | 0 (0.0%) | 30 (85.7%) |
| 5 or more Children | 0 (0.0%) | 0 (0.0%) |
| Total | 16 (1.7%) | 45 (17.8%) |
Race in Running Springs
The most populous races in Running Springs are White / Caucasian (3,518 | 76.7%), Hispanic or Latino (893 | 19.5%), and Two or more Races (474 | 10.3%).
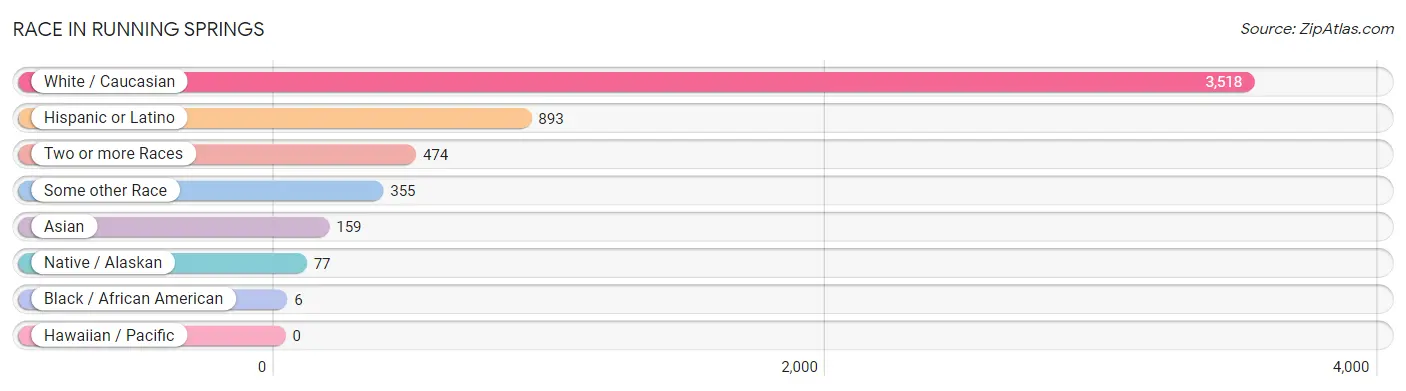
| Race | # Population | % Population |
| Asian | 159 | 3.5% |
| Black / African American | 6 | 0.1% |
| Hawaiian / Pacific | 0 | 0.0% |
| Hispanic or Latino | 893 | 19.5% |
| Native / Alaskan | 77 | 1.7% |
| White / Caucasian | 3,518 | 76.7% |
| Two or more Races | 474 | 10.3% |
| Some other Race | 355 | 7.7% |
| Total | 4,589 | 100.0% |
Ancestry in Running Springs
The most populous ancestries reported in Running Springs are Mexican (789 | 17.2%), German (582 | 12.7%), Irish (500 | 10.9%), English (480 | 10.5%), and Italian (324 | 7.1%), together accounting for 58.3% of all Running Springs residents.
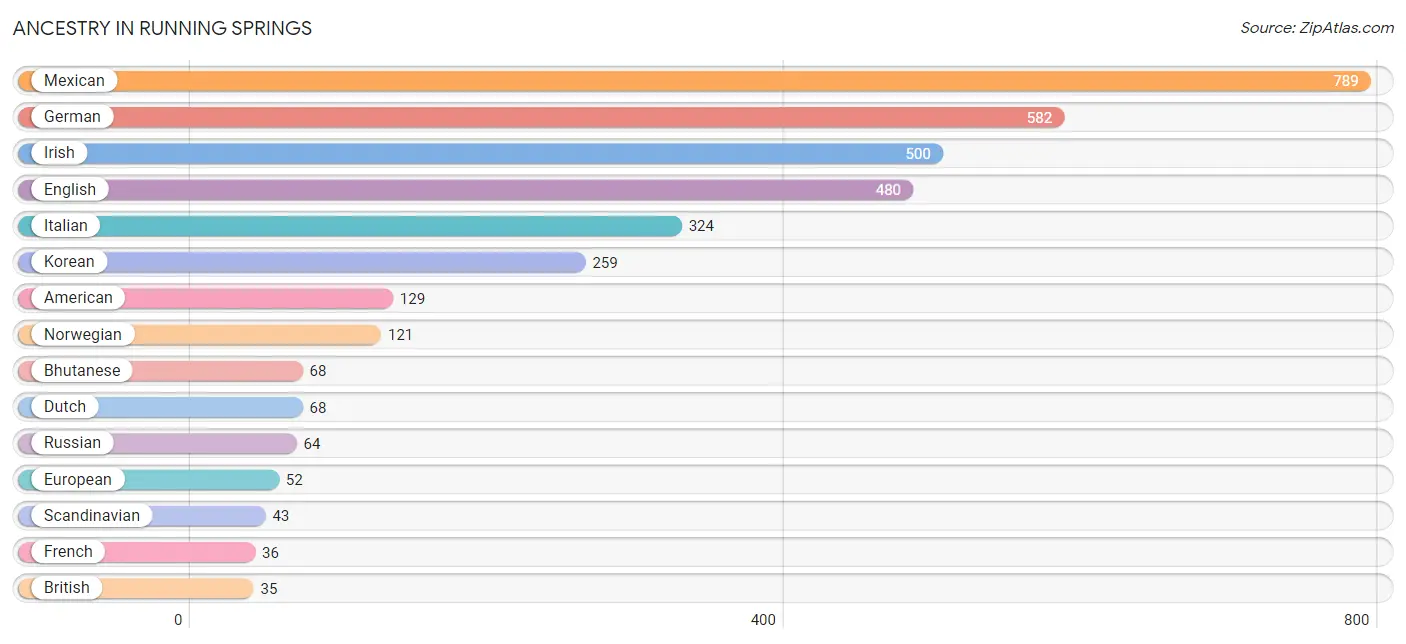
| Ancestry | # Population | % Population |
| American | 129 | 2.8% |
| Apache | 22 | 0.5% |
| Arab | 16 | 0.4% |
| Armenian | 5 | 0.1% |
| Austrian | 19 | 0.4% |
| Bhutanese | 68 | 1.5% |
| British | 35 | 0.8% |
| Cuban | 28 | 0.6% |
| Czech | 19 | 0.4% |
| Danish | 18 | 0.4% |
| Dutch | 68 | 1.5% |
| English | 480 | 10.5% |
| European | 52 | 1.1% |
| Finnish | 10 | 0.2% |
| French | 36 | 0.8% |
| French Canadian | 17 | 0.4% |
| German | 582 | 12.7% |
| Irish | 500 | 10.9% |
| Italian | 324 | 7.1% |
| Korean | 259 | 5.6% |
| Mexican | 789 | 17.2% |
| Mexican American Indian | 6 | 0.1% |
| Northern European | 28 | 0.6% |
| Norwegian | 121 | 2.6% |
| Peruvian | 18 | 0.4% |
| Polish | 12 | 0.3% |
| Portuguese | 17 | 0.4% |
| Russian | 64 | 1.4% |
| Scandinavian | 43 | 0.9% |
| Scottish | 35 | 0.8% |
| Sioux | 16 | 0.4% |
| South American | 18 | 0.4% |
| Spanish | 13 | 0.3% |
| Sri Lankan | 19 | 0.4% |
| Swedish | 19 | 0.4% |
| Swiss | 11 | 0.2% |
| Welsh | 16 | 0.4% | View All 37 Rows |
Immigrants in Running Springs
The most numerous immigrant groups reported in Running Springs came from Asia (124 | 2.7%), South Eastern Asia (100 | 2.2%), Philippines (81 | 1.8%), Central America (77 | 1.7%), and Latin America (77 | 1.7%), together accounting for 10.0% of all Running Springs residents.
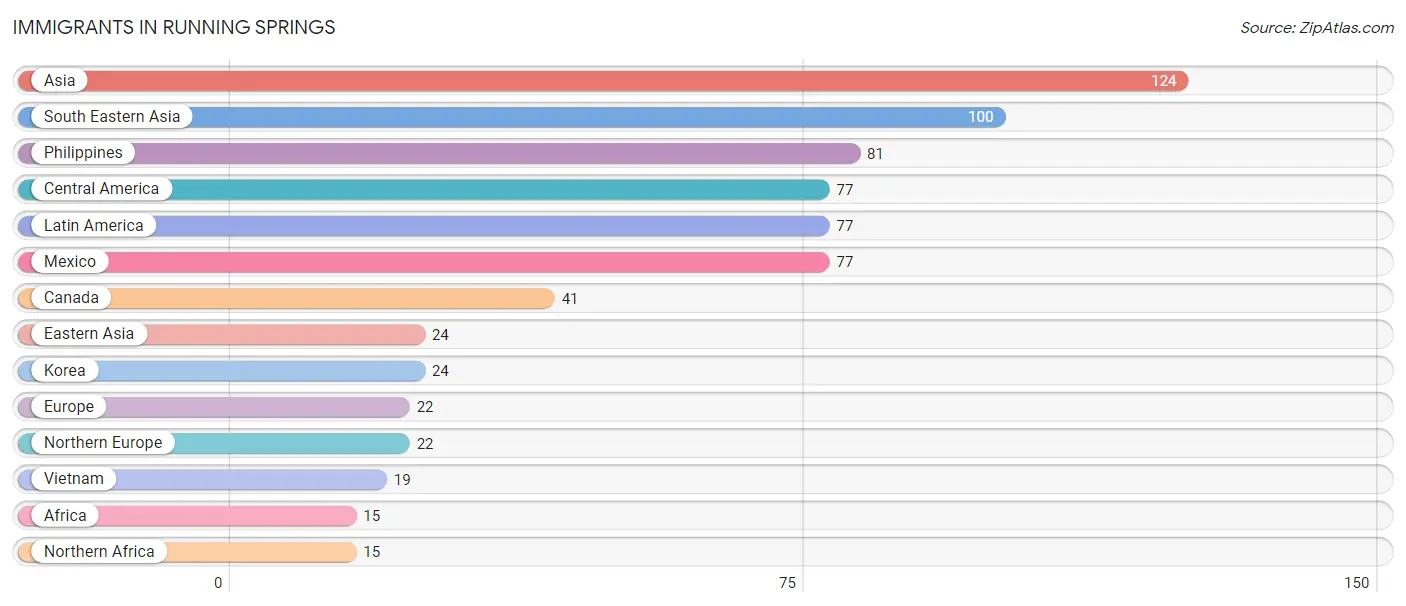
| Immigration Origin | # Population | % Population |
| Africa | 15 | 0.3% |
| Asia | 124 | 2.7% |
| Canada | 41 | 0.9% |
| Central America | 77 | 1.7% |
| Eastern Asia | 24 | 0.5% |
| Europe | 22 | 0.5% |
| Korea | 24 | 0.5% |
| Latin America | 77 | 1.7% |
| Mexico | 77 | 1.7% |
| Northern Africa | 15 | 0.3% |
| Northern Europe | 22 | 0.5% |
| Philippines | 81 | 1.8% |
| South Eastern Asia | 100 | 2.2% |
| Vietnam | 19 | 0.4% | View All 14 Rows |
Sex and Age in Running Springs
Sex and Age in Running Springs
The most populous age groups in Running Springs are 30 to 34 Years (193 | 8.6%) for men and Under 5 Years (239 | 10.2%) for women.
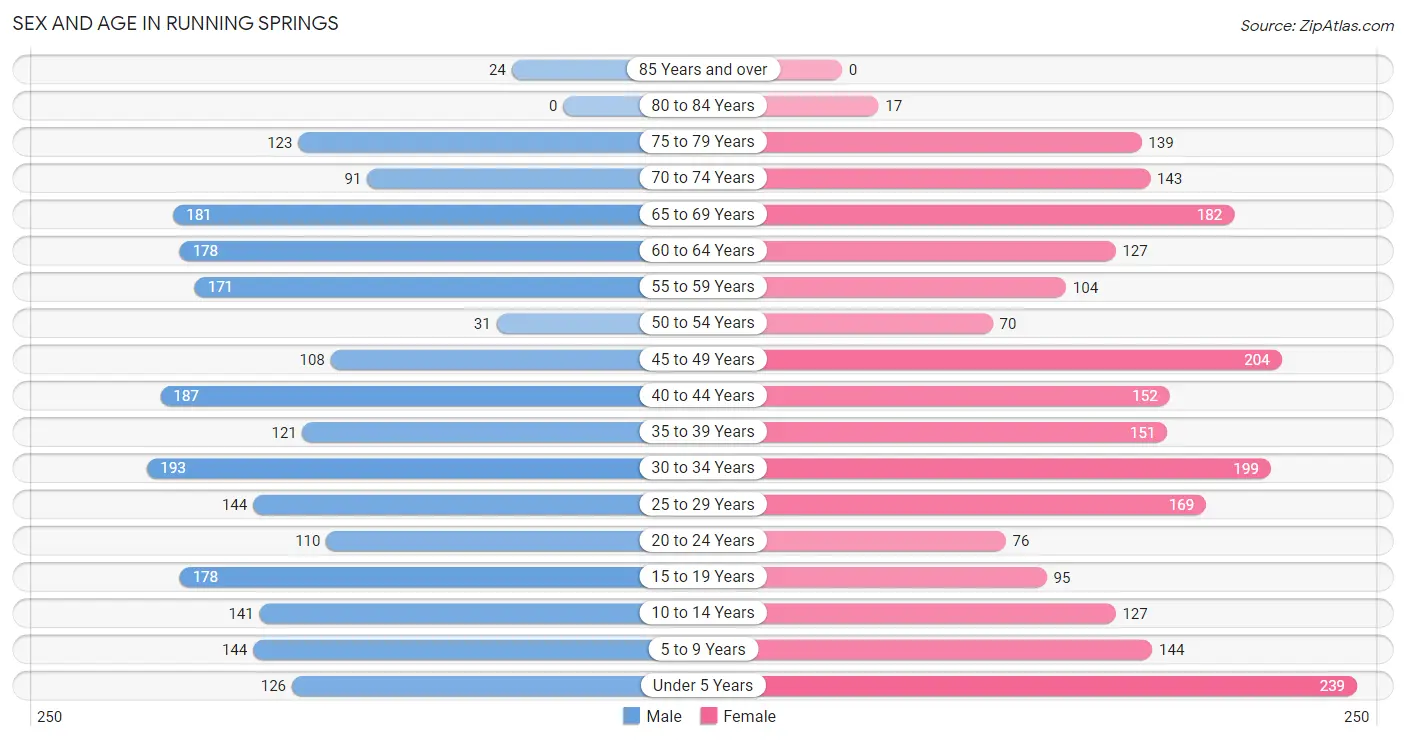
| Age Bracket | Male | Female |
| Under 5 Years | 126 (5.6%) | 239 (10.2%) |
| 5 to 9 Years | 144 (6.4%) | 144 (6.2%) |
| 10 to 14 Years | 141 (6.3%) | 127 (5.4%) |
| 15 to 19 Years | 178 (7.9%) | 95 (4.1%) |
| 20 to 24 Years | 110 (4.9%) | 76 (3.3%) |
| 25 to 29 Years | 144 (6.4%) | 169 (7.2%) |
| 30 to 34 Years | 193 (8.6%) | 199 (8.5%) |
| 35 to 39 Years | 121 (5.4%) | 151 (6.5%) |
| 40 to 44 Years | 187 (8.3%) | 152 (6.5%) |
| 45 to 49 Years | 108 (4.8%) | 204 (8.7%) |
| 50 to 54 Years | 31 (1.4%) | 70 (3.0%) |
| 55 to 59 Years | 171 (7.6%) | 104 (4.4%) |
| 60 to 64 Years | 178 (7.9%) | 127 (5.4%) |
| 65 to 69 Years | 181 (8.0%) | 182 (7.8%) |
| 70 to 74 Years | 91 (4.0%) | 143 (6.1%) |
| 75 to 79 Years | 123 (5.5%) | 139 (5.9%) |
| 80 to 84 Years | 0 (0.0%) | 17 (0.7%) |
| 85 Years and over | 24 (1.1%) | 0 (0.0%) |
| Total | 2,251 (100.0%) | 2,338 (100.0%) |
Families and Households in Running Springs
Median Family Size in Running Springs
The median family size in Running Springs is 3.13 persons per family, with married-couple families (968 | 79.3%) accounting for the largest median family size of 3.24 persons per family. On the other hand, single male/father families (82 | 6.7%) represent the smallest median family size with 2.57 persons per family.
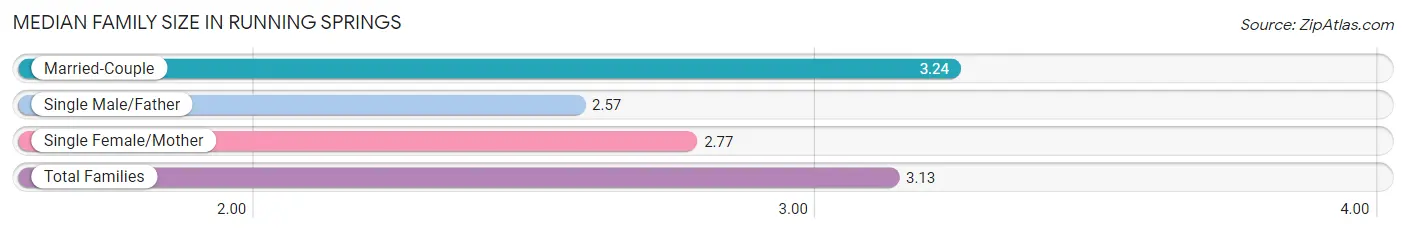
| Family Type | # Families | Family Size |
| Married-Couple | 968 (79.3%) | 3.24 |
| Single Male/Father | 82 (6.7%) | 2.57 |
| Single Female/Mother | 171 (14.0%) | 2.77 |
| Total Families | 1,221 (100.0%) | 3.13 |
Median Household Size in Running Springs
The median household size in Running Springs is 2.53 persons per household, with married-couple households (968 | 53.4%) accounting for the largest median household size of 3.24 persons per household. non-family households (591 | 32.6%) represent the smallest median household size with 1.20 persons per household.
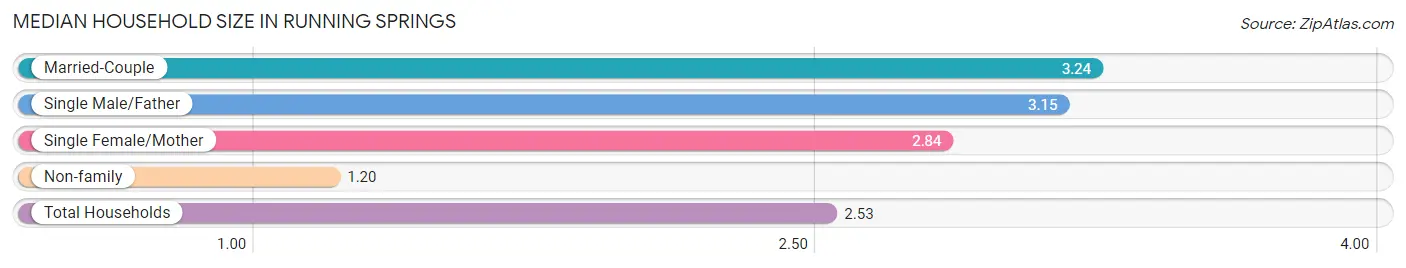
| Household Type | # Households | Household Size |
| Married-Couple | 968 (53.4%) | 3.24 |
| Single Male/Father | 82 (4.5%) | 3.15 |
| Single Female/Mother | 171 (9.4%) | 2.84 |
| Non-family | 591 (32.6%) | 1.20 |
| Total Households | 1,812 (100.0%) | 2.53 |
Household Size by Marriage Status in Running Springs
Out of a total of 1,812 households in Running Springs, 1,221 (67.4%) are family households, while 591 (32.6%) are nonfamily households. The most numerous type of family households are 2-person households, comprising 665, and the most common type of nonfamily households are 1-person households, comprising 503.
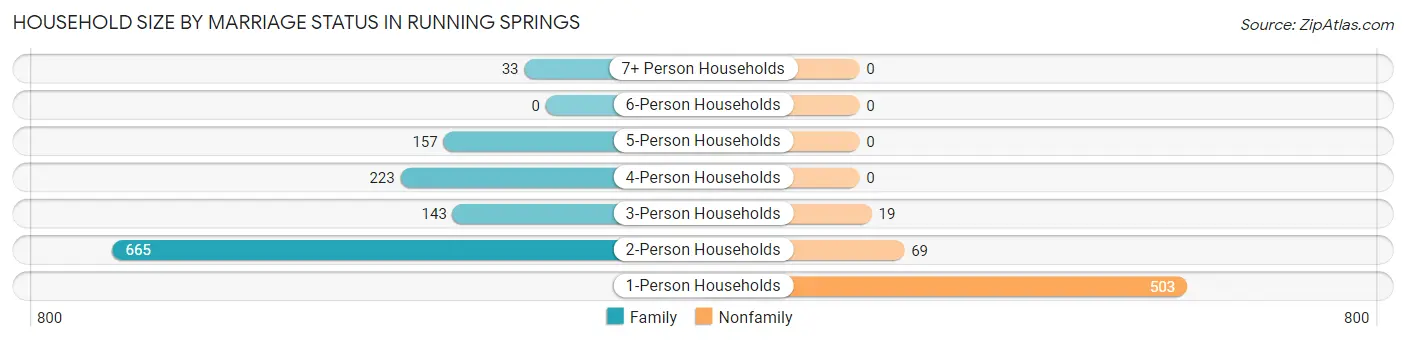
| Household Size | Family Households | Nonfamily Households |
| 1-Person Households | - | 503 (27.8%) |
| 2-Person Households | 665 (36.7%) | 69 (3.8%) |
| 3-Person Households | 143 (7.9%) | 19 (1.1%) |
| 4-Person Households | 223 (12.3%) | 0 (0.0%) |
| 5-Person Households | 157 (8.7%) | 0 (0.0%) |
| 6-Person Households | 0 (0.0%) | 0 (0.0%) |
| 7+ Person Households | 33 (1.8%) | 0 (0.0%) |
| Total | 1,221 (67.4%) | 591 (32.6%) |
Female Fertility in Running Springs
Fertility by Age in Running Springs
Average fertility rate in Running Springs is 115.0 births per 1,000 women. Women in the age bracket of 20 to 34 years have the highest fertility rate with 259.0 births per 1,000 women. Women in the age bracket of 20 to 34 years acount for 89.8% of all women with births.
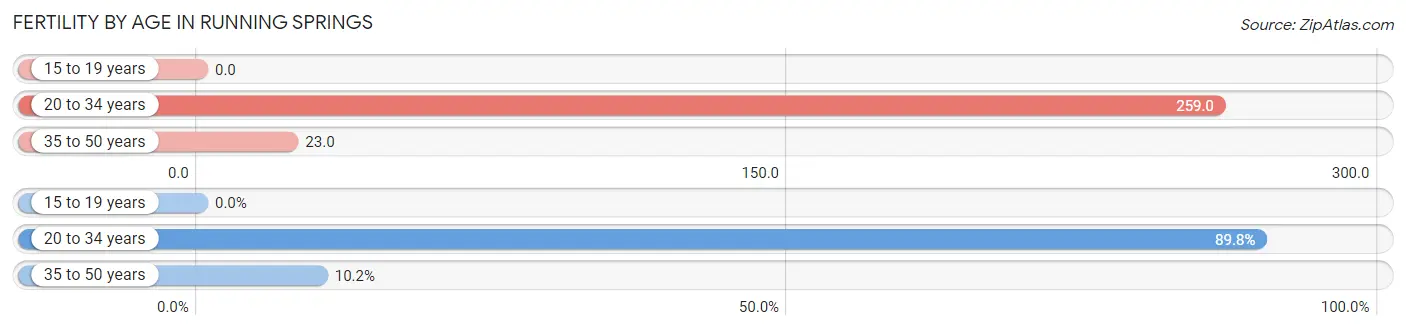
| Age Bracket | Women with Births | Births / 1,000 Women |
| 15 to 19 years | 0 (0.0%) | 0.0 |
| 20 to 34 years | 115 (89.8%) | 259.0 |
| 35 to 50 years | 13 (10.2%) | 23.0 |
| Total | 128 (100.0%) | 115.0 |
Fertility by Age by Marriage Status in Running Springs
90.6% of women with births (128) in Running Springs are married. The highest percentage of unmarried women with births falls into 20 to 34 years age bracket with 10.4% of them unmarried at the time of birth, while the lowest percentage of unmarried women with births belong to 35 to 50 years age bracket with 0.0% of them unmarried.
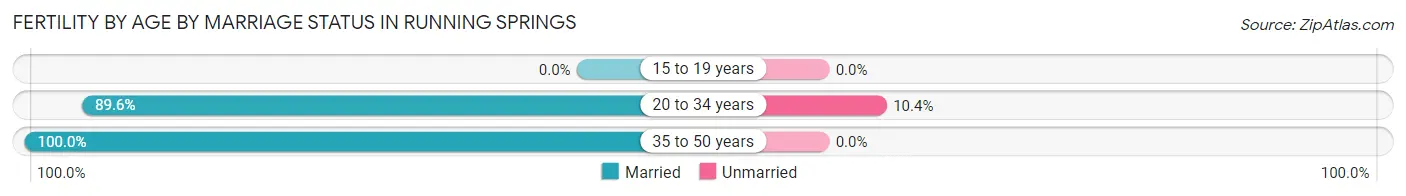
| Age Bracket | Married | Unmarried |
| 15 to 19 years | 0 (0.0%) | 0 (0.0%) |
| 20 to 34 years | 103 (89.6%) | 12 (10.4%) |
| 35 to 50 years | 13 (100.0%) | 0 (0.0%) |
| Total | 116 (90.6%) | 12 (9.4%) |
Fertility by Education in Running Springs
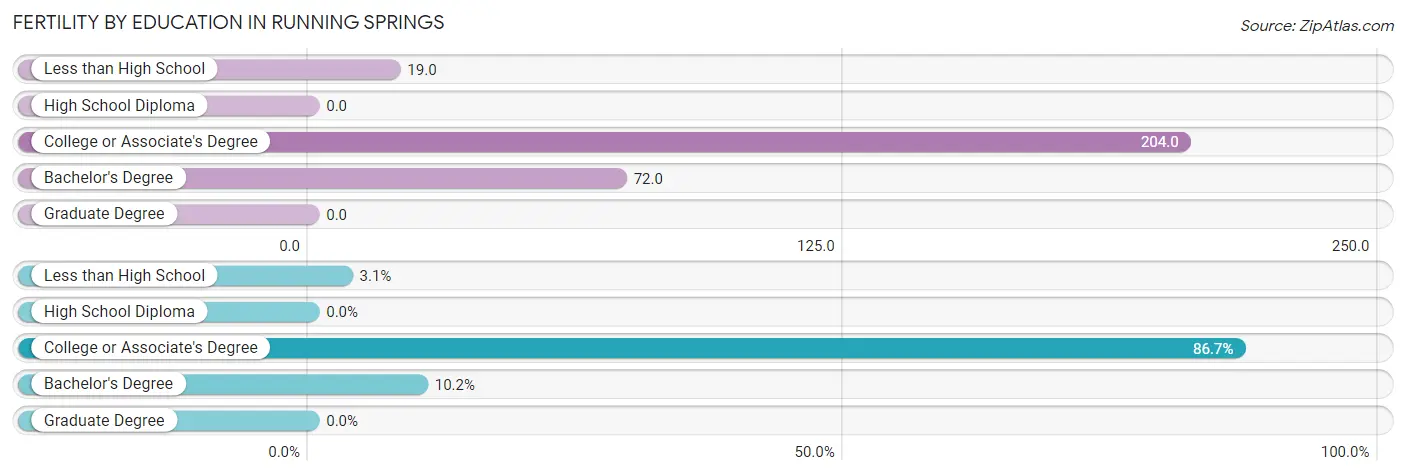
| Educational Attainment | Women with Births | Births / 1,000 Women |
| Less than High School | 4 (3.1%) | 19.0 |
| High School Diploma | 0 (0.0%) | 0.0 |
| College or Associate's Degree | 111 (86.7%) | 204.0 |
| Bachelor's Degree | 13 (10.2%) | 72.0 |
| Graduate Degree | 0 (0.0%) | 0.0 |
| Total | 128 (100.0%) | 115.0 |
Fertility by Education by Marriage Status in Running Springs
9.4% of women with births in Running Springs are unmarried. Women with the educational attainment of bachelor's degree are most likely to be married with 100.0% of them married at childbirth, while women with the educational attainment of less than high school are least likely to be married with 100.0% of them unmarried at childbirth.
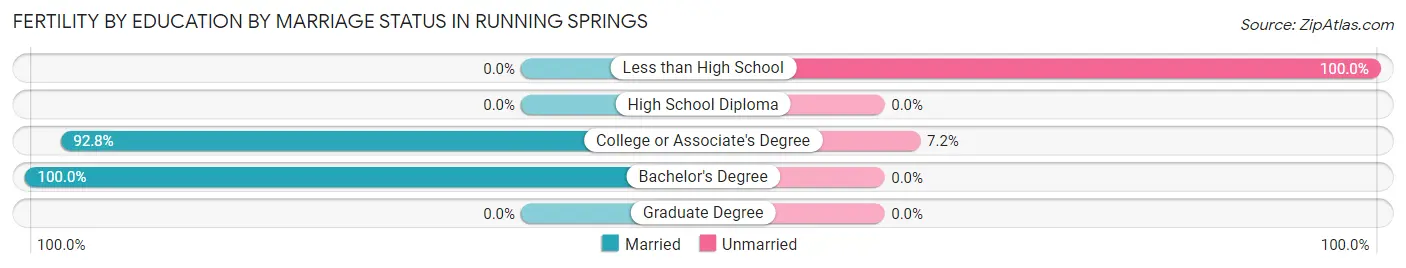
| Educational Attainment | Married | Unmarried |
| Less than High School | 0 (0.0%) | 4 (100.0%) |
| High School Diploma | 0 (0.0%) | 0 (0.0%) |
| College or Associate's Degree | 103 (92.8%) | 8 (7.2%) |
| Bachelor's Degree | 13 (100.0%) | 0 (0.0%) |
| Graduate Degree | 0 (0.0%) | 0 (0.0%) |
| Total | 116 (90.6%) | 12 (9.4%) |
Employment Characteristics in Running Springs
Employment by Class of Employer in Running Springs
Among the 2,142 employed individuals in Running Springs, private company employees (1,362 | 63.6%), local government employees (245 | 11.4%), and self-employed (not incorporated) (194 | 9.1%) make up the most common classes of employment.
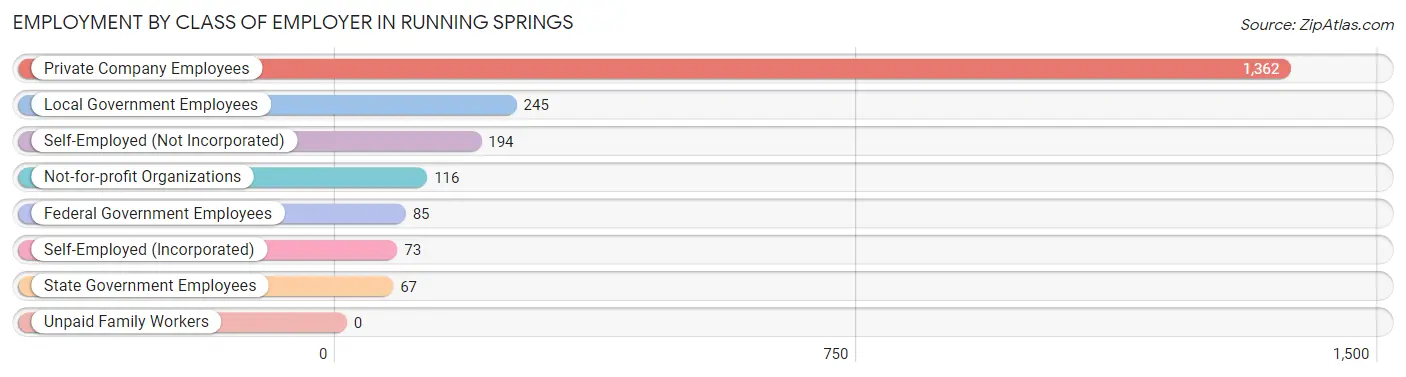
| Employer Class | # Employees | % Employees |
| Private Company Employees | 1,362 | 63.6% |
| Self-Employed (Incorporated) | 73 | 3.4% |
| Self-Employed (Not Incorporated) | 194 | 9.1% |
| Not-for-profit Organizations | 116 | 5.4% |
| Local Government Employees | 245 | 11.4% |
| State Government Employees | 67 | 3.1% |
| Federal Government Employees | 85 | 4.0% |
| Unpaid Family Workers | 0 | 0.0% |
| Total | 2,142 | 100.0% |
Employment Status by Age in Running Springs
According to the labor force statistics for Running Springs, out of the total population over 16 years of age (3,512), 64.9% or 2,279 individuals are in the labor force, with 4.3% or 98 of them unemployed. The age group with the highest labor force participation rate is 25 to 29 years, with 93.3% or 292 individuals in the labor force. Within the labor force, the 60 to 64 years age range has the highest percentage of unemployed individuals, with 13.3% or 20 of them being unemployed.
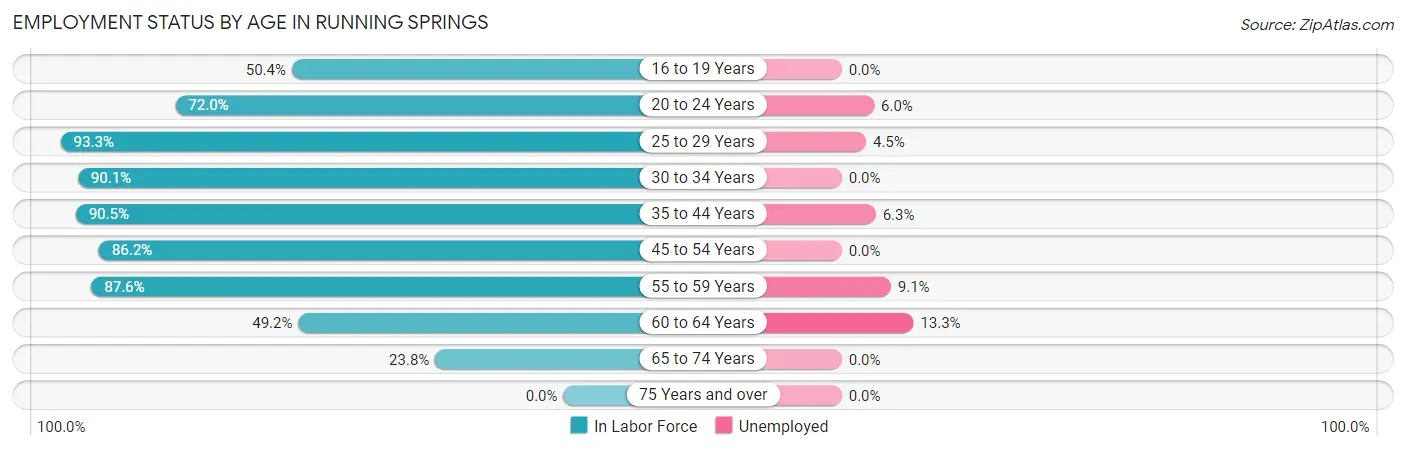
| Age Bracket | In Labor Force | Unemployed |
| 16 to 19 Years | 59 (50.4%) | 0 (0.0%) |
| 20 to 24 Years | 134 (72.0%) | 8 (6.0%) |
| 25 to 29 Years | 292 (93.3%) | 13 (4.5%) |
| 30 to 34 Years | 353 (90.1%) | 0 (0.0%) |
| 35 to 44 Years | 553 (90.5%) | 35 (6.3%) |
| 45 to 54 Years | 356 (86.2%) | 0 (0.0%) |
| 55 to 59 Years | 241 (87.6%) | 22 (9.1%) |
| 60 to 64 Years | 150 (49.2%) | 20 (13.3%) |
| 65 to 74 Years | 142 (23.8%) | 0 (0.0%) |
| 75 Years and over | 0 (0.0%) | 0 (0.0%) |
| Total | 2,279 (64.9%) | 98 (4.3%) |
Employment Status by Educational Attainment in Running Springs
According to labor force statistics for Running Springs, 84.2% of individuals (1,944) out of the total population between 25 and 64 years of age (2,309) are in the labor force, with 4.6% or 89 of them being unemployed. The group with the highest labor force participation rate are those with the educational attainment of bachelor's degree or higher, with 91.0% or 627 individuals in the labor force. Within the labor force, individuals with less than high school education have the highest percentage of unemployment, with 25.7% or 35 of them being unemployed.
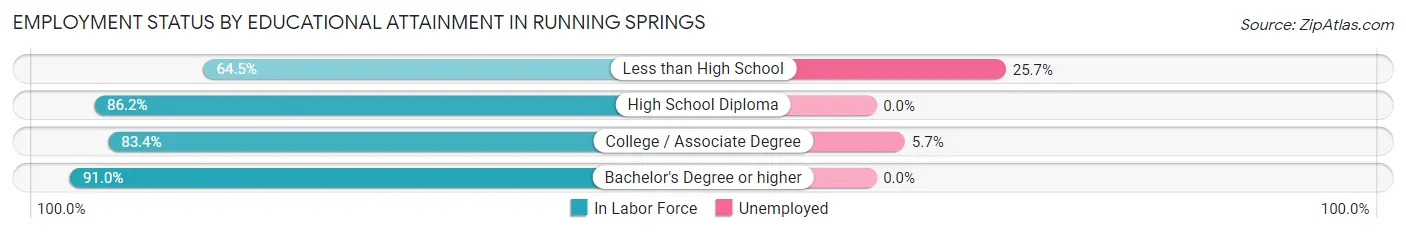
| Educational Attainment | In Labor Force | Unemployed |
| Less than High School | 136 (64.5%) | 54 (25.7%) |
| High School Diploma | 212 (86.2%) | 0 (0.0%) |
| College / Associate Degree | 970 (83.4%) | 66 (5.7%) |
| Bachelor's Degree or higher | 627 (91.0%) | 0 (0.0%) |
| Total | 1,944 (84.2%) | 106 (4.6%) |
Employment Occupations by Sex in Running Springs
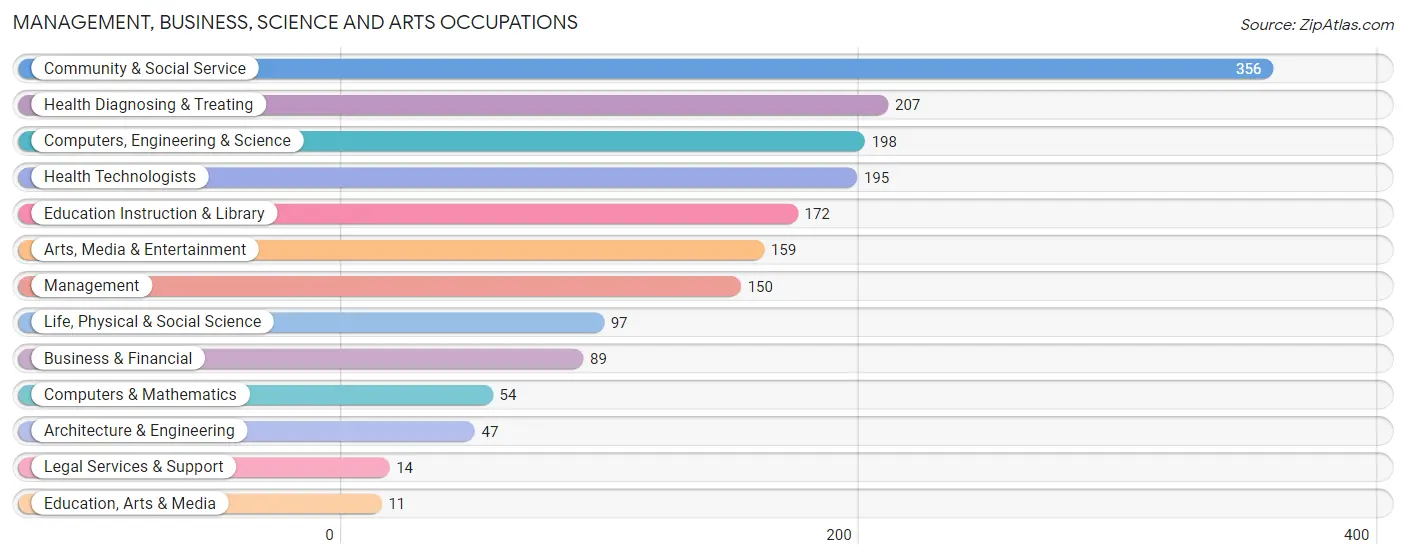
Management, Business, Science and Arts Occupations
The most common Management, Business, Science and Arts occupations in Running Springs are Community & Social Service (356 | 16.5%), Health Diagnosing & Treating (207 | 9.6%), Computers, Engineering & Science (198 | 9.2%), Health Technologists (195 | 9.0%), and Education Instruction & Library (172 | 8.0%).
Management, Business, Science and Arts Occupations by Sex
Within the Management, Business, Science and Arts occupations in Running Springs, the most male-oriented occupations are Architecture & Engineering (100.0%), Life, Physical & Social Science (79.4%), and Computers, Engineering & Science (78.8%), while the most female-oriented occupations are Education, Arts & Media (100.0%), Legal Services & Support (100.0%), and Health Technologists (83.1%).
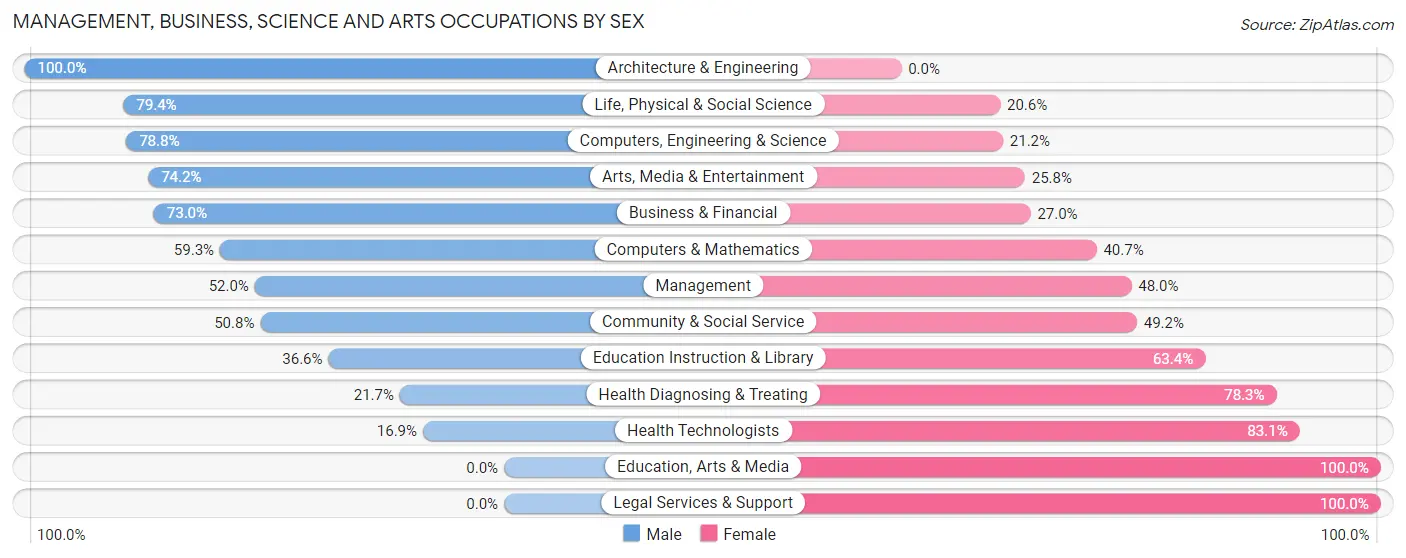
| Occupation | Male | Female |
| Management | 78 (52.0%) | 72 (48.0%) |
| Business & Financial | 65 (73.0%) | 24 (27.0%) |
| Computers, Engineering & Science | 156 (78.8%) | 42 (21.2%) |
| Computers & Mathematics | 32 (59.3%) | 22 (40.7%) |
| Architecture & Engineering | 47 (100.0%) | 0 (0.0%) |
| Life, Physical & Social Science | 77 (79.4%) | 20 (20.6%) |
| Community & Social Service | 181 (50.8%) | 175 (49.2%) |
| Education, Arts & Media | 0 (0.0%) | 11 (100.0%) |
| Legal Services & Support | 0 (0.0%) | 14 (100.0%) |
| Education Instruction & Library | 63 (36.6%) | 109 (63.4%) |
| Arts, Media & Entertainment | 118 (74.2%) | 41 (25.8%) |
| Health Diagnosing & Treating | 45 (21.7%) | 162 (78.3%) |
| Health Technologists | 33 (16.9%) | 162 (83.1%) |
| Total (Category) | 525 (52.5%) | 475 (47.5%) |
| Total (Overall) | 1,212 (56.1%) | 947 (43.9%) |
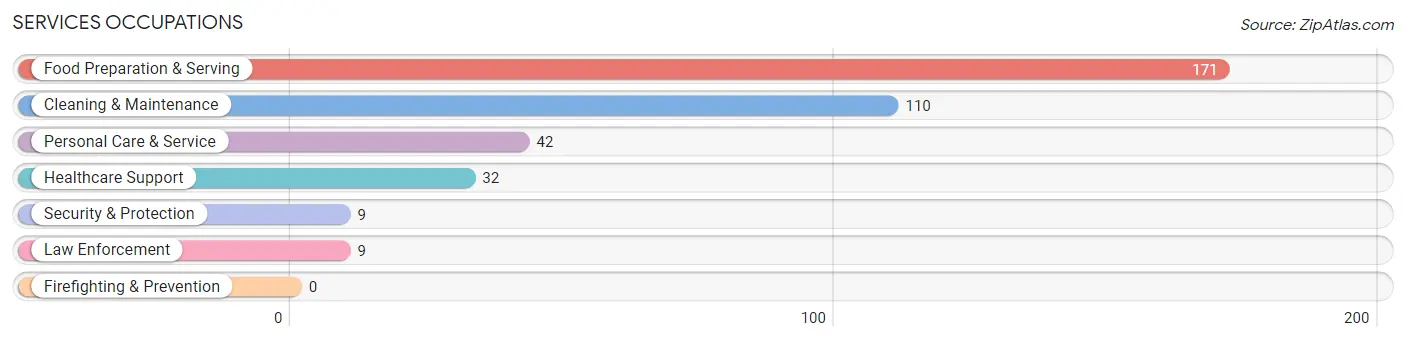
Services Occupations
The most common Services occupations in Running Springs are Food Preparation & Serving (171 | 7.9%), Cleaning & Maintenance (110 | 5.1%), Personal Care & Service (42 | 1.9%), Healthcare Support (32 | 1.5%), and Security & Protection (9 | 0.4%).
Services Occupations by Sex
Within the Services occupations in Running Springs, the most male-oriented occupations are Security & Protection (100.0%), Law Enforcement (100.0%), and Cleaning & Maintenance (100.0%), while the most female-oriented occupations are Healthcare Support (100.0%), Personal Care & Service (100.0%), and Food Preparation & Serving (83.0%).
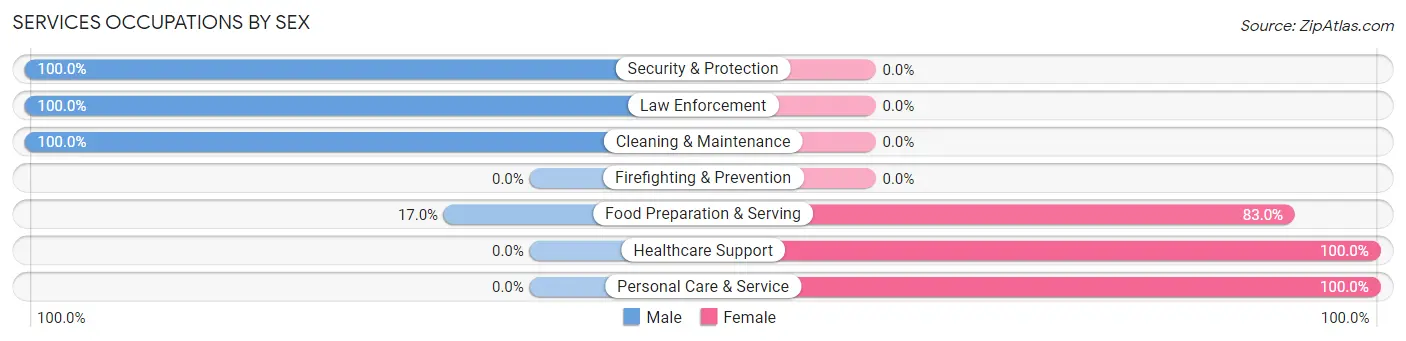
| Occupation | Male | Female |
| Healthcare Support | 0 (0.0%) | 32 (100.0%) |
| Security & Protection | 9 (100.0%) | 0 (0.0%) |
| Firefighting & Prevention | 0 (0.0%) | 0 (0.0%) |
| Law Enforcement | 9 (100.0%) | 0 (0.0%) |
| Food Preparation & Serving | 29 (17.0%) | 142 (83.0%) |
| Cleaning & Maintenance | 110 (100.0%) | 0 (0.0%) |
| Personal Care & Service | 0 (0.0%) | 42 (100.0%) |
| Total (Category) | 148 (40.7%) | 216 (59.3%) |
| Total (Overall) | 1,212 (56.1%) | 947 (43.9%) |
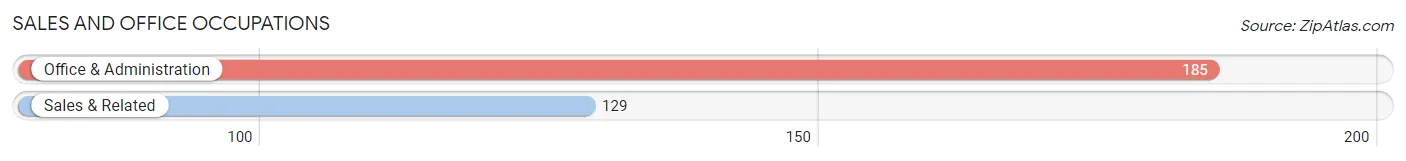
Sales and Office Occupations
The most common Sales and Office occupations in Running Springs are Office & Administration (185 | 8.6%), and Sales & Related (129 | 6.0%).
Sales and Office Occupations by Sex
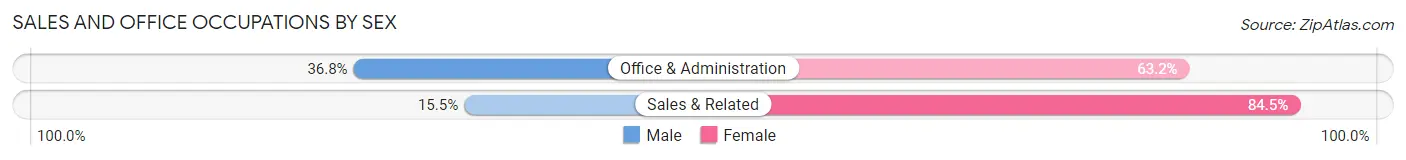
| Occupation | Male | Female |
| Sales & Related | 20 (15.5%) | 109 (84.5%) |
| Office & Administration | 68 (36.8%) | 117 (63.2%) |
| Total (Category) | 88 (28.0%) | 226 (72.0%) |
| Total (Overall) | 1,212 (56.1%) | 947 (43.9%) |
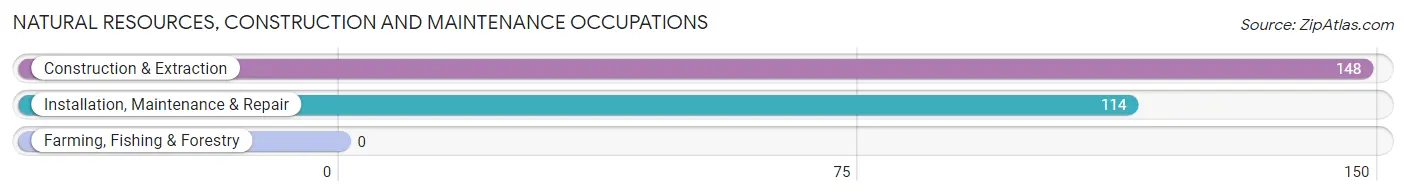
Natural Resources, Construction and Maintenance Occupations
The most common Natural Resources, Construction and Maintenance occupations in Running Springs are Construction & Extraction (148 | 6.9%), and Installation, Maintenance & Repair (114 | 5.3%).
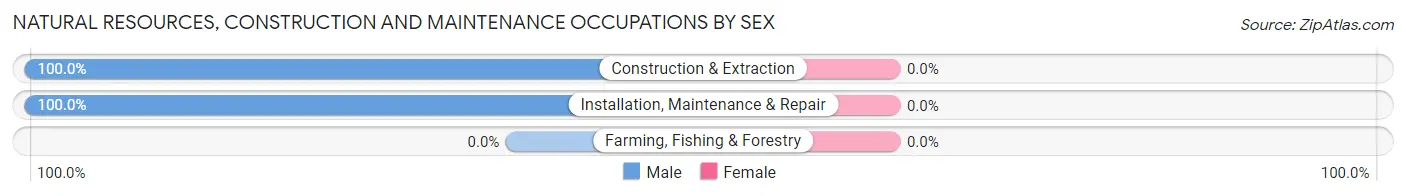
Natural Resources, Construction and Maintenance Occupations by Sex
| Occupation | Male | Female |
| Farming, Fishing & Forestry | 0 (0.0%) | 0 (0.0%) |
| Construction & Extraction | 148 (100.0%) | 0 (0.0%) |
| Installation, Maintenance & Repair | 114 (100.0%) | 0 (0.0%) |
| Total (Category) | 262 (100.0%) | 0 (0.0%) |
| Total (Overall) | 1,212 (56.1%) | 947 (43.9%) |
Production, Transportation and Moving Occupations
The most common Production, Transportation and Moving occupations in Running Springs are Material Moving (146 | 6.8%), and Transportation (73 | 3.4%).
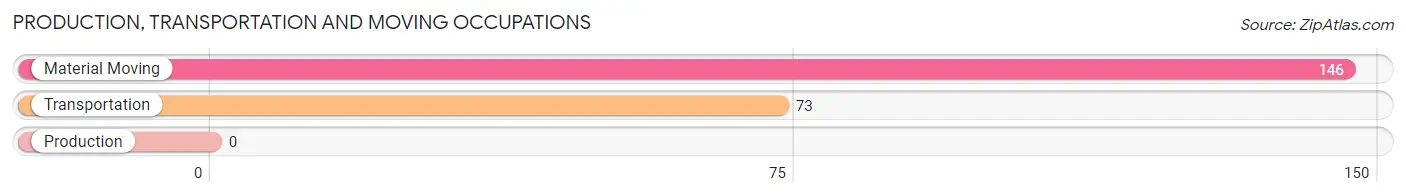
Production, Transportation and Moving Occupations by Sex
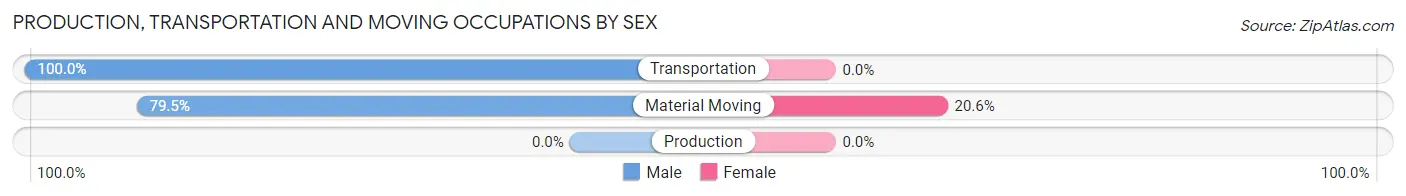
| Occupation | Male | Female |
| Production | 0 (0.0%) | 0 (0.0%) |
| Transportation | 73 (100.0%) | 0 (0.0%) |
| Material Moving | 116 (79.4%) | 30 (20.5%) |
| Total (Category) | 189 (86.3%) | 30 (13.7%) |
| Total (Overall) | 1,212 (56.1%) | 947 (43.9%) |
Employment Industries by Sex in Running Springs
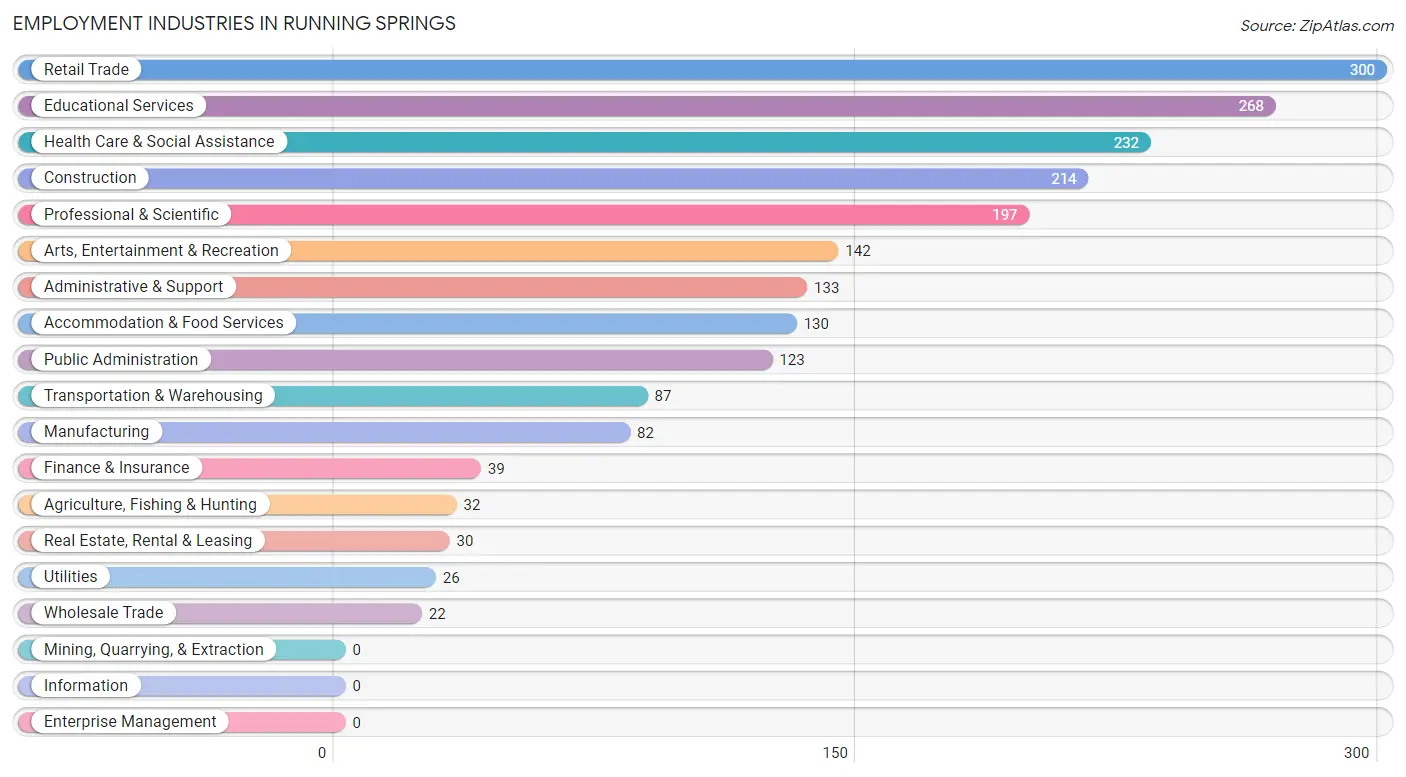
Employment Industries in Running Springs
The major employment industries in Running Springs include Retail Trade (300 | 13.9%), Educational Services (268 | 12.4%), Health Care & Social Assistance (232 | 10.7%), Construction (214 | 9.9%), and Professional & Scientific (197 | 9.1%).
Employment Industries by Sex in Running Springs
The Running Springs industries that see more men than women are Agriculture, Fishing & Hunting (100.0%), Wholesale Trade (100.0%), and Transportation & Warehousing (100.0%), whereas the industries that tend to have a higher number of women are Utilities (100.0%), Real Estate, Rental & Leasing (100.0%), and Health Care & Social Assistance (80.6%).
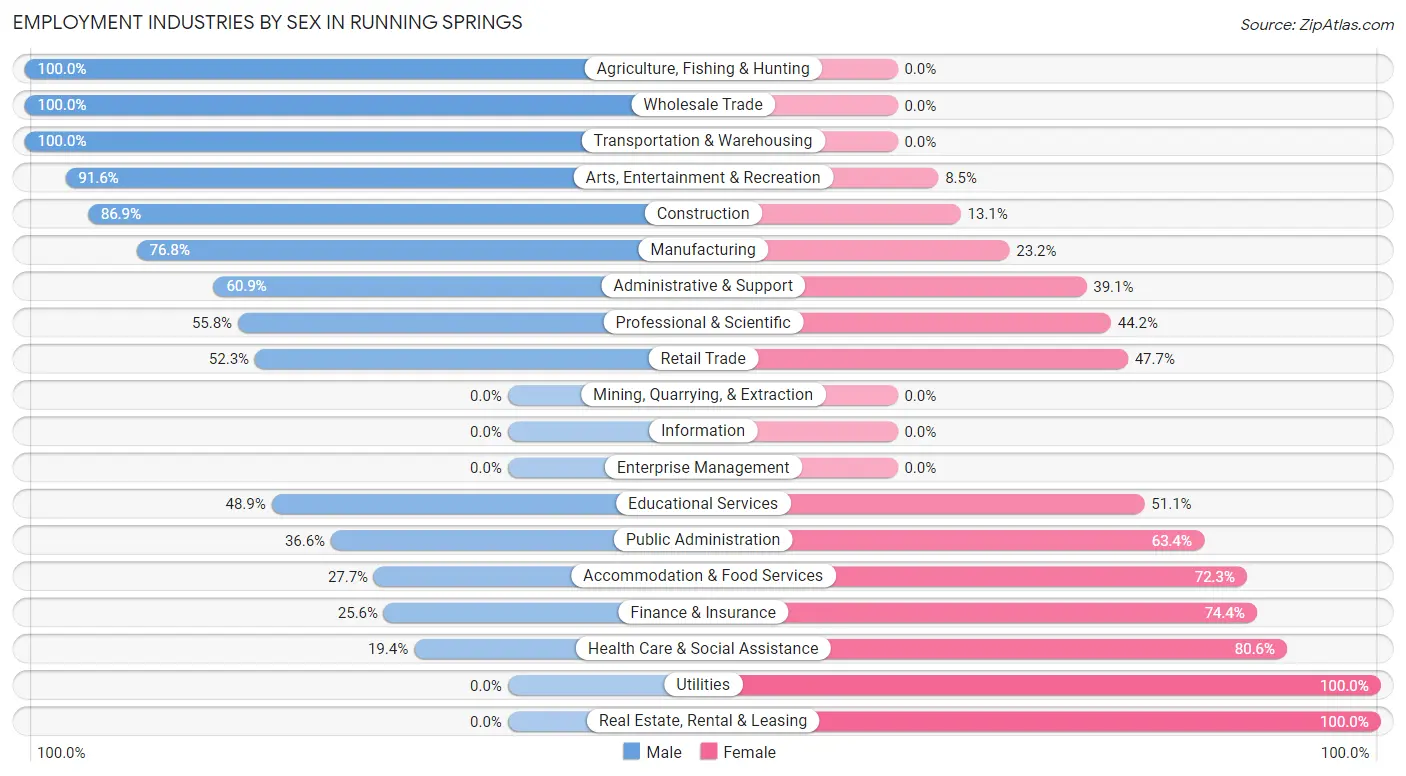
| Industry | Male | Female |
| Agriculture, Fishing & Hunting | 32 (100.0%) | 0 (0.0%) |
| Mining, Quarrying, & Extraction | 0 (0.0%) | 0 (0.0%) |
| Construction | 186 (86.9%) | 28 (13.1%) |
| Manufacturing | 63 (76.8%) | 19 (23.2%) |
| Wholesale Trade | 22 (100.0%) | 0 (0.0%) |
| Retail Trade | 157 (52.3%) | 143 (47.7%) |
| Transportation & Warehousing | 87 (100.0%) | 0 (0.0%) |
| Utilities | 0 (0.0%) | 26 (100.0%) |
| Information | 0 (0.0%) | 0 (0.0%) |
| Finance & Insurance | 10 (25.6%) | 29 (74.4%) |
| Real Estate, Rental & Leasing | 0 (0.0%) | 30 (100.0%) |
| Professional & Scientific | 110 (55.8%) | 87 (44.2%) |
| Enterprise Management | 0 (0.0%) | 0 (0.0%) |
| Administrative & Support | 81 (60.9%) | 52 (39.1%) |
| Educational Services | 131 (48.9%) | 137 (51.1%) |
| Health Care & Social Assistance | 45 (19.4%) | 187 (80.6%) |
| Arts, Entertainment & Recreation | 130 (91.5%) | 12 (8.5%) |
| Accommodation & Food Services | 36 (27.7%) | 94 (72.3%) |
| Public Administration | 45 (36.6%) | 78 (63.4%) |
| Total | 1,212 (56.1%) | 947 (43.9%) |
Education in Running Springs
School Enrollment in Running Springs
The most common levels of schooling among the 1,036 students in Running Springs are elementary school (250 | 24.1%), middle school (216 | 20.8%), and high school (204 | 19.7%).
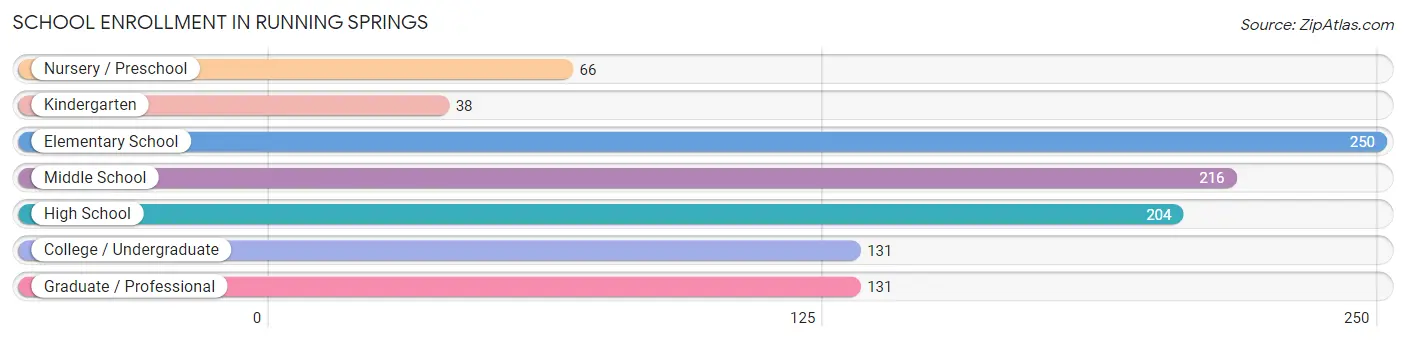
| School Level | # Students | % Students |
| Nursery / Preschool | 66 | 6.4% |
| Kindergarten | 38 | 3.7% |
| Elementary School | 250 | 24.1% |
| Middle School | 216 | 20.8% |
| High School | 204 | 19.7% |
| College / Undergraduate | 131 | 12.6% |
| Graduate / Professional | 131 | 12.6% |
| Total | 1,036 | 100.0% |
School Enrollment by Age by Funding Source in Running Springs
Out of a total of 1,036 students who are enrolled in schools in Running Springs, 104 (10.0%) attend a private institution, while the remaining 932 (90.0%) are enrolled in public schools. The age group of 35 years and over has the highest likelihood of being enrolled in private schools, with 85 (60.3% in the age bracket) enrolled. Conversely, the age group of 3 to 4 year olds has the lowest likelihood of being enrolled in a private school, with 14 (100.0% in the age bracket) attending a public institution.
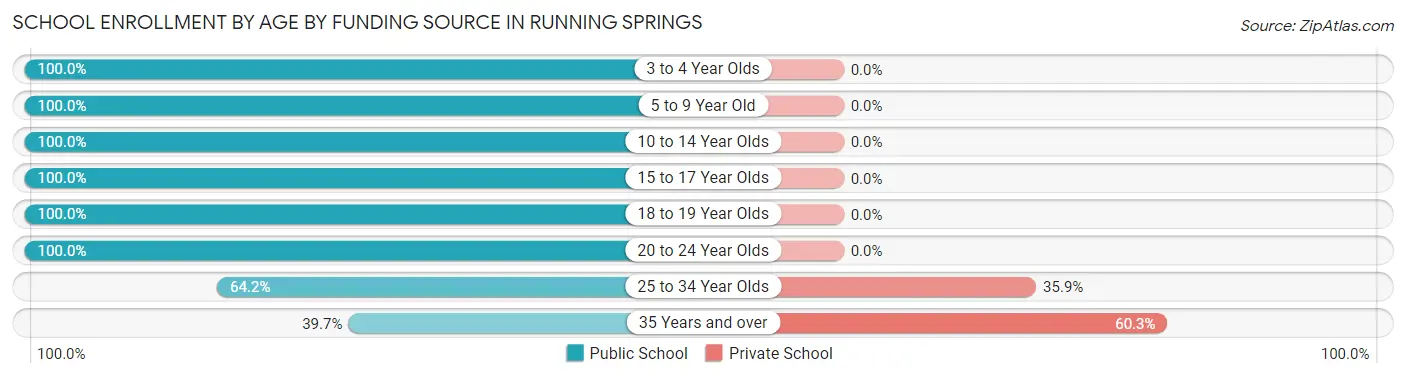
| Age Bracket | Public School | Private School |
| 3 to 4 Year Olds | 14 (100.0%) | 0 (0.0%) |
| 5 to 9 Year Old | 288 (100.0%) | 0 (0.0%) |
| 10 to 14 Year Olds | 268 (100.0%) | 0 (0.0%) |
| 15 to 17 Year Olds | 180 (100.0%) | 0 (0.0%) |
| 18 to 19 Year Olds | 24 (100.0%) | 0 (0.0%) |
| 20 to 24 Year Olds | 68 (100.0%) | 0 (0.0%) |
| 25 to 34 Year Olds | 34 (64.1%) | 19 (35.8%) |
| 35 Years and over | 56 (39.7%) | 85 (60.3%) |
| Total | 932 (90.0%) | 104 (10.0%) |
Educational Attainment by Field of Study in Running Springs
Science & technology (218 | 19.0%), business (147 | 12.8%), liberal arts & history (91 | 8.0%), education (90 | 7.9%), and arts & humanities (83 | 7.2%) are the most common fields of study among 1,145 individuals in Running Springs who have obtained a bachelor's degree or higher.
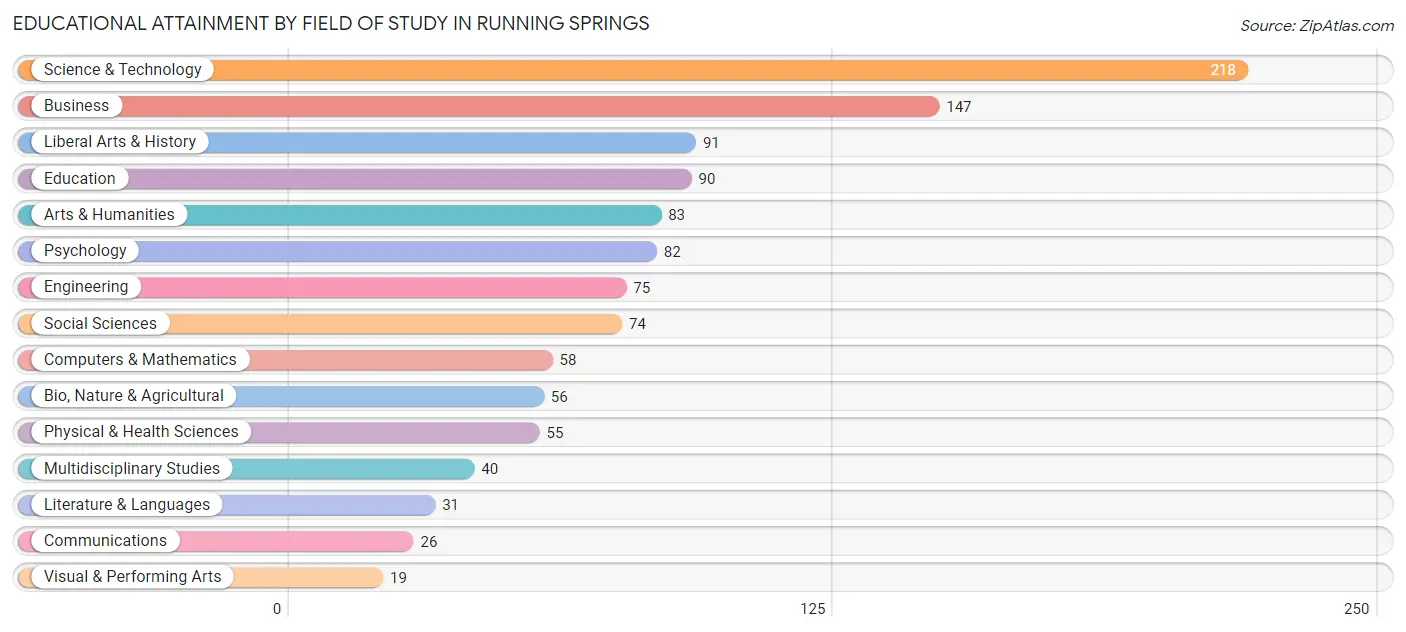
| Field of Study | # Graduates | % Graduates |
| Computers & Mathematics | 58 | 5.1% |
| Bio, Nature & Agricultural | 56 | 4.9% |
| Physical & Health Sciences | 55 | 4.8% |
| Psychology | 82 | 7.2% |
| Social Sciences | 74 | 6.5% |
| Engineering | 75 | 6.6% |
| Multidisciplinary Studies | 40 | 3.5% |
| Science & Technology | 218 | 19.0% |
| Business | 147 | 12.8% |
| Education | 90 | 7.9% |
| Literature & Languages | 31 | 2.7% |
| Liberal Arts & History | 91 | 8.0% |
| Visual & Performing Arts | 19 | 1.7% |
| Communications | 26 | 2.3% |
| Arts & Humanities | 83 | 7.2% |
| Total | 1,145 | 100.0% |
Transportation & Commute in Running Springs
Vehicle Availability by Sex in Running Springs
The most prevalent vehicle ownership categories in Running Springs are males with 2 vehicles (600, accounting for 50.2%) and females with 2 vehicles (450, making up 63.4%).
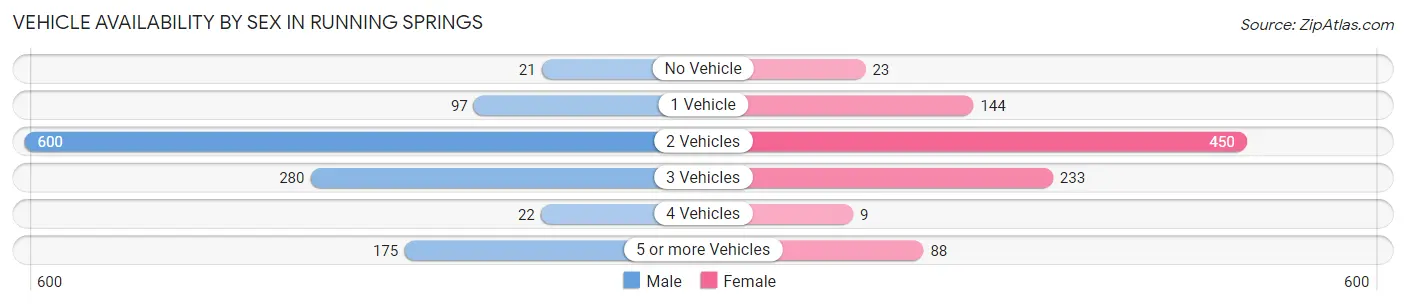
| Vehicles Available | Male | Female |
| No Vehicle | 21 (1.8%) | 23 (2.4%) |
| 1 Vehicle | 97 (8.1%) | 144 (15.2%) |
| 2 Vehicles | 600 (50.2%) | 450 (47.5%) |
| 3 Vehicles | 280 (23.4%) | 233 (24.6%) |
| 4 Vehicles | 22 (1.8%) | 9 (0.9%) |
| 5 or more Vehicles | 175 (14.6%) | 88 (9.3%) |
| Total | 1,195 (100.0%) | 947 (100.0%) |
Commute Time in Running Springs
The most frequently occuring commute durations in Running Springs are 15 to 19 minutes (288 commuters, 15.4%), 60 to 89 minutes (284 commuters, 15.2%), and 45 to 59 minutes (244 commuters, 13.1%).
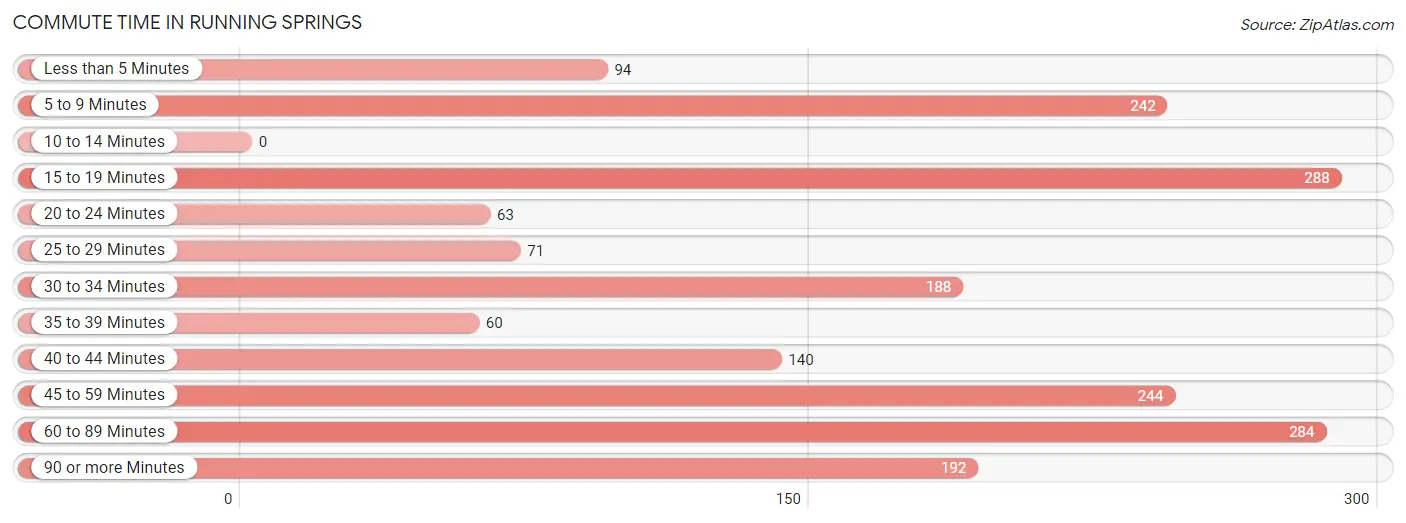
| Commute Time | # Commuters | % Commuters |
| Less than 5 Minutes | 94 | 5.0% |
| 5 to 9 Minutes | 242 | 13.0% |
| 10 to 14 Minutes | 0 | 0.0% |
| 15 to 19 Minutes | 288 | 15.4% |
| 20 to 24 Minutes | 63 | 3.4% |
| 25 to 29 Minutes | 71 | 3.8% |
| 30 to 34 Minutes | 188 | 10.1% |
| 35 to 39 Minutes | 60 | 3.2% |
| 40 to 44 Minutes | 140 | 7.5% |
| 45 to 59 Minutes | 244 | 13.1% |
| 60 to 89 Minutes | 284 | 15.2% |
| 90 or more Minutes | 192 | 10.3% |
Commute Time by Sex in Running Springs
The most common commute times in Running Springs are 90 or more minutes (154 commuters, 14.8%) for males and 5 to 9 minutes (165 commuters, 19.9%) for females.
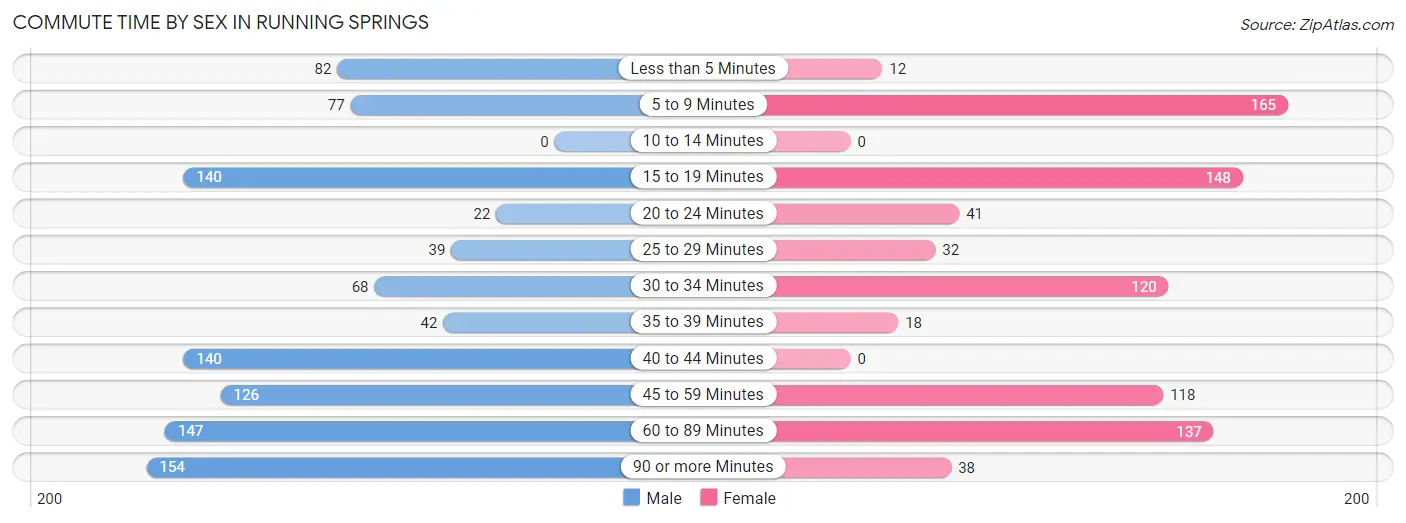
| Commute Time | Male | Female |
| Less than 5 Minutes | 82 (7.9%) | 12 (1.5%) |
| 5 to 9 Minutes | 77 (7.4%) | 165 (19.9%) |
| 10 to 14 Minutes | 0 (0.0%) | 0 (0.0%) |
| 15 to 19 Minutes | 140 (13.5%) | 148 (17.8%) |
| 20 to 24 Minutes | 22 (2.1%) | 41 (5.0%) |
| 25 to 29 Minutes | 39 (3.8%) | 32 (3.9%) |
| 30 to 34 Minutes | 68 (6.6%) | 120 (14.5%) |
| 35 to 39 Minutes | 42 (4.1%) | 18 (2.2%) |
| 40 to 44 Minutes | 140 (13.5%) | 0 (0.0%) |
| 45 to 59 Minutes | 126 (12.1%) | 118 (14.2%) |
| 60 to 89 Minutes | 147 (14.2%) | 137 (16.5%) |
| 90 or more Minutes | 154 (14.8%) | 38 (4.6%) |
Time of Departure to Work by Sex in Running Springs
The most frequent times of departure to work in Running Springs are 7:00 AM to 7:29 AM (231, 22.3%) for males and 8:00 AM to 8:29 AM (174, 21.0%) for females.
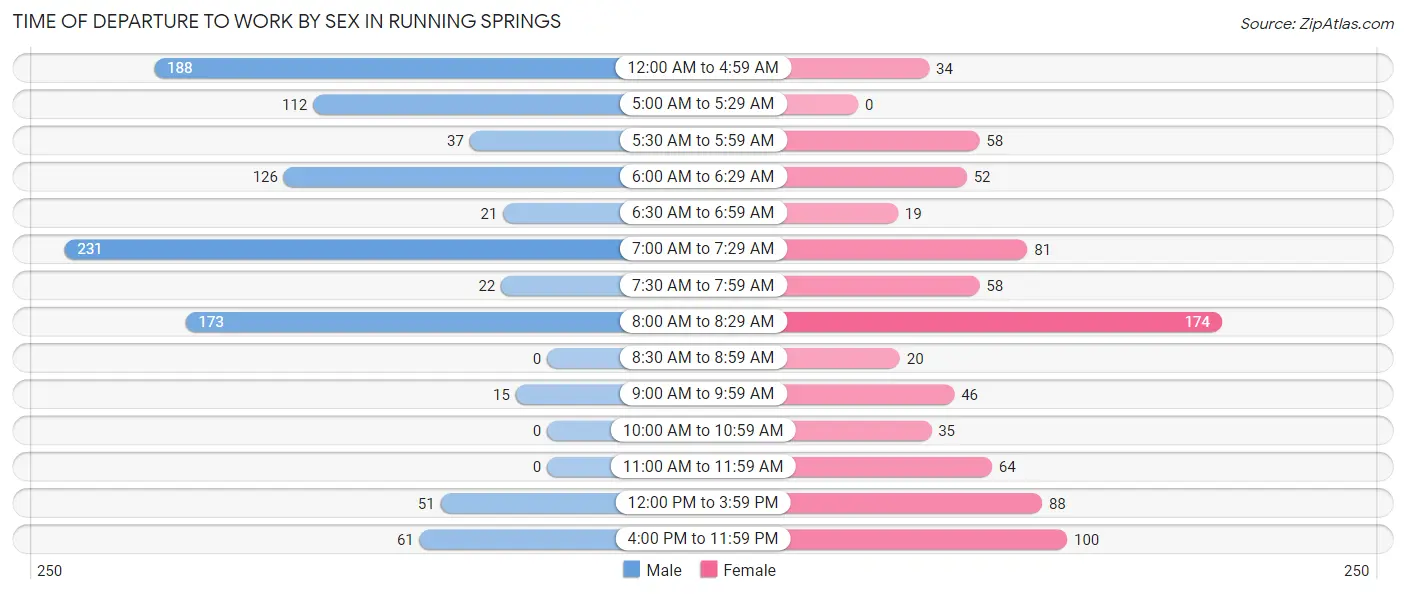
| Time of Departure | Male | Female |
| 12:00 AM to 4:59 AM | 188 (18.1%) | 34 (4.1%) |
| 5:00 AM to 5:29 AM | 112 (10.8%) | 0 (0.0%) |
| 5:30 AM to 5:59 AM | 37 (3.6%) | 58 (7.0%) |
| 6:00 AM to 6:29 AM | 126 (12.1%) | 52 (6.3%) |
| 6:30 AM to 6:59 AM | 21 (2.0%) | 19 (2.3%) |
| 7:00 AM to 7:29 AM | 231 (22.3%) | 81 (9.8%) |
| 7:30 AM to 7:59 AM | 22 (2.1%) | 58 (7.0%) |
| 8:00 AM to 8:29 AM | 173 (16.7%) | 174 (21.0%) |
| 8:30 AM to 8:59 AM | 0 (0.0%) | 20 (2.4%) |
| 9:00 AM to 9:59 AM | 15 (1.5%) | 46 (5.6%) |
| 10:00 AM to 10:59 AM | 0 (0.0%) | 35 (4.2%) |
| 11:00 AM to 11:59 AM | 0 (0.0%) | 64 (7.7%) |
| 12:00 PM to 3:59 PM | 51 (4.9%) | 88 (10.6%) |
| 4:00 PM to 11:59 PM | 61 (5.9%) | 100 (12.1%) |
| Total | 1,037 (100.0%) | 829 (100.0%) |
Housing Occupancy in Running Springs
Occupancy by Ownership in Running Springs
Of the total 1,812 dwellings in Running Springs, owner-occupied units account for 1,488 (82.1%), while renter-occupied units make up 324 (17.9%).
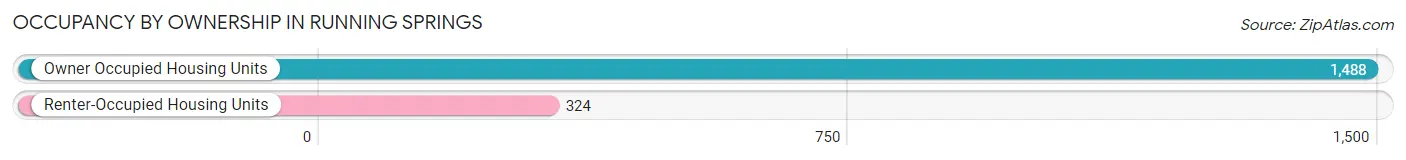
| Occupancy | # Housing Units | % Housing Units |
| Owner Occupied Housing Units | 1,488 | 82.1% |
| Renter-Occupied Housing Units | 324 | 17.9% |
| Total Occupied Housing Units | 1,812 | 100.0% |
Occupancy by Household Size in Running Springs
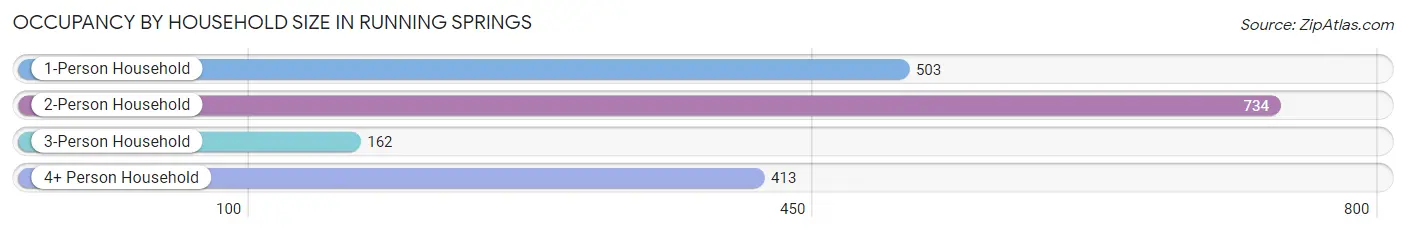
| Household Size | # Housing Units | % Housing Units |
| 1-Person Household | 503 | 27.8% |
| 2-Person Household | 734 | 40.5% |
| 3-Person Household | 162 | 8.9% |
| 4+ Person Household | 413 | 22.8% |
| Total Housing Units | 1,812 | 100.0% |
Occupancy by Ownership by Household Size in Running Springs
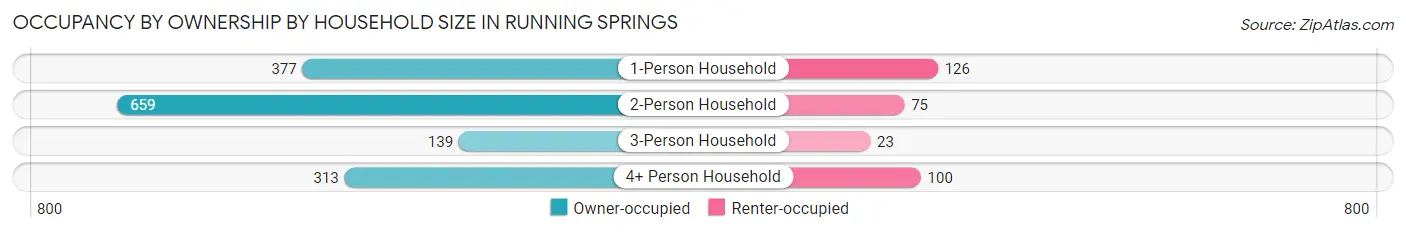
| Household Size | Owner-occupied | Renter-occupied |
| 1-Person Household | 377 (75.0%) | 126 (25.1%) |
| 2-Person Household | 659 (89.8%) | 75 (10.2%) |
| 3-Person Household | 139 (85.8%) | 23 (14.2%) |
| 4+ Person Household | 313 (75.8%) | 100 (24.2%) |
| Total Housing Units | 1,488 (82.1%) | 324 (17.9%) |
Occupancy by Educational Attainment in Running Springs
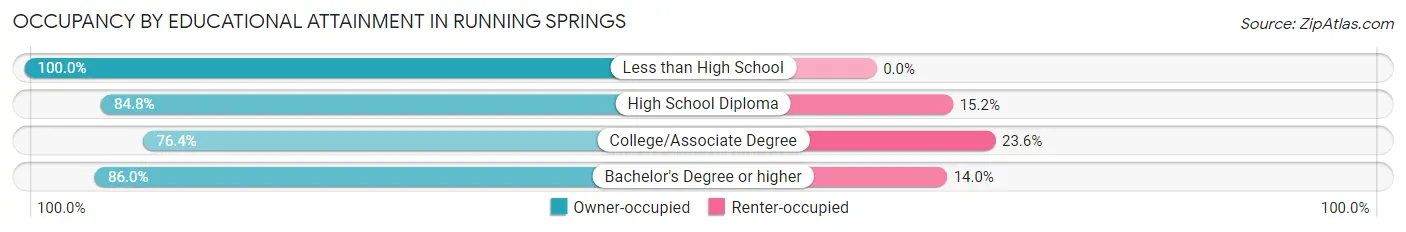
| Household Size | Owner-occupied | Renter-occupied |
| Less than High School | 116 (100.0%) | 0 (0.0%) |
| High School Diploma | 218 (84.8%) | 39 (15.2%) |
| College/Associate Degree | 668 (76.4%) | 206 (23.6%) |
| Bachelor's Degree or higher | 486 (86.0%) | 79 (14.0%) |
Occupancy by Age of Householder in Running Springs
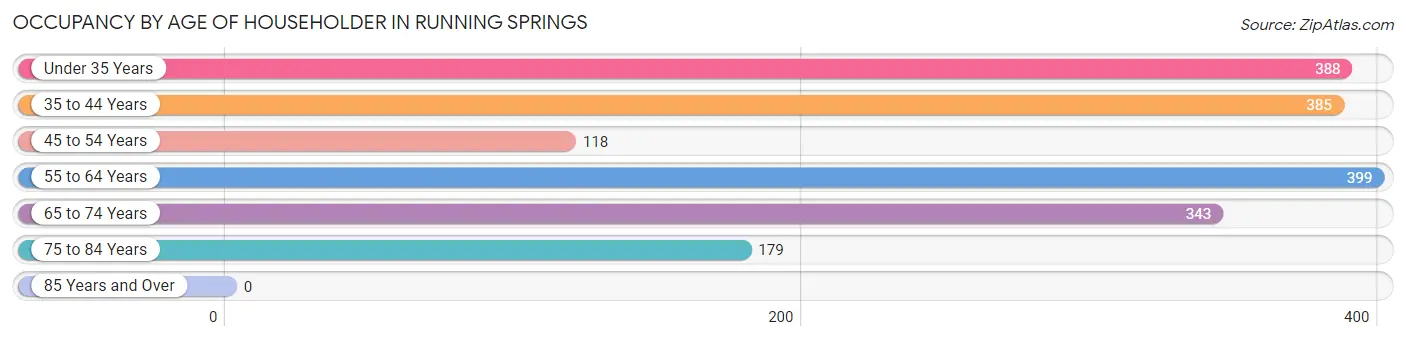
| Age Bracket | # Households | % Households |
| Under 35 Years | 388 | 21.4% |
| 35 to 44 Years | 385 | 21.2% |
| 45 to 54 Years | 118 | 6.5% |
| 55 to 64 Years | 399 | 22.0% |
| 65 to 74 Years | 343 | 18.9% |
| 75 to 84 Years | 179 | 9.9% |
| 85 Years and Over | 0 | 0.0% |
| Total | 1,812 | 100.0% |
Housing Finances in Running Springs
Median Income by Occupancy in Running Springs
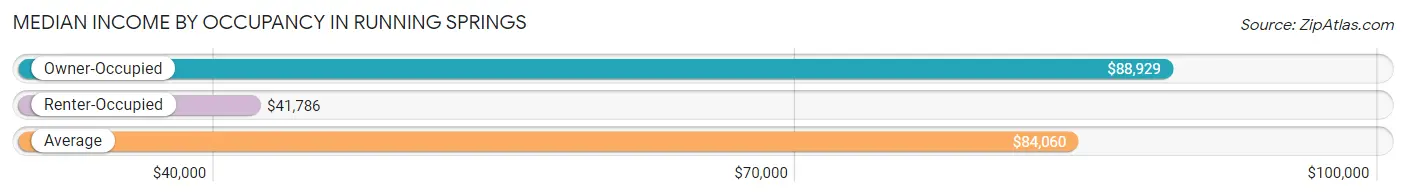
| Occupancy Type | # Households | Median Income |
| Owner-Occupied | 1,488 (82.1%) | $88,929 |
| Renter-Occupied | 324 (17.9%) | $41,786 |
| Average | 1,812 (100.0%) | $84,060 |
Occupancy by Householder Income Bracket in Running Springs
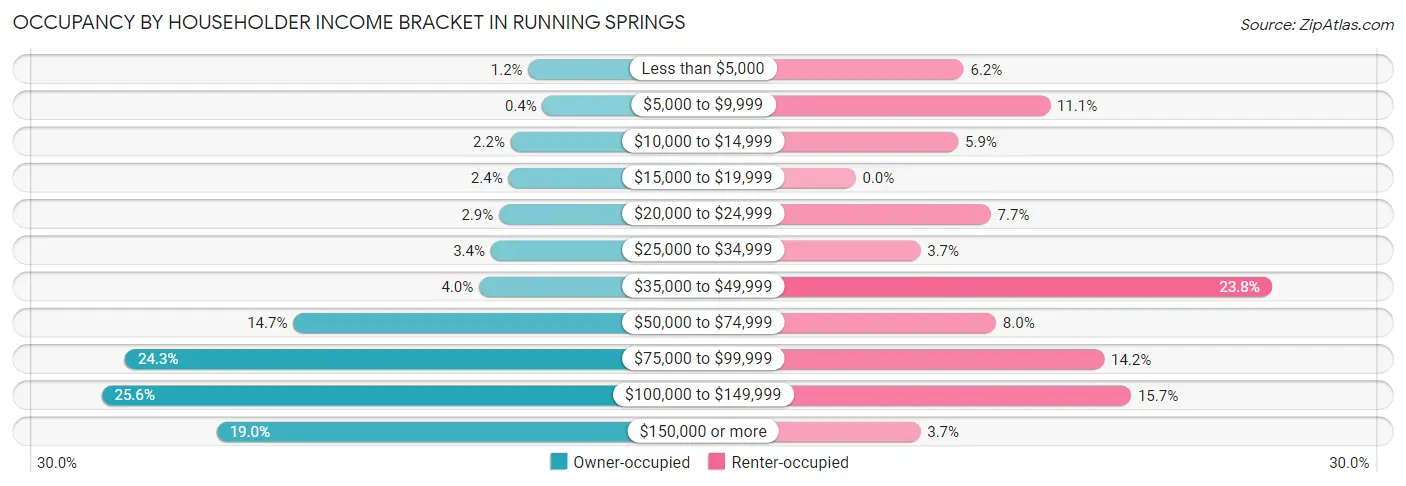
| Income Bracket | Owner-occupied | Renter-occupied |
| Less than $5,000 | 18 (1.2%) | 20 (6.2%) |
| $5,000 to $9,999 | 6 (0.4%) | 36 (11.1%) |
| $10,000 to $14,999 | 33 (2.2%) | 19 (5.9%) |
| $15,000 to $19,999 | 35 (2.4%) | 0 (0.0%) |
| $20,000 to $24,999 | 43 (2.9%) | 25 (7.7%) |
| $25,000 to $34,999 | 50 (3.4%) | 12 (3.7%) |
| $35,000 to $49,999 | 60 (4.0%) | 77 (23.8%) |
| $50,000 to $74,999 | 218 (14.6%) | 26 (8.0%) |
| $75,000 to $99,999 | 361 (24.3%) | 46 (14.2%) |
| $100,000 to $149,999 | 381 (25.6%) | 51 (15.7%) |
| $150,000 or more | 283 (19.0%) | 12 (3.7%) |
| Total | 1,488 (100.0%) | 324 (100.0%) |
Monthly Housing Cost Tiers in Running Springs
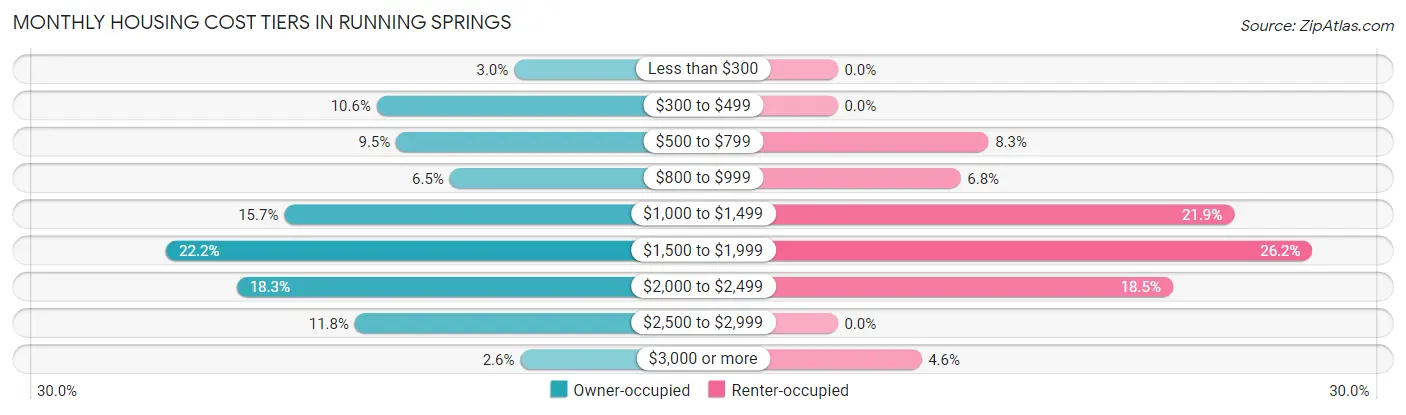
| Monthly Cost | Owner-occupied | Renter-occupied |
| Less than $300 | 44 (3.0%) | 0 (0.0%) |
| $300 to $499 | 157 (10.5%) | 0 (0.0%) |
| $500 to $799 | 141 (9.5%) | 27 (8.3%) |
| $800 to $999 | 97 (6.5%) | 22 (6.8%) |
| $1,000 to $1,499 | 233 (15.7%) | 71 (21.9%) |
| $1,500 to $1,999 | 330 (22.2%) | 85 (26.2%) |
| $2,000 to $2,499 | 272 (18.3%) | 60 (18.5%) |
| $2,500 to $2,999 | 175 (11.8%) | 0 (0.0%) |
| $3,000 or more | 39 (2.6%) | 15 (4.6%) |
| Total | 1,488 (100.0%) | 324 (100.0%) |
Physical Housing Characteristics in Running Springs
Housing Structures in Running Springs
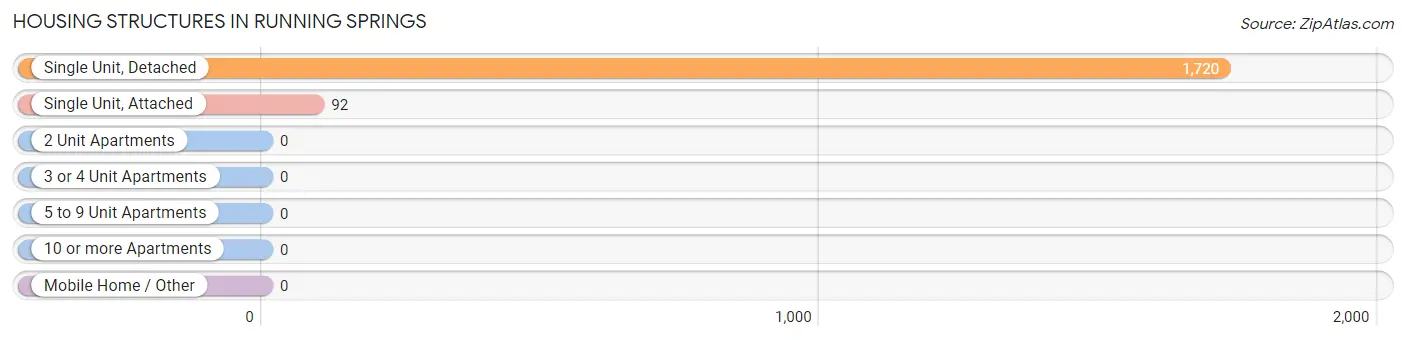
| Structure Type | # Housing Units | % Housing Units |
| Single Unit, Detached | 1,720 | 94.9% |
| Single Unit, Attached | 92 | 5.1% |
| 2 Unit Apartments | 0 | 0.0% |
| 3 or 4 Unit Apartments | 0 | 0.0% |
| 5 to 9 Unit Apartments | 0 | 0.0% |
| 10 or more Apartments | 0 | 0.0% |
| Mobile Home / Other | 0 | 0.0% |
| Total | 1,812 | 100.0% |
Housing Structures by Occupancy in Running Springs
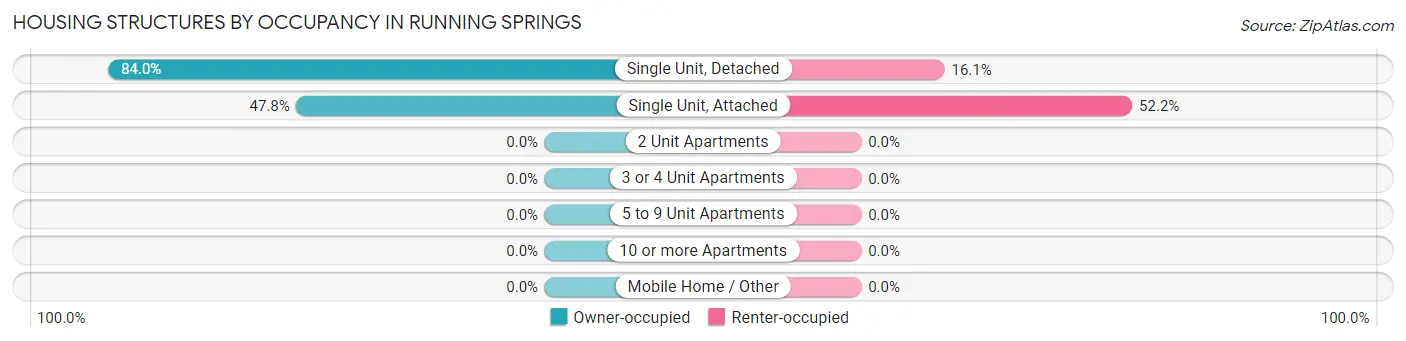
| Structure Type | Owner-occupied | Renter-occupied |
| Single Unit, Detached | 1,444 (84.0%) | 276 (16.1%) |
| Single Unit, Attached | 44 (47.8%) | 48 (52.2%) |
| 2 Unit Apartments | 0 (0.0%) | 0 (0.0%) |
| 3 or 4 Unit Apartments | 0 (0.0%) | 0 (0.0%) |
| 5 to 9 Unit Apartments | 0 (0.0%) | 0 (0.0%) |
| 10 or more Apartments | 0 (0.0%) | 0 (0.0%) |
| Mobile Home / Other | 0 (0.0%) | 0 (0.0%) |
| Total | 1,488 (82.1%) | 324 (17.9%) |
Housing Structures by Number of Rooms in Running Springs
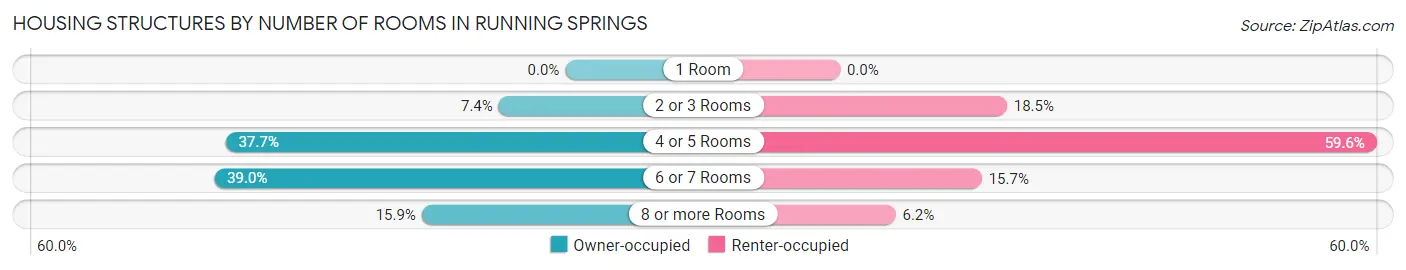
| Number of Rooms | Owner-occupied | Renter-occupied |
| 1 Room | 0 (0.0%) | 0 (0.0%) |
| 2 or 3 Rooms | 110 (7.4%) | 60 (18.5%) |
| 4 or 5 Rooms | 561 (37.7%) | 193 (59.6%) |
| 6 or 7 Rooms | 580 (39.0%) | 51 (15.7%) |
| 8 or more Rooms | 237 (15.9%) | 20 (6.2%) |
| Total | 1,488 (100.0%) | 324 (100.0%) |
Housing Structure by Heating Type in Running Springs
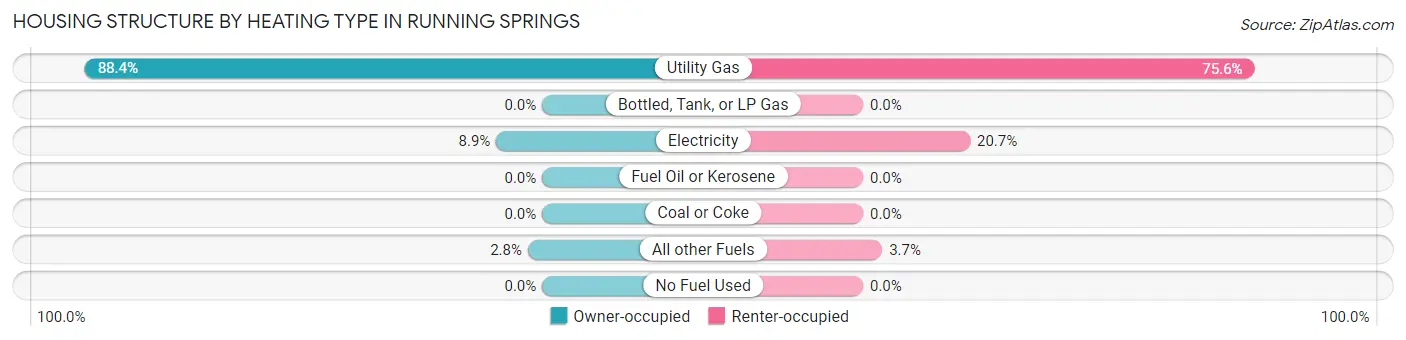
| Heating Type | Owner-occupied | Renter-occupied |
| Utility Gas | 1,315 (88.4%) | 245 (75.6%) |
| Bottled, Tank, or LP Gas | 0 (0.0%) | 0 (0.0%) |
| Electricity | 132 (8.9%) | 67 (20.7%) |
| Fuel Oil or Kerosene | 0 (0.0%) | 0 (0.0%) |
| Coal or Coke | 0 (0.0%) | 0 (0.0%) |
| All other Fuels | 41 (2.8%) | 12 (3.7%) |
| No Fuel Used | 0 (0.0%) | 0 (0.0%) |
| Total | 1,488 (100.0%) | 324 (100.0%) |
Household Vehicle Usage in Running Springs
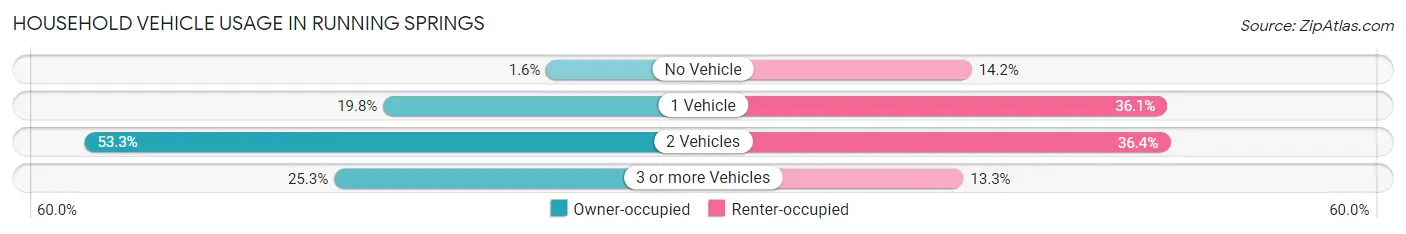
| Vehicles per Household | Owner-occupied | Renter-occupied |
| No Vehicle | 23 (1.5%) | 46 (14.2%) |
| 1 Vehicle | 295 (19.8%) | 117 (36.1%) |
| 2 Vehicles | 793 (53.3%) | 118 (36.4%) |
| 3 or more Vehicles | 377 (25.3%) | 43 (13.3%) |
| Total | 1,488 (100.0%) | 324 (100.0%) |
Real Estate & Mortgages in Running Springs
Real Estate and Mortgage Overview in Running Springs
| Characteristic | Without Mortgage | With Mortgage |
| Housing Units | 374 | 1,114 |
| Median Property Value | $335,700 | $340,800 |
| Median Household Income | $75,677 | $211 |
| Monthly Housing Costs | $499 | $39 |
| Real Estate Taxes | $1,417 | $23 |
Property Value by Mortgage Status in Running Springs
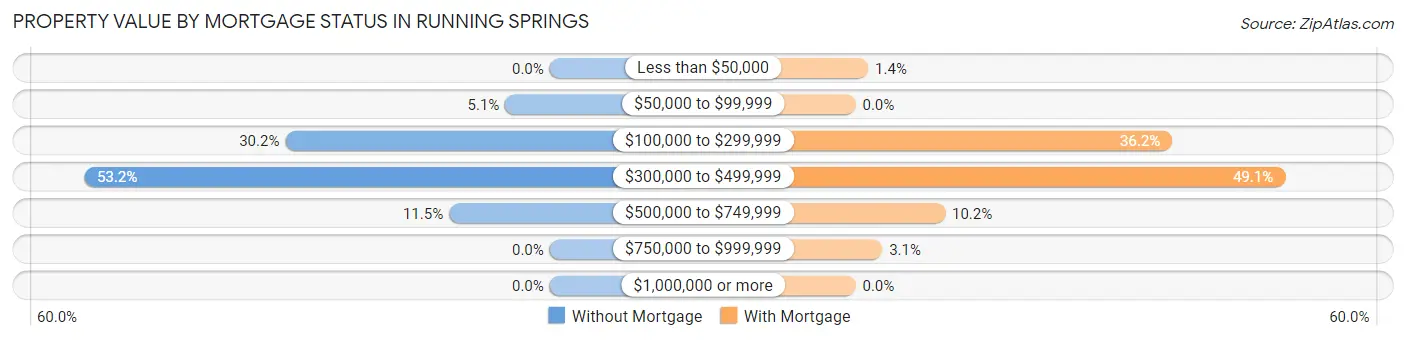
| Property Value | Without Mortgage | With Mortgage |
| Less than $50,000 | 0 (0.0%) | 16 (1.4%) |
| $50,000 to $99,999 | 19 (5.1%) | 0 (0.0%) |
| $100,000 to $299,999 | 113 (30.2%) | 403 (36.2%) |
| $300,000 to $499,999 | 199 (53.2%) | 547 (49.1%) |
| $500,000 to $749,999 | 43 (11.5%) | 114 (10.2%) |
| $750,000 to $999,999 | 0 (0.0%) | 34 (3.0%) |
| $1,000,000 or more | 0 (0.0%) | 0 (0.0%) |
| Total | 374 (100.0%) | 1,114 (100.0%) |
Household Income by Mortgage Status in Running Springs
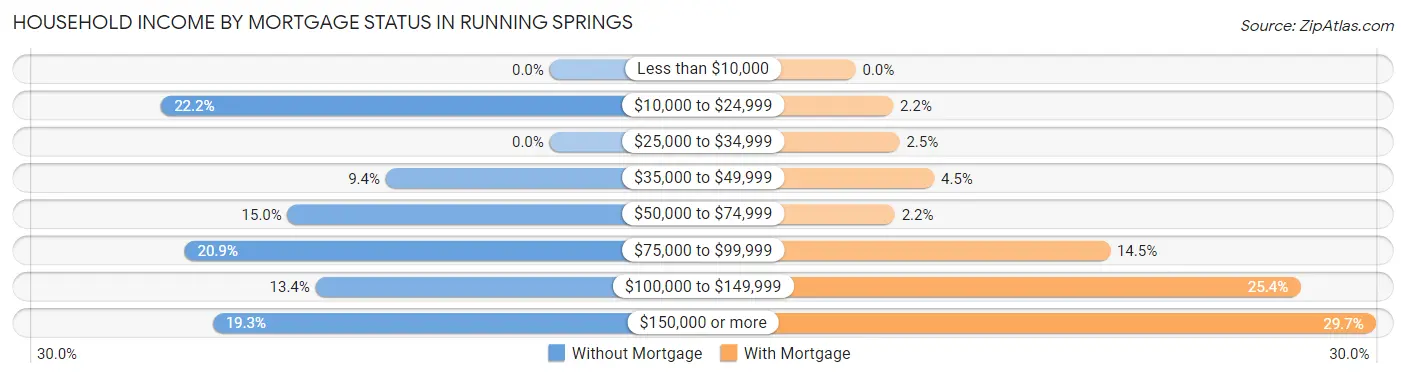
| Household Income | Without Mortgage | With Mortgage |
| Less than $10,000 | 0 (0.0%) | 0 (0.0%) |
| $10,000 to $24,999 | 83 (22.2%) | 24 (2.1%) |
| $25,000 to $34,999 | 0 (0.0%) | 28 (2.5%) |
| $35,000 to $49,999 | 35 (9.4%) | 50 (4.5%) |
| $50,000 to $74,999 | 56 (15.0%) | 25 (2.2%) |
| $75,000 to $99,999 | 78 (20.9%) | 162 (14.5%) |
| $100,000 to $149,999 | 50 (13.4%) | 283 (25.4%) |
| $150,000 or more | 72 (19.3%) | 331 (29.7%) |
| Total | 374 (100.0%) | 1,114 (100.0%) |
Property Value to Household Income Ratio in Running Springs
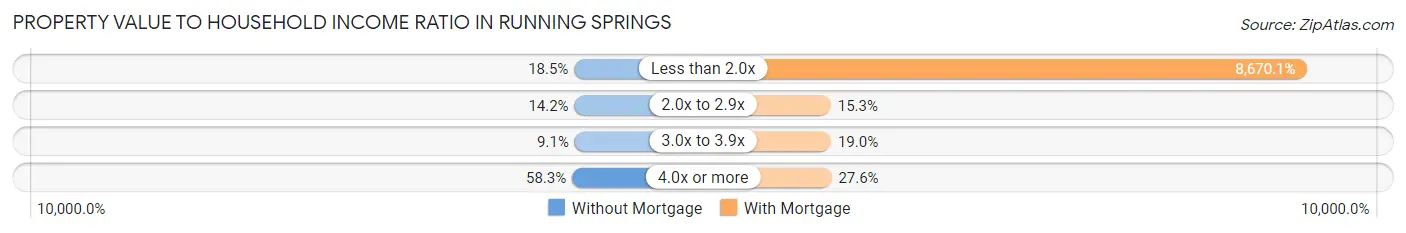
| Value-to-Income Ratio | Without Mortgage | With Mortgage |
| Less than 2.0x | 69 (18.4%) | 96,585 (8,670.1%) |
| 2.0x to 2.9x | 53 (14.2%) | 170 (15.3%) |
| 3.0x to 3.9x | 34 (9.1%) | 212 (19.0%) |
| 4.0x or more | 218 (58.3%) | 307 (27.6%) |
| Total | 374 (100.0%) | 1,114 (100.0%) |
Real Estate Taxes by Mortgage Status in Running Springs
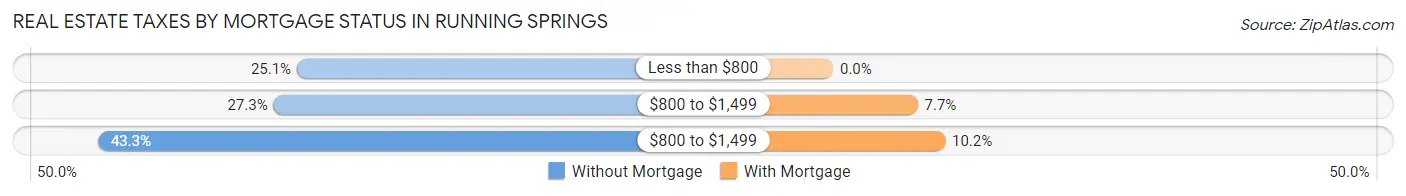
| Property Taxes | Without Mortgage | With Mortgage |
| Less than $800 | 94 (25.1%) | 0 (0.0%) |
| $800 to $1,499 | 102 (27.3%) | 86 (7.7%) |
| $800 to $1,499 | 162 (43.3%) | 114 (10.2%) |
| Total | 374 (100.0%) | 1,114 (100.0%) |
Health & Disability in Running Springs
Health Insurance Coverage by Age in Running Springs
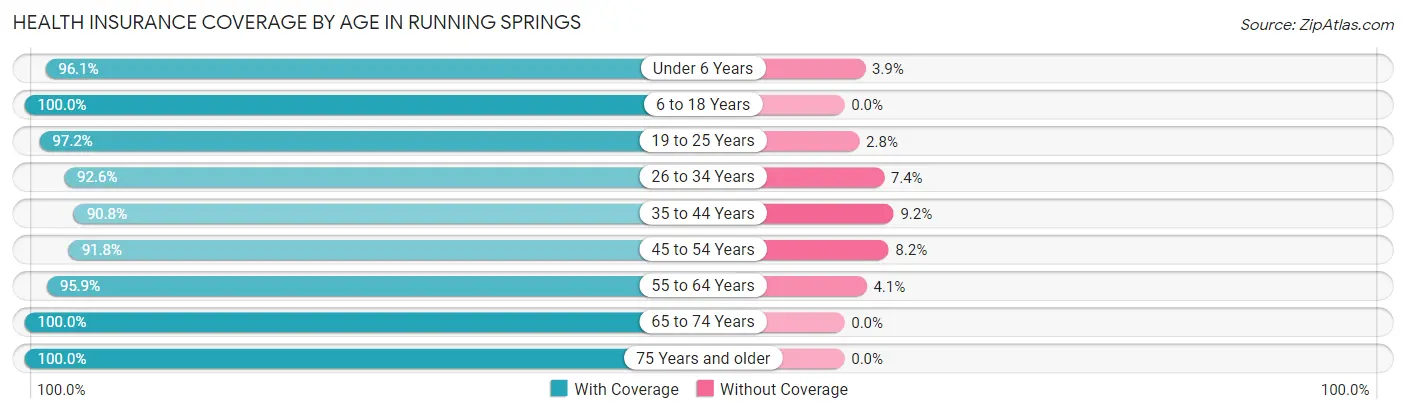
| Age Bracket | With Coverage | Without Coverage |
| Under 6 Years | 398 (96.1%) | 16 (3.9%) |
| 6 to 18 Years | 744 (100.0%) | 0 (0.0%) |
| 19 to 25 Years | 246 (97.2%) | 7 (2.8%) |
| 26 to 34 Years | 603 (92.6%) | 48 (7.4%) |
| 35 to 44 Years | 555 (90.8%) | 56 (9.2%) |
| 45 to 54 Years | 379 (91.8%) | 34 (8.2%) |
| 55 to 64 Years | 556 (95.9%) | 24 (4.1%) |
| 65 to 74 Years | 597 (100.0%) | 0 (0.0%) |
| 75 Years and older | 303 (100.0%) | 0 (0.0%) |
| Total | 4,381 (96.0%) | 185 (4.1%) |
Health Insurance Coverage by Citizenship Status in Running Springs
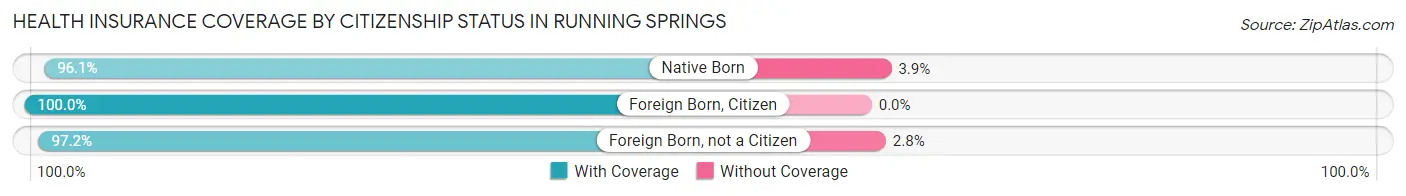
| Citizenship Status | With Coverage | Without Coverage |
| Native Born | 398 (96.1%) | 16 (3.9%) |
| Foreign Born, Citizen | 744 (100.0%) | 0 (0.0%) |
| Foreign Born, not a Citizen | 246 (97.2%) | 7 (2.8%) |
Health Insurance Coverage by Household Income in Running Springs
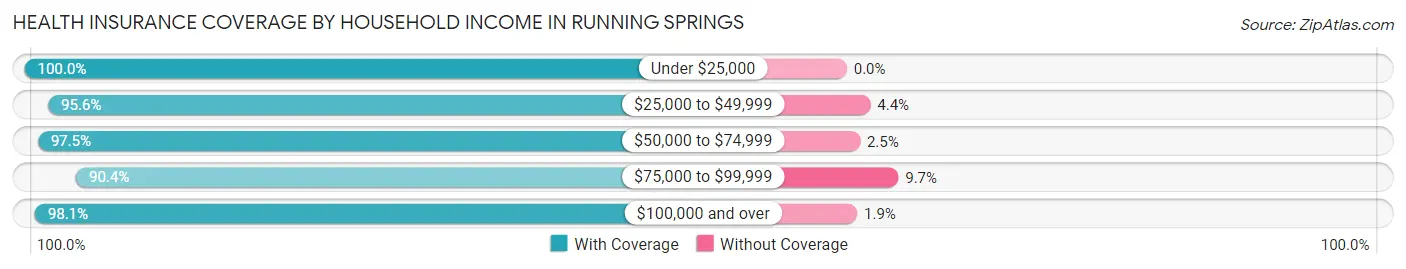
| Household Income | With Coverage | Without Coverage |
| Under $25,000 | 405 (100.0%) | 0 (0.0%) |
| $25,000 to $49,999 | 412 (95.6%) | 19 (4.4%) |
| $50,000 to $74,999 | 513 (97.5%) | 13 (2.5%) |
| $75,000 to $99,999 | 1,067 (90.3%) | 114 (9.7%) |
| $100,000 and over | 1,984 (98.1%) | 39 (1.9%) |
Public vs Private Health Insurance Coverage by Age in Running Springs
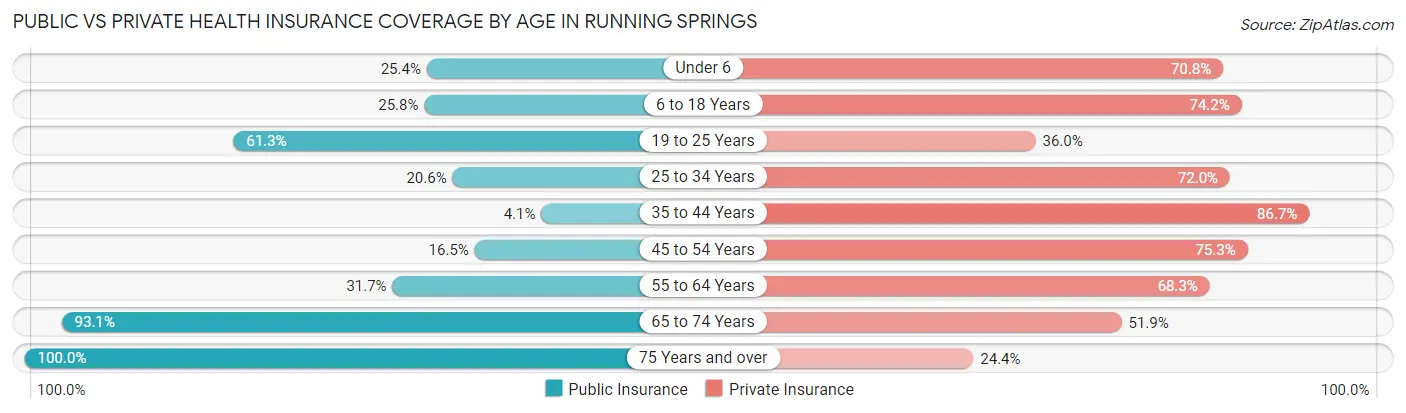
| Age Bracket | Public Insurance | Private Insurance |
| Under 6 | 105 (25.4%) | 293 (70.8%) |
| 6 to 18 Years | 192 (25.8%) | 552 (74.2%) |
| 19 to 25 Years | 155 (61.3%) | 91 (36.0%) |
| 25 to 34 Years | 134 (20.6%) | 469 (72.0%) |
| 35 to 44 Years | 25 (4.1%) | 530 (86.7%) |
| 45 to 54 Years | 68 (16.5%) | 311 (75.3%) |
| 55 to 64 Years | 184 (31.7%) | 396 (68.3%) |
| 65 to 74 Years | 556 (93.1%) | 310 (51.9%) |
| 75 Years and over | 303 (100.0%) | 74 (24.4%) |
| Total | 1,722 (37.7%) | 3,026 (66.3%) |
Disability Status by Sex by Age in Running Springs
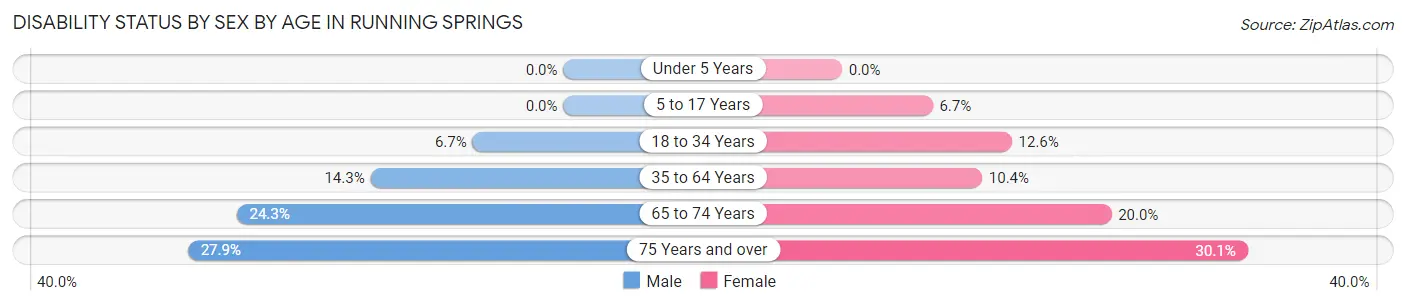
| Age Bracket | Male | Female |
| Under 5 Years | 0 (0.0%) | 0 (0.0%) |
| 5 to 17 Years | 0 (0.0%) | 23 (6.7%) |
| 18 to 34 Years | 31 (6.7%) | 59 (12.6%) |
| 35 to 64 Years | 114 (14.3%) | 84 (10.4%) |
| 65 to 74 Years | 66 (24.3%) | 65 (20.0%) |
| 75 Years and over | 41 (27.9%) | 47 (30.1%) |
Disability Class by Sex by Age in Running Springs
Disability Class: Hearing Difficulty
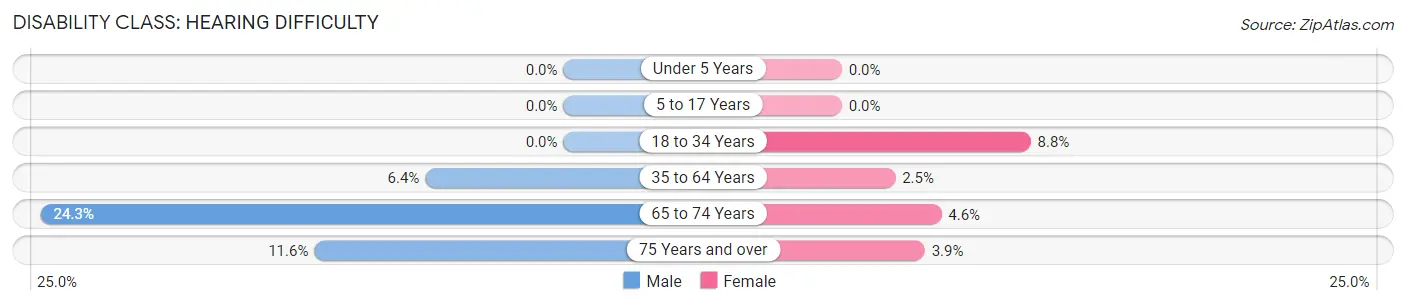
| Age Bracket | Male | Female |
| Under 5 Years | 0 (0.0%) | 0 (0.0%) |
| 5 to 17 Years | 0 (0.0%) | 0 (0.0%) |
| 18 to 34 Years | 0 (0.0%) | 41 (8.8%) |
| 35 to 64 Years | 51 (6.4%) | 20 (2.5%) |
| 65 to 74 Years | 66 (24.3%) | 15 (4.6%) |
| 75 Years and over | 17 (11.6%) | 6 (3.8%) |
Disability Class: Vision Difficulty
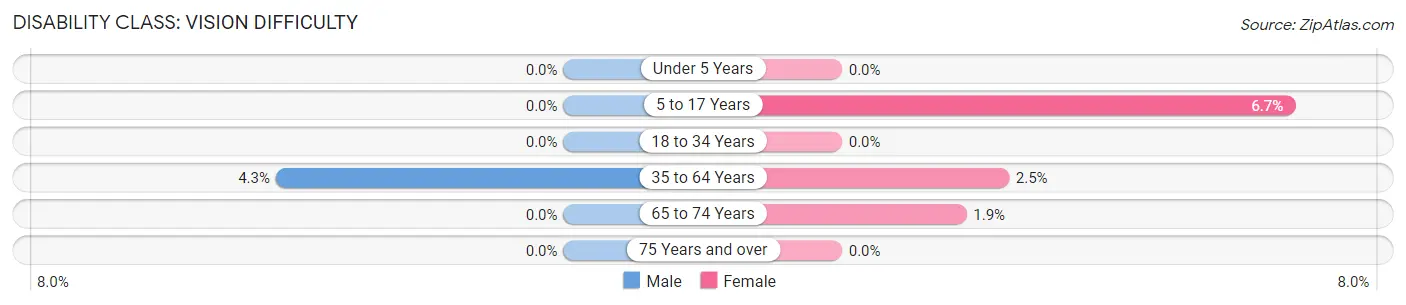
| Age Bracket | Male | Female |
| Under 5 Years | 0 (0.0%) | 0 (0.0%) |
| 5 to 17 Years | 0 (0.0%) | 23 (6.7%) |
| 18 to 34 Years | 0 (0.0%) | 0 (0.0%) |
| 35 to 64 Years | 34 (4.3%) | 20 (2.5%) |
| 65 to 74 Years | 0 (0.0%) | 6 (1.8%) |
| 75 Years and over | 0 (0.0%) | 0 (0.0%) |
Disability Class: Cognitive Difficulty
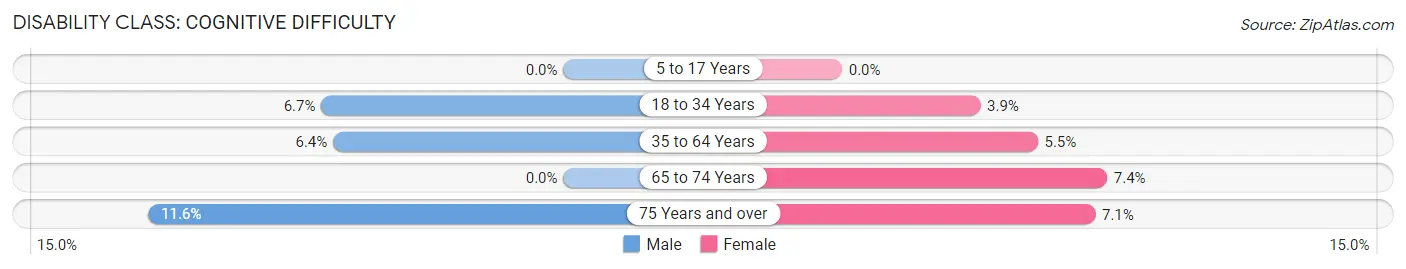
| Age Bracket | Male | Female |
| 5 to 17 Years | 0 (0.0%) | 0 (0.0%) |
| 18 to 34 Years | 31 (6.7%) | 18 (3.8%) |
| 35 to 64 Years | 51 (6.4%) | 44 (5.4%) |
| 65 to 74 Years | 0 (0.0%) | 24 (7.4%) |
| 75 Years and over | 17 (11.6%) | 11 (7.0%) |
Disability Class: Ambulatory Difficulty
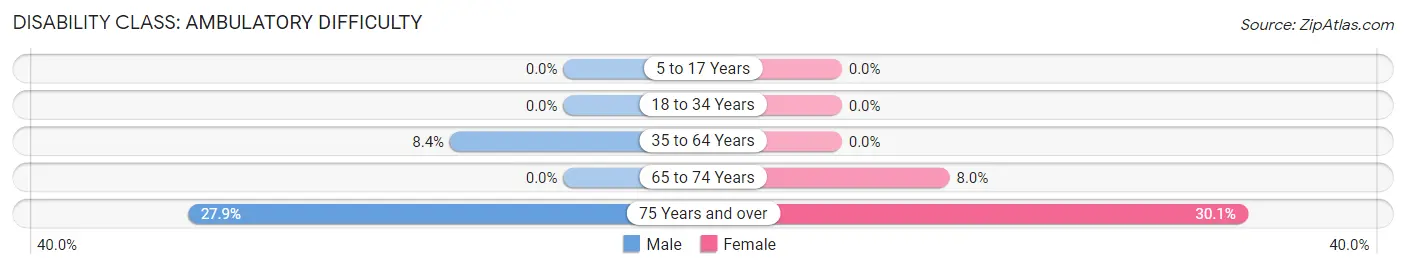
| Age Bracket | Male | Female |
| 5 to 17 Years | 0 (0.0%) | 0 (0.0%) |
| 18 to 34 Years | 0 (0.0%) | 0 (0.0%) |
| 35 to 64 Years | 67 (8.4%) | 0 (0.0%) |
| 65 to 74 Years | 0 (0.0%) | 26 (8.0%) |
| 75 Years and over | 41 (27.9%) | 47 (30.1%) |
Disability Class: Self-Care Difficulty
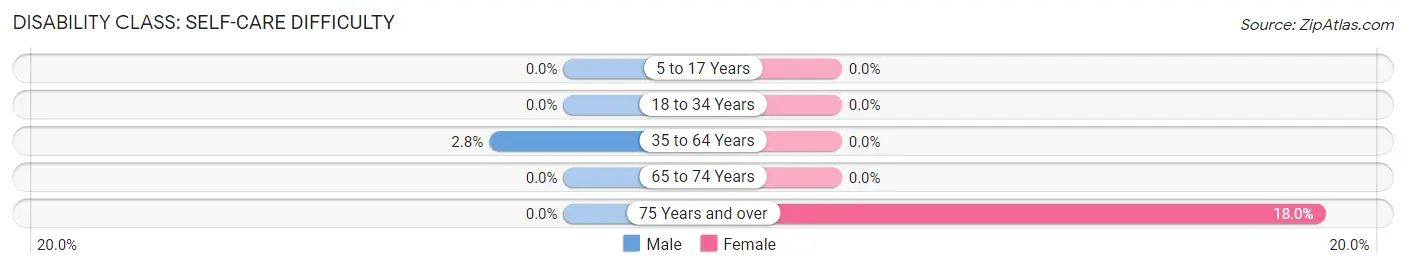
| Age Bracket | Male | Female |
| 5 to 17 Years | 0 (0.0%) | 0 (0.0%) |
| 18 to 34 Years | 0 (0.0%) | 0 (0.0%) |
| 35 to 64 Years | 22 (2.8%) | 0 (0.0%) |
| 65 to 74 Years | 0 (0.0%) | 0 (0.0%) |
| 75 Years and over | 0 (0.0%) | 28 (17.9%) |
Technology Access in Running Springs
Computing Device Access in Running Springs
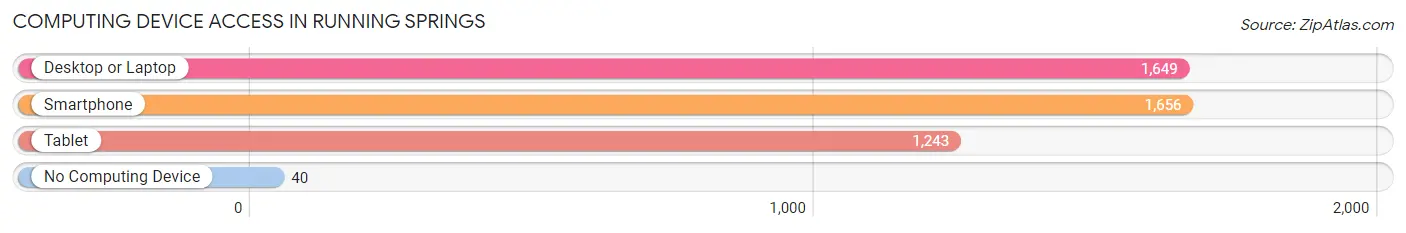
| Device Type | # Households | % Households |
| Desktop or Laptop | 1,649 | 91.0% |
| Smartphone | 1,656 | 91.4% |
| Tablet | 1,243 | 68.6% |
| No Computing Device | 40 | 2.2% |
| Total | 1,812 | 100.0% |
Internet Access in Running Springs
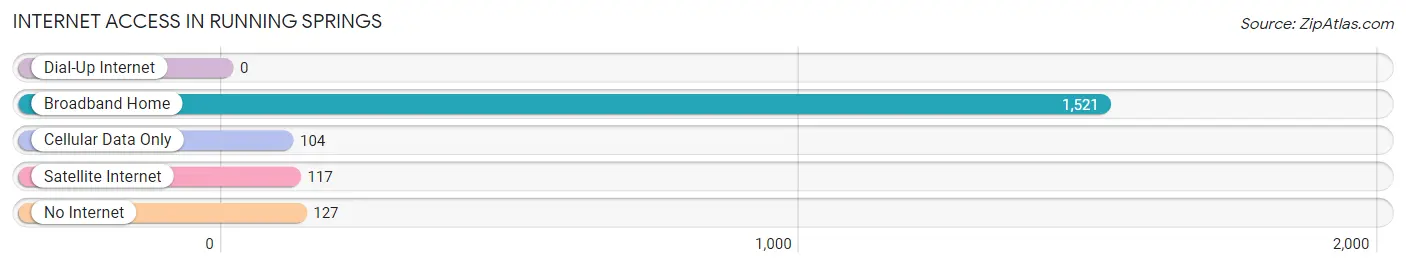
| Internet Type | # Households | % Households |
| Dial-Up Internet | 0 | 0.0% |
| Broadband Home | 1,521 | 83.9% |
| Cellular Data Only | 104 | 5.7% |
| Satellite Internet | 117 | 6.5% |
| No Internet | 127 | 7.0% |
| Total | 1,812 | 100.0% |
Running Springs Summary
History
Running Springs is a small mountain town located in the San Bernardino Mountains of Southern California. It is situated at an elevation of 6,000 feet and is part of the San Bernardino National Forest. The town was founded in the early 1900s by a group of settlers who were looking for a place to escape the heat of the desert. The town was originally called “Running Springs” because of the many springs that were located in the area.
The first settlers in Running Springs were mostly miners and loggers who were looking for gold and timber. The town was officially incorporated in 1927 and was named after the many springs that were located in the area. The town quickly grew and by the 1940s, it had become a popular tourist destination.
The town was also home to a ski resort, which opened in the 1950s and quickly became a popular destination for skiers and snowboarders. The resort was eventually sold to a private company in the 1980s and is now known as Snow Valley Mountain Resort.
Geography
Running Springs is located in the San Bernardino Mountains of Southern California. It is situated at an elevation of 6,000 feet and is part of the San Bernardino National Forest. The town is surrounded by the San Bernardino National Forest and is located near Big Bear Lake. The town is also close to the cities of San Bernardino and Redlands.
The town is located in a mountainous region and is known for its beautiful scenery. The area is home to many species of wildlife, including deer, bears, and mountain lions. The town is also home to many hiking trails and is a popular destination for outdoor enthusiasts.
Economy
Running Springs is a small mountain town with a population of just over 3,000 people. The town is primarily a tourist destination and is home to many vacation homes and cabins. The town is also home to a ski resort, which is a popular destination for skiers and snowboarders.
The town is also home to many small businesses, including restaurants, shops, and lodging. The town is also home to a few small manufacturing companies. The town is also home to a few small farms, which produce fruits and vegetables for local consumption.
Demographics
As of the 2010 census, the population of Running Springs was 3,125. The population is primarily white (90.2%), with a small percentage of African Americans (2.2%), Asians (2.1%), and Native Americans (0.7%). The median household income in Running Springs is $50,000, which is slightly higher than the national average. The town has a high rate of homeownership, with over 80% of the population owning their own homes. The town also has a high rate of educational attainment, with over 90% of the population having at least a high school diploma.
Common Questions
What is Per Capita Income in Running Springs?
Per Capita income in Running Springs is $37,894.
What is the Median Family Income in Running Springs?
Median Family Income in Running Springs is $89,301.
What is the Median Household income in Running Springs?
Median Household Income in Running Springs is $84,060.
What is Income or Wage Gap in Running Springs?
Income or Wage Gap in Running Springs is 67.2%.
Women in Running Springs earn 32.8 cents for every dollar earned by a man.
What is Inequality or Gini Index in Running Springs?
Inequality or Gini Index in Running Springs is 0.35.
What is the Total Population of Running Springs?
Total Population of Running Springs is 4,589.
What is the Total Male Population of Running Springs?
Total Male Population of Running Springs is 2,251.
What is the Total Female Population of Running Springs?
Total Female Population of Running Springs is 2,338.
What is the Ratio of Males per 100 Females in Running Springs?
There are 96.28 Males per 100 Females in Running Springs.
What is the Ratio of Females per 100 Males in Running Springs?
There are 103.86 Females per 100 Males in Running Springs.
What is the Median Population Age in Running Springs?
Median Population Age in Running Springs is 37.9 Years.
What is the Average Family Size in Running Springs
Average Family Size in Running Springs is 3.1 People.
What is the Average Household Size in Running Springs
Average Household Size in Running Springs is 2.5 People.
How Large is the Labor Force in Running Springs?
There are 2,279 People in the Labor Forcein in Running Springs.
What is the Percentage of People in the Labor Force in Running Springs?
64.9% of People are in the Labor Force in Running Springs.
What is the Unemployment Rate in Running Springs?
Unemployment Rate in Running Springs is 4.3%.