Cities with the Highest Percentage of Population Employed in Life, Physical & Social Science in Kansas
RELATED REPORTS & OPTIONS
Life, Physical & Social Science
Kansas
Compare Cities
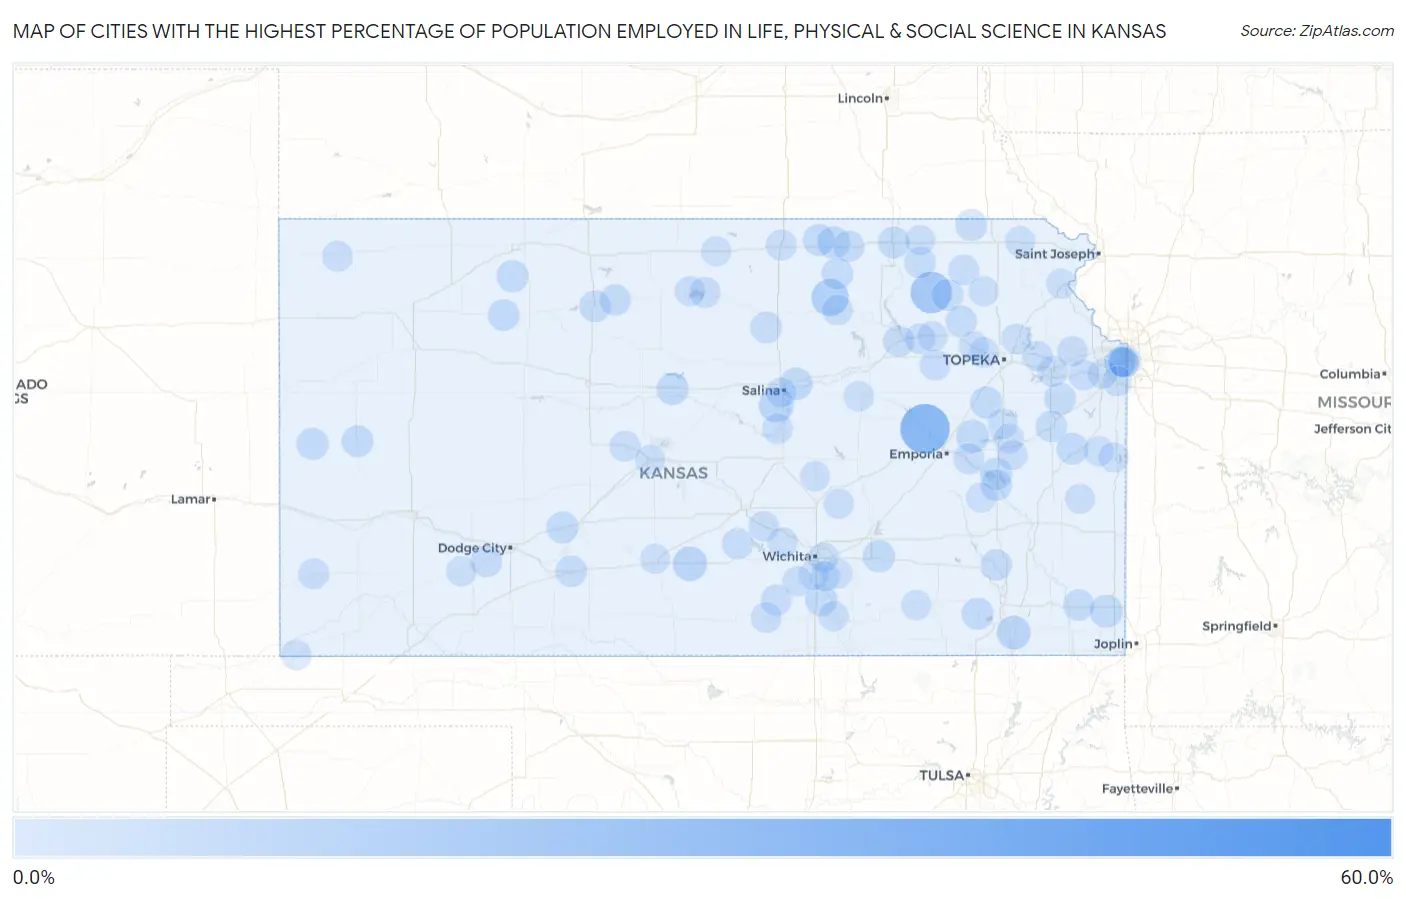
Map of Cities with the Highest Percentage of Population Employed in Life, Physical & Social Science in Kansas
0.0%
60.0%
Cities with the Highest Percentage of Population Employed in Life, Physical & Social Science in Kansas
| City | % Employed | vs State | vs National | |
| 1. | Mentor | 53.8% | 0.94%(+52.9)#1 | 1.1%(+52.8)#15 |
| 2. | Dunlap | 27.6% | 0.94%(+26.6)#2 | 1.1%(+26.5)#49 |
| 3. | Wheaton | 16.3% | 0.94%(+15.4)#3 | 1.1%(+15.2)#102 |
| 4. | Morganville | 10.9% | 0.94%(+9.93)#4 | 1.1%(+9.78)#205 |
| 5. | Smolan | 7.5% | 0.94%(+6.59)#5 | 1.1%(+6.44)#376 |
| 6. | Cunningham | 7.1% | 0.94%(+6.16)#6 | 1.1%(+6.01)#420 |
| 7. | Liberty | 6.1% | 0.94%(+5.12)#7 | 1.1%(+4.97)#573 |
| 8. | Weir | 5.1% | 0.94%(+4.16)#8 | 1.1%(+4.01)#766 |
| 9. | Reading | 4.9% | 0.94%(+3.94)#9 | 1.1%(+3.79)#820 |
| 10. | Morrowville | 4.5% | 0.94%(+3.60)#10 | 1.1%(+3.45)#935 |
| 11. | New Cambria | 4.4% | 0.94%(+3.46)#11 | 1.1%(+3.30)#996 |
| 12. | Burlingame | 4.2% | 0.94%(+3.30)#12 | 1.1%(+3.15)#1,062 |
| 13. | Leon | 4.1% | 0.94%(+3.18)#13 | 1.1%(+3.03)#1,110 |
| 14. | New Strawn | 4.0% | 0.94%(+3.06)#14 | 1.1%(+2.91)#1,165 |
| 15. | Lenora | 4.0% | 0.94%(+3.06)#15 | 1.1%(+2.91)#1,168 |
| 16. | Belle Plaine | 4.0% | 0.94%(+3.03)#16 | 1.1%(+2.88)#1,186 |
| 17. | Dorrance | 3.9% | 0.94%(+2.98)#17 | 1.1%(+2.83)#1,213 |
| 18. | Tribune | 3.9% | 0.94%(+2.94)#18 | 1.1%(+2.79)#1,237 |
| 19. | Offerle | 3.8% | 0.94%(+2.87)#19 | 1.1%(+2.72)#1,273 |
| 20. | Haddam | 3.7% | 0.94%(+2.76)#20 | 1.1%(+2.61)#1,328 |
| 21. | Marysville | 3.7% | 0.94%(+2.74)#21 | 1.1%(+2.59)#1,354 |
| 22. | Westwood Hills | 3.7% | 0.94%(+2.73)#22 | 1.1%(+2.58)#1,356 |
| 23. | Lane | 3.6% | 0.94%(+2.63)#23 | 1.1%(+2.48)#1,420 |
| 24. | Elk City | 3.5% | 0.94%(+2.59)#24 | 1.1%(+2.44)#1,459 |
| 25. | Leoti | 3.5% | 0.94%(+2.56)#25 | 1.1%(+2.41)#1,484 |
| 26. | Morland | 3.4% | 0.94%(+2.51)#26 | 1.1%(+2.36)#1,518 |
| 27. | Baldwin City | 3.4% | 0.94%(+2.46)#27 | 1.1%(+2.31)#1,548 |
| 28. | Ensign | 3.3% | 0.94%(+2.39)#28 | 1.1%(+2.24)#1,586 |
| 29. | Bern | 3.3% | 0.94%(+2.39)#29 | 1.1%(+2.24)#1,587 |
| 30. | Stockton | 3.3% | 0.94%(+2.34)#30 | 1.1%(+2.19)#1,628 |
| 31. | Delphos | 3.2% | 0.94%(+2.31)#31 | 1.1%(+2.16)#1,657 |
| 32. | Onaga | 3.2% | 0.94%(+2.23)#32 | 1.1%(+2.08)#1,721 |
| 33. | Burlington | 3.1% | 0.94%(+2.20)#33 | 1.1%(+2.05)#1,746 |
| 34. | Mullinville | 3.0% | 0.94%(+2.09)#34 | 1.1%(+1.94)#1,866 |
| 35. | Palmer | 3.0% | 0.94%(+2.09)#35 | 1.1%(+1.94)#1,868 |
| 36. | Woodston | 3.0% | 0.94%(+2.09)#36 | 1.1%(+1.94)#1,869 |
| 37. | Frankfort | 3.0% | 0.94%(+2.02)#37 | 1.1%(+1.87)#1,908 |
| 38. | Ottawa | 3.0% | 0.94%(+2.01)#38 | 1.1%(+1.86)#1,925 |
| 39. | Manhattan | 2.9% | 0.94%(+1.92)#39 | 1.1%(+1.77)#2,000 |
| 40. | Benedict | 2.9% | 0.94%(+1.92)#40 | 1.1%(+1.77)#2,011 |
| 41. | Washington | 2.8% | 0.94%(+1.90)#41 | 1.1%(+1.75)#2,027 |
| 42. | Mccune | 2.8% | 0.94%(+1.82)#42 | 1.1%(+1.67)#2,145 |
| 43. | Pretty Prairie | 2.7% | 0.94%(+1.81)#43 | 1.1%(+1.66)#2,158 |
| 44. | Emmett | 2.7% | 0.94%(+1.76)#44 | 1.1%(+1.61)#2,223 |
| 45. | Glen Elder | 2.5% | 0.94%(+1.55)#45 | 1.1%(+1.40)#2,529 |
| 46. | Conway Springs | 2.5% | 0.94%(+1.55)#46 | 1.1%(+1.40)#2,542 |
| 47. | Mission | 2.4% | 0.94%(+1.50)#47 | 1.1%(+1.35)#2,618 |
| 48. | Johnson City | 2.4% | 0.94%(+1.49)#48 | 1.1%(+1.34)#2,630 |
| 49. | Neosho Rapids | 2.4% | 0.94%(+1.48)#49 | 1.1%(+1.33)#2,637 |
| 50. | Belleville | 2.4% | 0.94%(+1.43)#50 | 1.1%(+1.28)#2,739 |
| 51. | Lawrence | 2.3% | 0.94%(+1.40)#51 | 1.1%(+1.25)#2,788 |
| 52. | Corning | 2.2% | 0.94%(+1.31)#52 | 1.1%(+1.16)#2,957 |
| 53. | Bird City | 2.2% | 0.94%(+1.27)#53 | 1.1%(+1.11)#3,026 |
| 54. | St George | 2.1% | 0.94%(+1.11)#54 | 1.1%(+0.963)#3,310 |
| 55. | Albert | 2.0% | 0.94%(+1.10)#55 | 1.1%(+0.950)#3,348 |
| 56. | Lindsborg | 2.0% | 0.94%(+1.02)#56 | 1.1%(+0.868)#3,523 |
| 57. | De Soto | 2.0% | 0.94%(+1.02)#57 | 1.1%(+0.867)#3,527 |
| 58. | Argonia | 1.9% | 0.94%(+0.946)#58 | 1.1%(+0.796)#3,699 |
| 59. | Clay Center | 1.9% | 0.94%(+0.943)#59 | 1.1%(+0.793)#3,708 |
| 60. | Roeland Park | 1.8% | 0.94%(+0.903)#60 | 1.1%(+0.753)#3,814 |
| 61. | Tonganoxie | 1.8% | 0.94%(+0.899)#61 | 1.1%(+0.749)#3,826 |
| 62. | Alma | 1.8% | 0.94%(+0.835)#62 | 1.1%(+0.684)#3,998 |
| 63. | Haven | 1.7% | 0.94%(+0.805)#63 | 1.1%(+0.655)#4,084 |
| 64. | Perry | 1.7% | 0.94%(+0.778)#64 | 1.1%(+0.628)#4,167 |
| 65. | Elkhart | 1.6% | 0.94%(+0.707)#65 | 1.1%(+0.557)#4,362 |
| 66. | Woodbine | 1.6% | 0.94%(+0.699)#66 | 1.1%(+0.548)#4,380 |
| 67. | Goessel | 1.6% | 0.94%(+0.679)#67 | 1.1%(+0.529)#4,439 |
| 68. | Wamego | 1.5% | 0.94%(+0.590)#68 | 1.1%(+0.439)#4,733 |
| 69. | Cawker City | 1.5% | 0.94%(+0.560)#69 | 1.1%(+0.409)#4,831 |
| 70. | Elbing | 1.5% | 0.94%(+0.552)#70 | 1.1%(+0.402)#4,886 |
| 71. | Beattie | 1.5% | 0.94%(+0.552)#71 | 1.1%(+0.402)#4,887 |
| 72. | Circleville | 1.5% | 0.94%(+0.552)#72 | 1.1%(+0.402)#4,889 |
| 73. | Linn Valley | 1.5% | 0.94%(+0.543)#73 | 1.1%(+0.392)#4,917 |
| 74. | Rose Hill | 1.4% | 0.94%(+0.504)#74 | 1.1%(+0.353)#5,076 |
| 75. | Great Bend | 1.4% | 0.94%(+0.492)#75 | 1.1%(+0.342)#5,128 |
| 76. | Montezuma | 1.4% | 0.94%(+0.488)#76 | 1.1%(+0.338)#5,147 |
| 77. | Hiawatha | 1.4% | 0.94%(+0.477)#77 | 1.1%(+0.327)#5,189 |
| 78. | Lyndon | 1.4% | 0.94%(+0.470)#78 | 1.1%(+0.320)#5,208 |
| 79. | Silver Lake | 1.4% | 0.94%(+0.464)#79 | 1.1%(+0.313)#5,229 |
| 80. | Meriden | 1.4% | 0.94%(+0.460)#80 | 1.1%(+0.310)#5,244 |
| 81. | Fontana | 1.4% | 0.94%(+0.458)#81 | 1.1%(+0.308)#5,248 |
| 82. | Gridley | 1.4% | 0.94%(+0.455)#82 | 1.1%(+0.304)#5,262 |
| 83. | Overland Park | 1.4% | 0.94%(+0.452)#83 | 1.1%(+0.302)#5,268 |
| 84. | Melvern | 1.4% | 0.94%(+0.448)#84 | 1.1%(+0.298)#5,282 |
| 85. | Haysville | 1.4% | 0.94%(+0.435)#85 | 1.1%(+0.284)#5,323 |
| 86. | Atchison | 1.4% | 0.94%(+0.426)#86 | 1.1%(+0.276)#5,359 |
| 87. | Eastborough | 1.4% | 0.94%(+0.426)#87 | 1.1%(+0.275)#5,362 |
| 88. | Lenexa | 1.4% | 0.94%(+0.421)#88 | 1.1%(+0.270)#5,388 |
| 89. | Fairway | 1.4% | 0.94%(+0.419)#89 | 1.1%(+0.268)#5,398 |
| 90. | Grenola | 1.4% | 0.94%(+0.411)#90 | 1.1%(+0.260)#5,447 |
| 91. | Mankato | 1.3% | 0.94%(+0.404)#91 | 1.1%(+0.253)#5,472 |
| 92. | Waverly | 1.3% | 0.94%(+0.364)#92 | 1.1%(+0.213)#5,652 |
| 93. | Oxford | 1.3% | 0.94%(+0.362)#93 | 1.1%(+0.212)#5,662 |
| 94. | Derby | 1.3% | 0.94%(+0.355)#94 | 1.1%(+0.205)#5,695 |
| 95. | Salina | 1.3% | 0.94%(+0.352)#95 | 1.1%(+0.201)#5,712 |
| 96. | Andale | 1.3% | 0.94%(+0.337)#96 | 1.1%(+0.186)#5,777 |
| 97. | Pratt | 1.2% | 0.94%(+0.302)#97 | 1.1%(+0.152)#5,925 |
| 98. | Clearwater | 1.2% | 0.94%(+0.300)#98 | 1.1%(+0.149)#5,944 |
| 99. | Blue Mound | 1.2% | 0.94%(+0.279)#99 | 1.1%(+0.129)#6,038 |
| 100. | Rossville | 1.2% | 0.94%(+0.274)#100 | 1.1%(+0.124)#6,060 |
Common Questions
What are the Top 10 Cities with the Highest Percentage of Population Employed in Life, Physical & Social Science in Kansas?
Top 10 Cities with the Highest Percentage of Population Employed in Life, Physical & Social Science in Kansas are:
#1
27.6%
#2
16.3%
#3
10.9%
#4
7.5%
#5
7.1%
#6
6.1%
#7
5.1%
#8
4.9%
#9
4.5%
#10
4.4%
What city has the Highest Percentage of Population Employed in Life, Physical & Social Science in Kansas?
Dunlap has the Highest Percentage of Population Employed in Life, Physical & Social Science in Kansas with 27.6%.
What is the Percentage of Population Employed in Life, Physical & Social Science in the State of Kansas?
Percentage of Population Employed in Life, Physical & Social Science in Kansas is 0.94%.
What is the Percentage of Population Employed in Life, Physical & Social Science in the United States?
Percentage of Population Employed in Life, Physical & Social Science in the United States is 1.1%.