Cities with the Highest Percentage of Population Employed in Life, Physical & Social Science in Maryland
RELATED REPORTS & OPTIONS
Life, Physical & Social Science
Maryland
Compare Cities
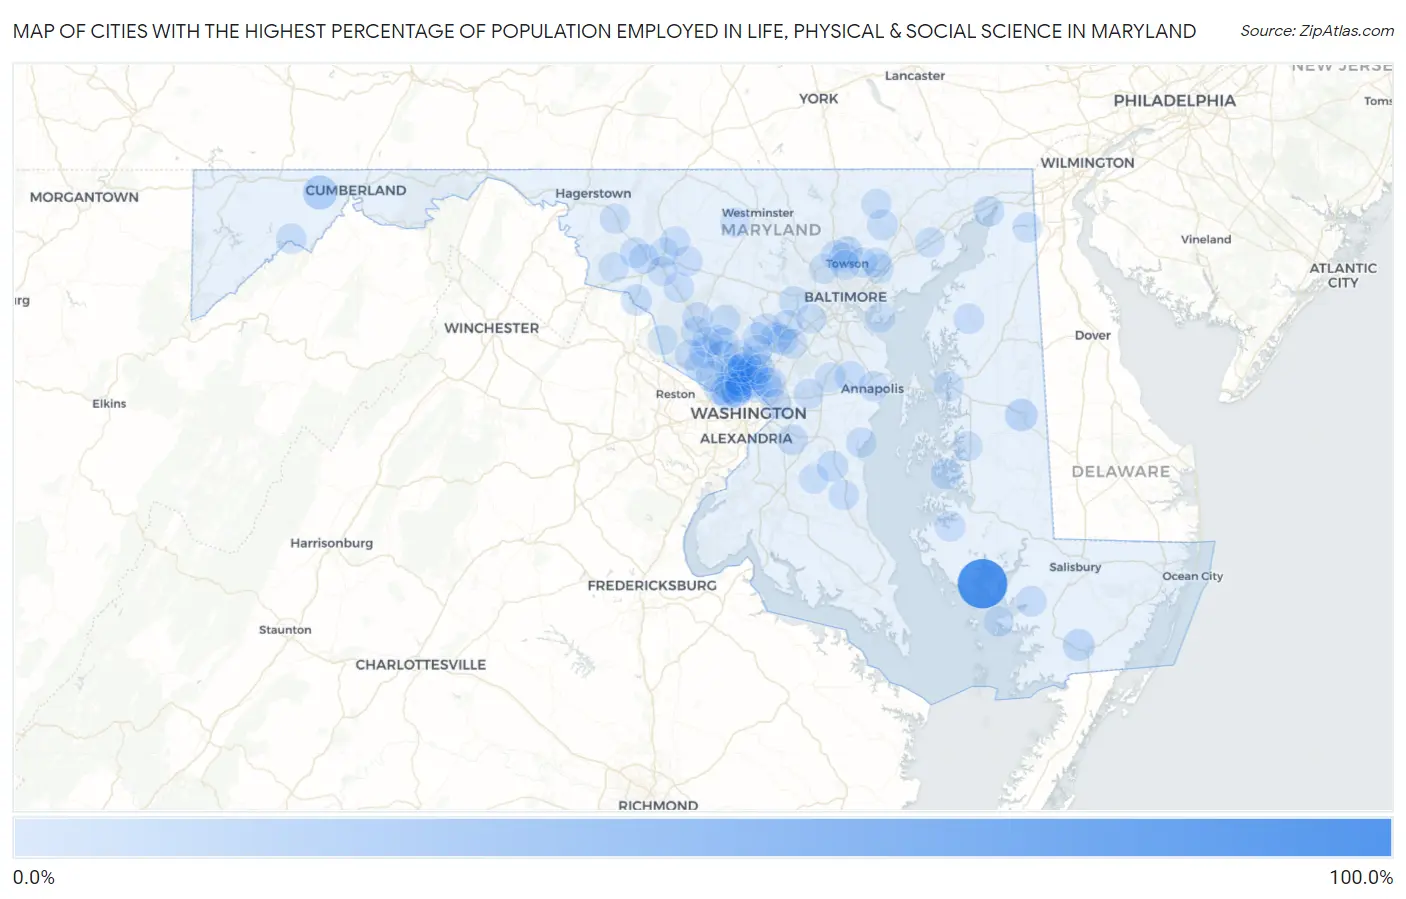
Map of Cities with the Highest Percentage of Population Employed in Life, Physical & Social Science in Maryland
0.0%
100.0%
Cities with the Highest Percentage of Population Employed in Life, Physical & Social Science in Maryland
| City | % Employed | vs State | vs National | |
| 1. | Elliott | 100.0% | 2.2%(+97.8)#1 | 1.1%(+98.9)#2 |
| 2. | Grahamtown | 21.5% | 2.2%(+19.3)#2 | 1.1%(+20.4)#67 |
| 3. | West Denton | 14.3% | 2.2%(+12.1)#3 | 1.1%(+13.2)#131 |
| 4. | Cabin John | 12.0% | 2.2%(+9.87)#4 | 1.1%(+10.9)#175 |
| 5. | West Pocomoke | 11.1% | 2.2%(+8.96)#5 | 1.1%(+10.0)#194 |
| 6. | North Potomac | 9.5% | 2.2%(+7.38)#6 | 1.1%(+8.44)#254 |
| 7. | South Kensington | 9.2% | 2.2%(+7.09)#7 | 1.1%(+8.15)#269 |
| 8. | Bethesda | 9.2% | 2.2%(+7.05)#8 | 1.1%(+8.11)#273 |
| 9. | Somerset | 8.5% | 2.2%(+6.36)#9 | 1.1%(+7.42)#306 |
| 10. | Garrett Park | 8.5% | 2.2%(+6.32)#10 | 1.1%(+7.38)#311 |
| 11. | North Bethesda | 8.5% | 2.2%(+6.31)#11 | 1.1%(+7.37)#314 |
| 12. | Rockville | 7.7% | 2.2%(+5.51)#12 | 1.1%(+6.58)#370 |
| 13. | Dunkirk | 7.6% | 2.2%(+5.44)#13 | 1.1%(+6.50)#372 |
| 14. | Oxford | 7.4% | 2.2%(+5.25)#14 | 1.1%(+6.32)#383 |
| 15. | Martin S Additions | 7.2% | 2.2%(+5.02)#15 | 1.1%(+6.08)#410 |
| 16. | Point Of Rocks | 7.0% | 2.2%(+4.89)#16 | 1.1%(+5.95)#429 |
| 17. | Chevy Chase Section Three | 6.8% | 2.2%(+4.60)#17 | 1.1%(+5.67)#464 |
| 18. | Potomac | 6.6% | 2.2%(+4.42)#18 | 1.1%(+5.48)#488 |
| 19. | Melwood | 6.3% | 2.2%(+4.13)#19 | 1.1%(+5.19)#533 |
| 20. | Mount Vernon | 6.1% | 2.2%(+3.92)#20 | 1.1%(+4.99)#565 |
| 21. | Fallston | 5.9% | 2.2%(+3.75)#21 | 1.1%(+4.82)#596 |
| 22. | Charlestown | 5.9% | 2.2%(+3.70)#22 | 1.1%(+4.76)#607 |
| 23. | Travilah | 5.7% | 2.2%(+3.57)#23 | 1.1%(+4.63)#626 |
| 24. | Kensington | 5.6% | 2.2%(+3.49)#24 | 1.1%(+4.55)#644 |
| 25. | Chevy Chase | 5.6% | 2.2%(+3.43)#25 | 1.1%(+4.49)#649 |
| 26. | Fulton | 5.6% | 2.2%(+3.41)#26 | 1.1%(+4.48)#652 |
| 27. | Highland | 5.4% | 2.2%(+3.27)#27 | 1.1%(+4.33)#691 |
| 28. | Westernport | 5.3% | 2.2%(+3.16)#28 | 1.1%(+4.23)#720 |
| 29. | Scaggsville | 5.3% | 2.2%(+3.10)#29 | 1.1%(+4.17)#733 |
| 30. | Crownsville | 5.0% | 2.2%(+2.84)#30 | 1.1%(+3.90)#794 |
| 31. | Chestertown | 5.0% | 2.2%(+2.81)#31 | 1.1%(+3.87)#801 |
| 32. | Colesville | 4.9% | 2.2%(+2.76)#32 | 1.1%(+3.83)#810 |
| 33. | Forest Glen | 4.8% | 2.2%(+2.65)#33 | 1.1%(+3.71)#847 |
| 34. | Gaithersburg | 4.8% | 2.2%(+2.63)#34 | 1.1%(+3.70)#850 |
| 35. | Takoma Park | 4.8% | 2.2%(+2.63)#35 | 1.1%(+3.69)#852 |
| 36. | Washington Grove | 4.8% | 2.2%(+2.61)#36 | 1.1%(+3.67)#856 |
| 37. | College Park | 4.6% | 2.2%(+2.48)#37 | 1.1%(+3.54)#899 |
| 38. | Urbana | 4.6% | 2.2%(+2.45)#38 | 1.1%(+3.51)#910 |
| 39. | Timonium | 4.5% | 2.2%(+2.39)#39 | 1.1%(+3.45)#941 |
| 40. | Darnestown | 4.4% | 2.2%(+2.24)#40 | 1.1%(+3.30)#997 |
| 41. | Clarksburg | 4.4% | 2.2%(+2.23)#41 | 1.1%(+3.29)#1,002 |
| 42. | Silver Spring | 4.4% | 2.2%(+2.21)#42 | 1.1%(+3.27)#1,014 |
| 43. | Naval Academy | 4.3% | 2.2%(+2.15)#43 | 1.1%(+3.22)#1,035 |
| 44. | North Kensington | 4.3% | 2.2%(+2.13)#44 | 1.1%(+3.19)#1,044 |
| 45. | Church Creek | 4.3% | 2.2%(+2.10)#45 | 1.1%(+3.16)#1,060 |
| 46. | Chevy Chase Section Five | 4.2% | 2.2%(+2.06)#46 | 1.1%(+3.12)#1,072 |
| 47. | Linganore | 4.2% | 2.2%(+2.06)#47 | 1.1%(+3.12)#1,073 |
| 48. | Huntingtown | 4.1% | 2.2%(+1.99)#48 | 1.1%(+3.05)#1,101 |
| 49. | Laytonsville | 4.1% | 2.2%(+1.98)#49 | 1.1%(+3.04)#1,106 |
| 50. | Chance | 4.1% | 2.2%(+1.98)#50 | 1.1%(+3.04)#1,107 |
| 51. | Middletown | 4.1% | 2.2%(+1.93)#51 | 1.1%(+3.00)#1,118 |
| 52. | Mount Lena | 3.9% | 2.2%(+1.76)#52 | 1.1%(+2.82)#1,218 |
| 53. | Fairwood | 3.9% | 2.2%(+1.71)#53 | 1.1%(+2.77)#1,243 |
| 54. | Ellicott City | 3.8% | 2.2%(+1.69)#54 | 1.1%(+2.75)#1,255 |
| 55. | Columbia | 3.8% | 2.2%(+1.64)#55 | 1.1%(+2.70)#1,278 |
| 56. | Kemp Mill | 3.8% | 2.2%(+1.61)#56 | 1.1%(+2.67)#1,290 |
| 57. | Glen Echo | 3.6% | 2.2%(+1.50)#57 | 1.1%(+2.56)#1,372 |
| 58. | Braddock Heights | 3.6% | 2.2%(+1.48)#58 | 1.1%(+2.55)#1,381 |
| 59. | Deale | 3.6% | 2.2%(+1.45)#59 | 1.1%(+2.52)#1,397 |
| 60. | North Chevy Chase | 3.5% | 2.2%(+1.38)#60 | 1.1%(+2.45)#1,449 |
| 61. | Germantown | 3.5% | 2.2%(+1.32)#61 | 1.1%(+2.38)#1,504 |
| 62. | Mays Chapel | 3.4% | 2.2%(+1.27)#62 | 1.1%(+2.33)#1,532 |
| 63. | North Laurel | 3.3% | 2.2%(+1.19)#63 | 1.1%(+2.26)#1,575 |
| 64. | Redland | 3.3% | 2.2%(+1.18)#64 | 1.1%(+2.25)#1,581 |
| 65. | University Park | 3.3% | 2.2%(+1.17)#65 | 1.1%(+2.23)#1,594 |
| 66. | Jarrettsville | 3.2% | 2.2%(+1.00)#66 | 1.1%(+2.06)#1,735 |
| 67. | Flower Hill | 3.2% | 2.2%(+0.998)#67 | 1.1%(+2.06)#1,737 |
| 68. | Burnt Mills | 3.1% | 2.2%(+0.971)#68 | 1.1%(+2.03)#1,762 |
| 69. | Four Corners | 3.1% | 2.2%(+0.958)#69 | 1.1%(+2.02)#1,784 |
| 70. | Chesapeake City | 3.1% | 2.2%(+0.939)#70 | 1.1%(+2.00)#1,802 |
| 71. | Friendship Heights Village | 3.0% | 2.2%(+0.895)#71 | 1.1%(+1.96)#1,847 |
| 72. | Frederick | 3.0% | 2.2%(+0.884)#72 | 1.1%(+1.95)#1,860 |
| 73. | Glenmont | 3.0% | 2.2%(+0.844)#73 | 1.1%(+1.91)#1,887 |
| 74. | Riverside | 3.0% | 2.2%(+0.811)#74 | 1.1%(+1.87)#1,909 |
| 75. | Aspen Hill | 2.9% | 2.2%(+0.770)#75 | 1.1%(+1.83)#1,947 |
| 76. | Wheaton | 2.9% | 2.2%(+0.749)#76 | 1.1%(+1.81)#1,965 |
| 77. | Adelphi | 2.9% | 2.2%(+0.742)#77 | 1.1%(+1.80)#1,973 |
| 78. | Lutherville | 2.9% | 2.2%(+0.712)#78 | 1.1%(+1.78)#1,996 |
| 79. | Ashton Sandy Spring | 2.9% | 2.2%(+0.711)#79 | 1.1%(+1.77)#1,998 |
| 80. | Walkersville | 2.9% | 2.2%(+0.710)#80 | 1.1%(+1.77)#1,999 |
| 81. | Queenstown | 2.8% | 2.2%(+0.681)#81 | 1.1%(+1.74)#2,029 |
| 82. | White Marsh | 2.8% | 2.2%(+0.667)#82 | 1.1%(+1.73)#2,051 |
| 83. | Burkittsville | 2.8% | 2.2%(+0.663)#83 | 1.1%(+1.73)#2,059 |
| 84. | White Oak | 2.8% | 2.2%(+0.646)#84 | 1.1%(+1.71)#2,083 |
| 85. | Baden | 2.8% | 2.2%(+0.636)#85 | 1.1%(+1.70)#2,100 |
| 86. | Easton | 2.8% | 2.2%(+0.629)#86 | 1.1%(+1.69)#2,109 |
| 87. | Cloverly | 2.7% | 2.2%(+0.576)#87 | 1.1%(+1.64)#2,189 |
| 88. | Green Valley | 2.7% | 2.2%(+0.574)#88 | 1.1%(+1.64)#2,192 |
| 89. | Ilchester | 2.7% | 2.2%(+0.556)#89 | 1.1%(+1.62)#2,211 |
| 90. | Pikesville | 2.7% | 2.2%(+0.555)#90 | 1.1%(+1.62)#2,212 |
| 91. | Carney | 2.7% | 2.2%(+0.553)#91 | 1.1%(+1.62)#2,215 |
| 92. | Cheverly | 2.7% | 2.2%(+0.509)#92 | 1.1%(+1.57)#2,263 |
| 93. | Edgemere | 2.7% | 2.2%(+0.499)#93 | 1.1%(+1.56)#2,278 |
| 94. | Brookmont | 2.6% | 2.2%(+0.458)#94 | 1.1%(+1.52)#2,343 |
| 95. | Ballenger Creek | 2.6% | 2.2%(+0.447)#95 | 1.1%(+1.51)#2,357 |
| 96. | Crofton | 2.6% | 2.2%(+0.445)#96 | 1.1%(+1.51)#2,359 |
| 97. | Poolesville | 2.6% | 2.2%(+0.445)#97 | 1.1%(+1.51)#2,360 |
| 98. | Towson | 2.6% | 2.2%(+0.435)#98 | 1.1%(+1.50)#2,371 |
| 99. | New Windsor | 2.6% | 2.2%(+0.406)#99 | 1.1%(+1.47)#2,420 |
| 100. | Perry Hall | 2.6% | 2.2%(+0.397)#100 | 1.1%(+1.46)#2,436 |
Common Questions
What are the Top 10 Cities with the Highest Percentage of Population Employed in Life, Physical & Social Science in Maryland?
Top 10 Cities with the Highest Percentage of Population Employed in Life, Physical & Social Science in Maryland are:
#1
100.0%
#2
21.5%
#3
14.3%
#4
12.0%
#5
11.1%
#6
9.5%
#7
9.2%
#8
9.2%
#9
8.5%
#10
8.5%
What city has the Highest Percentage of Population Employed in Life, Physical & Social Science in Maryland?
Elliott has the Highest Percentage of Population Employed in Life, Physical & Social Science in Maryland with 100.0%.
What is the Percentage of Population Employed in Life, Physical & Social Science in the State of Maryland?
Percentage of Population Employed in Life, Physical & Social Science in Maryland is 2.2%.
What is the Percentage of Population Employed in Life, Physical & Social Science in the United States?
Percentage of Population Employed in Life, Physical & Social Science in the United States is 1.1%.