Cities with the Highest Percentage of Population Employed in Life, Physical & Social Science in North Dakota
RELATED REPORTS & OPTIONS
Life, Physical & Social Science
North Dakota
Compare Cities
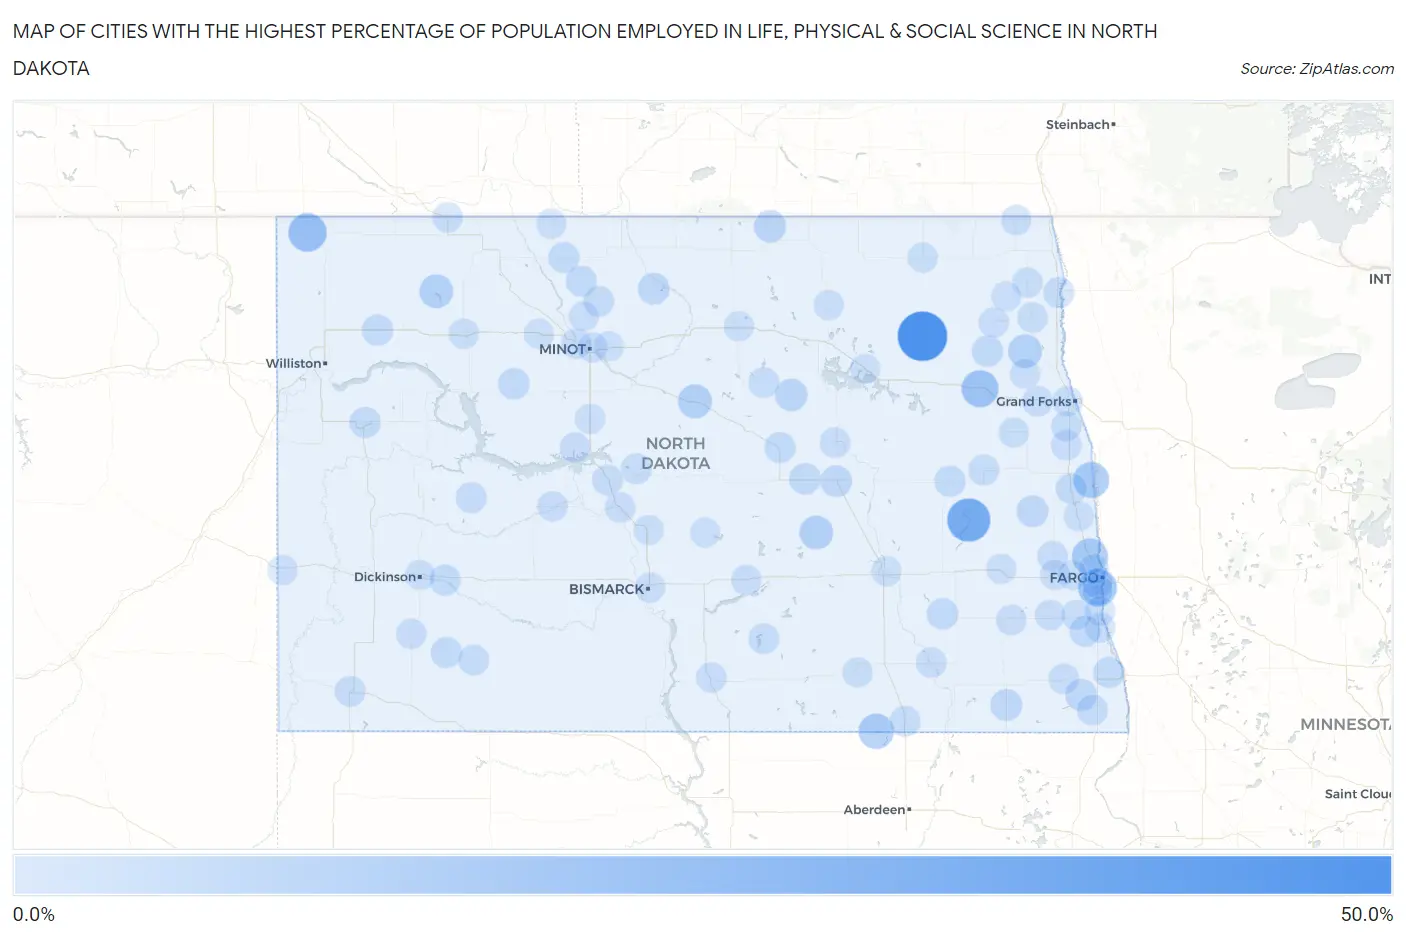
Map of Cities with the Highest Percentage of Population Employed in Life, Physical & Social Science in North Dakota
0.0%
50.0%
Cities with the Highest Percentage of Population Employed in Life, Physical & Social Science in North Dakota
| City | % Employed | vs State | vs National | |
| 1. | Lawton | 50.0% | 0.93%(+49.1)#1 | 1.1%(+48.9)#17 |
| 2. | Sibley | 33.3% | 0.93%(+32.4)#2 | 1.1%(+32.2)#37 |
| 3. | Prairie Rose | 21.4% | 0.93%(+20.5)#3 | 1.1%(+20.3)#68 |
| 4. | Fortuna | 20.8% | 0.93%(+19.9)#4 | 1.1%(+19.7)#71 |
| 5. | Niagara | 17.6% | 0.93%(+16.7)#5 | 1.1%(+16.6)#89 |
| 6. | Brooktree Park | 14.8% | 0.93%(+13.9)#6 | 1.1%(+13.7)#118 |
| 7. | Caledonia | 14.7% | 0.93%(+13.8)#7 | 1.1%(+13.6)#121 |
| 8. | Forbes | 13.3% | 0.93%(+12.4)#8 | 1.1%(+12.2)#152 |
| 9. | Drake | 10.2% | 0.93%(+9.26)#9 | 1.1%(+9.09)#219 |
| 10. | Powers Lake | 9.6% | 0.93%(+8.64)#10 | 1.1%(+8.47)#252 |
| 11. | Woodworth | 9.5% | 0.93%(+8.60)#11 | 1.1%(+8.43)#255 |
| 12. | Forest River | 9.4% | 0.93%(+8.51)#12 | 1.1%(+8.34)#260 |
| 13. | Maddock | 6.5% | 0.93%(+5.52)#13 | 1.1%(+5.36)#507 |
| 14. | St John | 5.7% | 0.93%(+4.79)#14 | 1.1%(+4.62)#628 |
| 15. | Forman | 4.7% | 0.93%(+3.79)#15 | 1.1%(+3.62)#871 |
| 16. | Galesburg | 4.7% | 0.93%(+3.72)#16 | 1.1%(+3.56)#893 |
| 17. | Carrington | 4.6% | 0.93%(+3.68)#17 | 1.1%(+3.52)#908 |
| 18. | Upham | 4.5% | 0.93%(+3.62)#18 | 1.1%(+3.45)#932 |
| 19. | Mantador | 4.5% | 0.93%(+3.62)#19 | 1.1%(+3.45)#939 |
| 20. | Plaza | 4.2% | 0.93%(+3.28)#20 | 1.1%(+3.12)#1,076 |
| 21. | Sykeston | 4.0% | 0.93%(+3.07)#21 | 1.1%(+2.91)#1,171 |
| 22. | Fordville | 3.8% | 0.93%(+2.92)#22 | 1.1%(+2.76)#1,248 |
| 23. | Litchville | 3.8% | 0.93%(+2.85)#23 | 1.1%(+2.68)#1,286 |
| 24. | Ray | 3.7% | 0.93%(+2.73)#24 | 1.1%(+2.56)#1,365 |
| 25. | Watford City | 3.5% | 0.93%(+2.57)#25 | 1.1%(+2.41)#1,486 |
| 26. | Gladstone | 3.4% | 0.93%(+2.50)#26 | 1.1%(+2.33)#1,531 |
| 27. | Cooperstown | 3.4% | 0.93%(+2.49)#27 | 1.1%(+2.33)#1,536 |
| 28. | Hillsboro | 3.4% | 0.93%(+2.47)#28 | 1.1%(+2.30)#1,550 |
| 29. | Fessenden | 3.3% | 0.93%(+2.40)#29 | 1.1%(+2.24)#1,585 |
| 30. | Regent | 3.3% | 0.93%(+2.37)#30 | 1.1%(+2.21)#1,618 |
| 31. | Walcott | 3.2% | 0.93%(+2.30)#31 | 1.1%(+2.13)#1,678 |
| 32. | Dwight | 3.2% | 0.93%(+2.30)#32 | 1.1%(+2.13)#1,682 |
| 33. | Mohall | 3.2% | 0.93%(+2.23)#33 | 1.1%(+2.07)#1,725 |
| 34. | Lansford | 3.0% | 0.93%(+2.07)#34 | 1.1%(+1.91)#1,885 |
| 35. | Halliday | 2.8% | 0.93%(+1.88)#35 | 1.1%(+1.72)#2,073 |
| 36. | Finley | 2.7% | 0.93%(+1.76)#36 | 1.1%(+1.59)#2,238 |
| 37. | Drayton | 2.6% | 0.93%(+1.70)#37 | 1.1%(+1.54)#2,306 |
| 38. | Turtle Lake | 2.6% | 0.93%(+1.70)#38 | 1.1%(+1.54)#2,307 |
| 39. | Napoleon | 2.5% | 0.93%(+1.62)#39 | 1.1%(+1.45)#2,447 |
| 40. | Mott | 2.5% | 0.93%(+1.59)#40 | 1.1%(+1.43)#2,496 |
| 41. | Glenburn | 2.4% | 0.93%(+1.50)#41 | 1.1%(+1.34)#2,635 |
| 42. | Hankinson | 2.4% | 0.93%(+1.48)#42 | 1.1%(+1.31)#2,674 |
| 43. | Esmond | 2.4% | 0.93%(+1.45)#43 | 1.1%(+1.29)#2,720 |
| 44. | Ellendale | 2.3% | 0.93%(+1.41)#44 | 1.1%(+1.25)#2,792 |
| 45. | Bowman | 2.3% | 0.93%(+1.37)#45 | 1.1%(+1.20)#2,857 |
| 46. | Underwood | 2.3% | 0.93%(+1.35)#46 | 1.1%(+1.19)#2,884 |
| 47. | Garrison | 2.0% | 0.93%(+1.11)#47 | 1.1%(+0.947)#3,354 |
| 48. | Amenia | 2.0% | 0.93%(+1.07)#48 | 1.1%(+0.909)#3,426 |
| 49. | Enderlin | 2.0% | 0.93%(+1.05)#49 | 1.1%(+0.887)#3,477 |
| 50. | Burlington | 2.0% | 0.93%(+1.04)#50 | 1.1%(+0.876)#3,504 |
| 51. | Frontier | 2.0% | 0.93%(+1.03)#51 | 1.1%(+0.870)#3,518 |
| 52. | Grafton | 2.0% | 0.93%(+1.03)#52 | 1.1%(+0.869)#3,521 |
| 53. | Wyndmere | 1.9% | 0.93%(+1.02)#53 | 1.1%(+0.855)#3,553 |
| 54. | Christine | 1.9% | 0.93%(+1.01)#54 | 1.1%(+0.851)#3,557 |
| 55. | Emerado | 1.9% | 0.93%(+0.995)#55 | 1.1%(+0.832)#3,600 |
| 56. | Hazen | 1.9% | 0.93%(+0.970)#56 | 1.1%(+0.807)#3,657 |
| 57. | New Rockford | 1.9% | 0.93%(+0.969)#57 | 1.1%(+0.807)#3,660 |
| 58. | Linton | 1.9% | 0.93%(+0.945)#58 | 1.1%(+0.783)#3,737 |
| 59. | Steele | 1.8% | 0.93%(+0.885)#59 | 1.1%(+0.723)#3,889 |
| 60. | Lamoure | 1.8% | 0.93%(+0.876)#60 | 1.1%(+0.713)#3,912 |
| 61. | Washburn | 1.7% | 0.93%(+0.813)#61 | 1.1%(+0.650)#4,096 |
| 62. | Reynolds | 1.7% | 0.93%(+0.745)#62 | 1.1%(+0.583)#4,295 |
| 63. | New England | 1.6% | 0.93%(+0.667)#63 | 1.1%(+0.505)#4,509 |
| 64. | Park River | 1.6% | 0.93%(+0.634)#64 | 1.1%(+0.472)#4,616 |
| 65. | Portal | 1.5% | 0.93%(+0.587)#65 | 1.1%(+0.424)#4,788 |
| 66. | Leonard | 1.5% | 0.93%(+0.553)#66 | 1.1%(+0.391)#4,929 |
| 67. | Northwood | 1.4% | 0.93%(+0.451)#67 | 1.1%(+0.288)#5,305 |
| 68. | St Thomas | 1.4% | 0.93%(+0.432)#68 | 1.1%(+0.270)#5,392 |
| 69. | Trenton | 1.3% | 0.93%(+0.414)#69 | 1.1%(+0.251)#5,478 |
| 70. | Stanley | 1.3% | 0.93%(+0.400)#70 | 1.1%(+0.238)#5,536 |
| 71. | Grand Forks | 1.3% | 0.93%(+0.360)#71 | 1.1%(+0.197)#5,730 |
| 72. | Langdon | 1.3% | 0.93%(+0.337)#72 | 1.1%(+0.175)#5,833 |
| 73. | Thompson | 1.3% | 0.93%(+0.335)#73 | 1.1%(+0.173)#5,847 |
| 74. | Neche | 1.3% | 0.93%(+0.322)#74 | 1.1%(+0.159)#5,899 |
| 75. | Kulm | 1.2% | 0.93%(+0.311)#75 | 1.1%(+0.149)#5,947 |
| 76. | Wilton | 1.2% | 0.93%(+0.295)#76 | 1.1%(+0.132)#6,017 |
| 77. | Max | 1.2% | 0.93%(+0.276)#77 | 1.1%(+0.114)#6,107 |
| 78. | Grandin | 1.2% | 0.93%(+0.262)#78 | 1.1%(+0.100)#6,180 |
| 79. | Jamestown | 1.2% | 0.93%(+0.260)#79 | 1.1%(+0.098)#6,185 |
| 80. | Dickinson | 1.2% | 0.93%(+0.258)#80 | 1.1%(+0.096)#6,195 |
| 81. | Reile S Acres | 1.2% | 0.93%(+0.239)#81 | 1.1%(+0.076)#6,292 |
| 82. | Surrey | 1.1% | 0.93%(+0.169)#82 | 1.1%(+0.006)#6,655 |
| 83. | Gilby | 1.1% | 0.93%(+0.164)#83 | 1.1%(+0.002)#6,684 |
| 84. | Casselton | 1.1% | 0.93%(+0.147)#84 | 1.1%(-0.016)#6,771 |
| 85. | Minot | 1.1% | 0.93%(+0.146)#85 | 1.1%(-0.016)#6,776 |
| 86. | Sherwood | 1.0% | 0.93%(+0.113)#86 | 1.1%(-0.049)#6,935 |
| 87. | Cando | 1.0% | 0.93%(+0.110)#87 | 1.1%(-0.053)#6,943 |
| 88. | Tower City | 1.0% | 0.93%(+0.103)#88 | 1.1%(-0.060)#6,988 |
| 89. | Fargo | 1.0% | 0.93%(+0.079)#89 | 1.1%(-0.083)#7,121 |
| 90. | Berthold | 1.0% | 0.93%(+0.077)#90 | 1.1%(-0.086)#7,141 |
| 91. | Oxbow | 1.0% | 0.93%(+0.072)#91 | 1.1%(-0.091)#7,178 |
| 92. | Devils Lake | 0.98% | 0.93%(+0.049)#92 | 1.1%(-0.114)#7,324 |
| 93. | Kindred | 0.96% | 0.93%(+0.031)#93 | 1.1%(-0.131)#7,442 |
| 94. | Hoople | 0.91% | 0.93%(-0.019)#94 | 1.1%(-0.182)#7,766 |
| 95. | Beach | 0.90% | 0.93%(-0.028)#95 | 1.1%(-0.190)#7,816 |
| 96. | Mapleton | 0.88% | 0.93%(-0.047)#96 | 1.1%(-0.210)#7,942 |
| 97. | Minot Afb | 0.88% | 0.93%(-0.049)#97 | 1.1%(-0.212)#7,957 |
| 98. | Rugby | 0.87% | 0.93%(-0.057)#98 | 1.1%(-0.219)#8,001 |
| 99. | Wing | 0.86% | 0.93%(-0.066)#99 | 1.1%(-0.229)#8,059 |
| 100. | Bismarck | 0.82% | 0.93%(-0.104)#100 | 1.1%(-0.267)#8,328 |
Common Questions
What are the Top 10 Cities with the Highest Percentage of Population Employed in Life, Physical & Social Science in North Dakota?
Top 10 Cities with the Highest Percentage of Population Employed in Life, Physical & Social Science in North Dakota are:
#1
50.0%
#2
33.3%
#3
21.4%
#4
20.8%
#5
17.6%
#6
14.8%
#7
14.7%
#8
13.3%
#9
10.2%
#10
9.6%
What city has the Highest Percentage of Population Employed in Life, Physical & Social Science in North Dakota?
Lawton has the Highest Percentage of Population Employed in Life, Physical & Social Science in North Dakota with 50.0%.
What is the Percentage of Population Employed in Life, Physical & Social Science in the State of North Dakota?
Percentage of Population Employed in Life, Physical & Social Science in North Dakota is 0.93%.
What is the Percentage of Population Employed in Life, Physical & Social Science in the United States?
Percentage of Population Employed in Life, Physical & Social Science in the United States is 1.1%.