Cities with the Highest Percentage of Population Employed in Life, Physical & Social Science in Connecticut
RELATED REPORTS & OPTIONS
Life, Physical & Social Science
Connecticut
Compare Cities
Map of Cities with the Highest Percentage of Population Employed in Life, Physical & Social Science in Connecticut
0.0%
15.0%
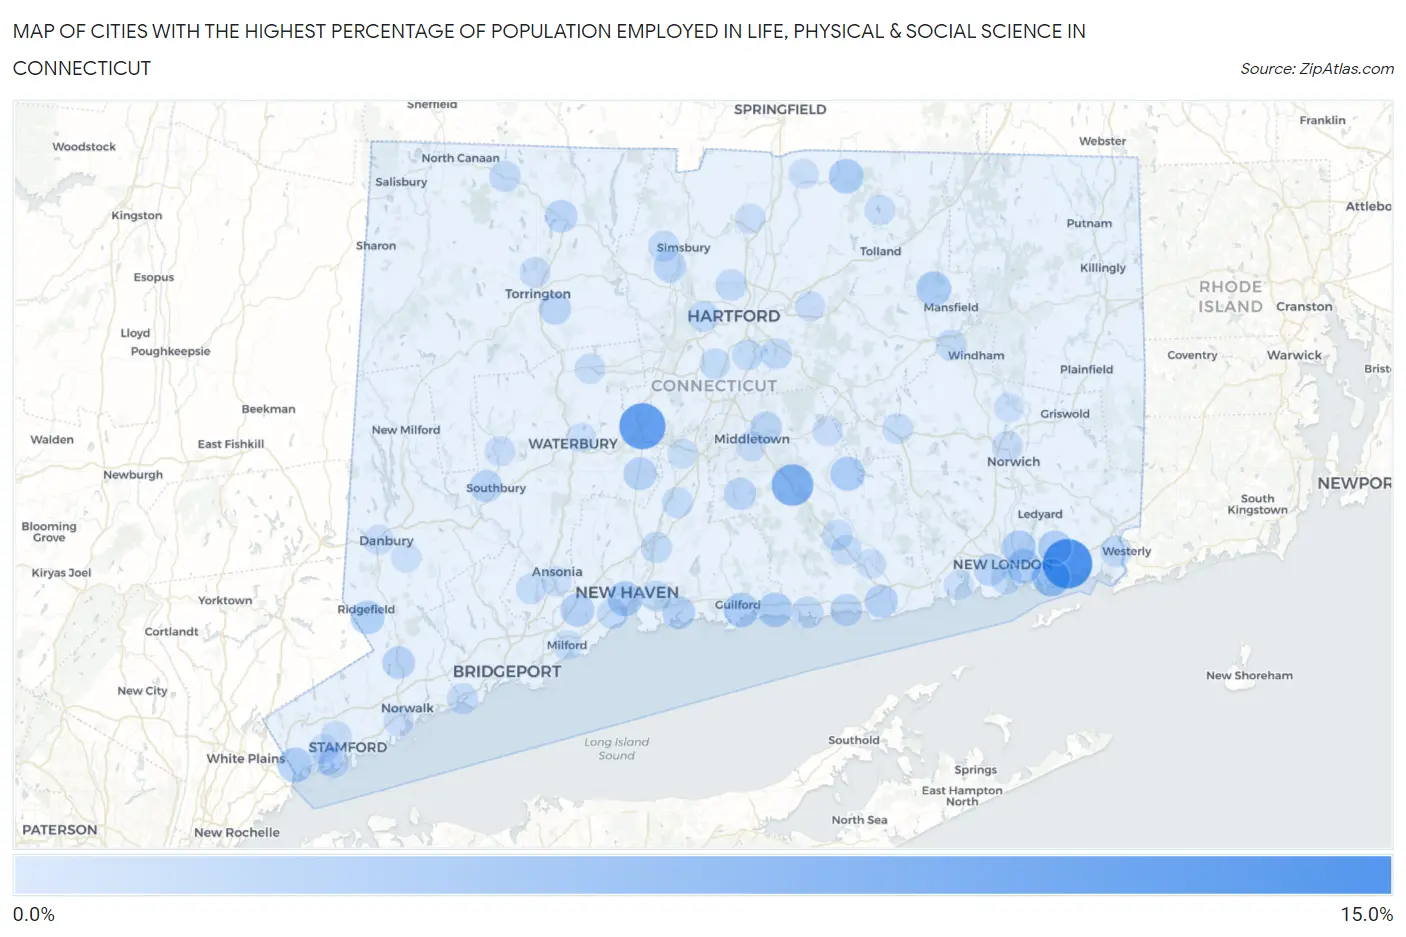
Cities with the Highest Percentage of Population Employed in Life, Physical & Social Science in Connecticut
| City | % Employed | vs State | vs National | |
| 1. | Mystic | 11.1% | 1.2%(+9.81)#1 | 1.1%(+9.96)#199 |
| 2. | Quasset Lake | 9.7% | 1.2%(+8.41)#2 | 1.1%(+8.56)#248 |
| 3. | Plantsville | 9.2% | 1.2%(+8.01)#3 | 1.1%(+8.16)#268 |
| 4. | Higganum | 6.8% | 1.2%(+5.52)#4 | 1.1%(+5.67)#463 |
| 5. | Ridgebury | 6.4% | 1.2%(+5.16)#5 | 1.1%(+5.31)#514 |
| 6. | Fenwick Borough | 5.9% | 1.2%(+4.64)#6 | 1.1%(+4.79)#602 |
| 7. | New Canaan | 5.7% | 1.2%(+4.41)#7 | 1.1%(+4.56)#642 |
| 8. | Noank | 4.8% | 1.2%(+3.52)#8 | 1.1%(+3.67)#861 |
| 9. | Groton Long Point Borough | 4.3% | 1.2%(+3.06)#9 | 1.1%(+3.21)#1,038 |
| 10. | Weston | 4.3% | 1.2%(+3.02)#10 | 1.1%(+3.17)#1,055 |
| 11. | Plattsville | 4.2% | 1.2%(+2.98)#11 | 1.1%(+3.13)#1,069 |
| 12. | Stonington Borough | 3.8% | 1.2%(+2.58)#12 | 1.1%(+2.73)#1,269 |
| 13. | Route 7 Gateway | 3.5% | 1.2%(+2.29)#13 | 1.1%(+2.44)#1,457 |
| 14. | Storrs | 3.3% | 1.2%(+2.02)#14 | 1.1%(+2.18)#1,638 |
| 15. | New Haven | 3.2% | 1.2%(+2.00)#15 | 1.1%(+2.15)#1,669 |
| 16. | Pemberwick | 3.2% | 1.2%(+1.98)#16 | 1.1%(+2.13)#1,673 |
| 17. | Lake Bungee | 3.2% | 1.2%(+1.93)#17 | 1.1%(+2.08)#1,718 |
| 18. | Guilford Center | 3.1% | 1.2%(+1.90)#18 | 1.1%(+2.05)#1,744 |
| 19. | Somers | 3.1% | 1.2%(+1.85)#19 | 1.1%(+2.00)#1,806 |
| 20. | Long Hill | 3.1% | 1.2%(+1.82)#20 | 1.1%(+1.97)#1,831 |
| 21. | Madison Center | 3.0% | 1.2%(+1.81)#21 | 1.1%(+1.96)#1,848 |
| 22. | Moodus | 3.0% | 1.2%(+1.76)#22 | 1.1%(+1.91)#1,883 |
| 23. | Conning Towers Nautilus Park | 2.9% | 1.2%(+1.67)#23 | 1.1%(+1.82)#1,954 |
| 24. | Old Mystic | 2.8% | 1.2%(+1.59)#24 | 1.1%(+1.74)#2,035 |
| 25. | Sandy Hook | 2.7% | 1.2%(+1.42)#25 | 1.1%(+1.57)#2,262 |
| 26. | Ridgefield | 2.7% | 1.2%(+1.42)#26 | 1.1%(+1.57)#2,267 |
| 27. | Orange | 2.5% | 1.2%(+1.29)#27 | 1.1%(+1.44)#2,464 |
| 28. | Lakes West | 2.5% | 1.2%(+1.27)#28 | 1.1%(+1.42)#2,500 |
| 29. | Old Saybrook Center | 2.4% | 1.2%(+1.13)#29 | 1.1%(+1.28)#2,736 |
| 30. | Branford Center | 2.3% | 1.2%(+1.08)#30 | 1.1%(+1.23)#2,823 |
| 31. | Murray | 2.3% | 1.2%(+1.07)#31 | 1.1%(+1.22)#2,838 |
| 32. | Cheshire Village | 2.3% | 1.2%(+1.04)#32 | 1.1%(+1.19)#2,875 |
| 33. | Old Hill | 2.1% | 1.2%(+0.892)#33 | 1.1%(+1.04)#3,161 |
| 34. | Wilton Center | 2.1% | 1.2%(+0.866)#34 | 1.1%(+1.02)#3,211 |
| 35. | Winsted | 2.1% | 1.2%(+0.815)#35 | 1.1%(+0.966)#3,298 |
| 36. | Heritage Village | 2.1% | 1.2%(+0.814)#36 | 1.1%(+0.964)#3,303 |
| 37. | Durham | 2.0% | 1.2%(+0.732)#37 | 1.1%(+0.883)#3,486 |
| 38. | Weatogue | 2.0% | 1.2%(+0.723)#38 | 1.1%(+0.874)#3,508 |
| 39. | Oronoque | 1.9% | 1.2%(+0.708)#39 | 1.1%(+0.859)#3,544 |
| 40. | Greens Farms | 1.9% | 1.2%(+0.699)#40 | 1.1%(+0.850)#3,559 |
| 41. | Inglenook | 1.9% | 1.2%(+0.696)#41 | 1.1%(+0.847)#3,566 |
| 42. | Waterford | 1.8% | 1.2%(+0.606)#42 | 1.1%(+0.757)#3,805 |
| 43. | Westbrook Center | 1.8% | 1.2%(+0.601)#43 | 1.1%(+0.752)#3,816 |
| 44. | Portland | 1.8% | 1.2%(+0.571)#44 | 1.1%(+0.722)#3,891 |
| 45. | Northwest Harwinton | 1.8% | 1.2%(+0.538)#45 | 1.1%(+0.689)#3,980 |
| 46. | Candlewood Isle | 1.8% | 1.2%(+0.525)#46 | 1.1%(+0.676)#4,025 |
| 47. | Pawcatuck | 1.7% | 1.2%(+0.442)#47 | 1.1%(+0.593)#4,266 |
| 48. | Litchfield Borough | 1.7% | 1.2%(+0.430)#48 | 1.1%(+0.581)#4,298 |
| 49. | South Wilton | 1.6% | 1.2%(+0.392)#49 | 1.1%(+0.543)#4,397 |
| 50. | Clinton | 1.6% | 1.2%(+0.383)#50 | 1.1%(+0.534)#4,424 |
| 51. | Saugatuck | 1.6% | 1.2%(+0.374)#51 | 1.1%(+0.525)#4,450 |
| 52. | Blue Hills | 1.5% | 1.2%(+0.287)#52 | 1.1%(+0.438)#4,737 |
| 53. | North Haven | 1.4% | 1.2%(+0.202)#53 | 1.1%(+0.353)#5,080 |
| 54. | Glastonbury Center | 1.4% | 1.2%(+0.198)#54 | 1.1%(+0.349)#5,096 |
| 55. | Trumbull Center | 1.4% | 1.2%(+0.197)#55 | 1.1%(+0.348)#5,097 |
| 56. | Norfolk | 1.4% | 1.2%(+0.183)#56 | 1.1%(+0.334)#5,168 |
| 57. | West Hartford | 1.4% | 1.2%(+0.166)#57 | 1.1%(+0.317)#5,217 |
| 58. | New London | 1.4% | 1.2%(+0.143)#58 | 1.1%(+0.294)#5,293 |
| 59. | Wallingford Center | 1.4% | 1.2%(+0.110)#59 | 1.1%(+0.260)#5,437 |
| 60. | Willimantic | 1.3% | 1.2%(+0.104)#60 | 1.1%(+0.255)#5,465 |
| 61. | Southport | 1.3% | 1.2%(+0.090)#61 | 1.1%(+0.241)#5,524 |
| 62. | East Haven | 1.3% | 1.2%(+0.084)#62 | 1.1%(+0.235)#5,547 |
| 63. | West Simsbury | 1.3% | 1.2%(+0.080)#63 | 1.1%(+0.231)#5,571 |
| 64. | Newington | 1.3% | 1.2%(+0.072)#64 | 1.1%(+0.223)#5,610 |
| 65. | West Haven | 1.3% | 1.2%(+0.034)#65 | 1.1%(+0.185)#5,787 |
| 66. | Wethersfield | 1.2% | 1.2%(-0.003)#66 | 1.1%(+0.148)#5,950 |
| 67. | Old Greenwich | 1.2% | 1.2%(-0.017)#67 | 1.1%(+0.134)#6,011 |
| 68. | Crystal Lake | 1.2% | 1.2%(-0.033)#68 | 1.1%(+0.118)#6,081 |
| 69. | Colchester | 1.2% | 1.2%(-0.043)#69 | 1.1%(+0.108)#6,133 |
| 70. | Norwich | 1.2% | 1.2%(-0.045)#70 | 1.1%(+0.106)#6,144 |
| 71. | Stamford | 1.2% | 1.2%(-0.046)#71 | 1.1%(+0.105)#6,154 |
| 72. | Staples | 1.2% | 1.2%(-0.072)#72 | 1.1%(+0.078)#6,285 |
| 73. | Chester Center | 1.2% | 1.2%(-0.074)#73 | 1.1%(+0.077)#6,289 |
| 74. | Deep River Center | 1.1% | 1.2%(-0.109)#74 | 1.1%(+0.042)#6,454 |
| 75. | Torrington | 1.1% | 1.2%(-0.122)#75 | 1.1%(+0.029)#6,515 |
| 76. | Terryville | 1.1% | 1.2%(-0.124)#76 | 1.1%(+0.027)#6,522 |
| 77. | Shelton | 1.1% | 1.2%(-0.153)#77 | 1.1%(-0.002)#6,706 |
| 78. | Derby | 1.0% | 1.2%(-0.205)#78 | 1.1%(-0.054)#6,950 |
| 79. | Lordship | 1.0% | 1.2%(-0.224)#79 | 1.1%(-0.073)#7,055 |
| 80. | Tashua | 1.0% | 1.2%(-0.226)#80 | 1.1%(-0.075)#7,068 |
| 81. | Danbury | 1.0% | 1.2%(-0.240)#81 | 1.1%(-0.089)#7,159 |
| 82. | Middletown | 0.99% | 1.2%(-0.253)#82 | 1.1%(-0.102)#7,245 |
| 83. | East Hampton | 0.96% | 1.2%(-0.283)#83 | 1.1%(-0.132)#7,447 |
| 84. | Norwalk | 0.96% | 1.2%(-0.287)#84 | 1.1%(-0.136)#7,460 |
| 85. | Noroton | 0.95% | 1.2%(-0.291)#85 | 1.1%(-0.140)#7,499 |
| 86. | Manchester | 0.95% | 1.2%(-0.294)#86 | 1.1%(-0.143)#7,512 |
| 87. | Woodmont Borough | 0.94% | 1.2%(-0.302)#87 | 1.1%(-0.151)#7,558 |
| 88. | Meriden | 0.94% | 1.2%(-0.302)#88 | 1.1%(-0.151)#7,559 |
| 89. | Windsor Locks | 0.93% | 1.2%(-0.313)#89 | 1.1%(-0.162)#7,624 |
| 90. | Woodbury Center | 0.91% | 1.2%(-0.333)#90 | 1.1%(-0.182)#7,759 |
| 91. | Riverside | 0.90% | 1.2%(-0.340)#91 | 1.1%(-0.189)#7,809 |
| 92. | Bethel | 0.88% | 1.2%(-0.364)#92 | 1.1%(-0.214)#7,966 |
| 93. | Cos Cob | 0.86% | 1.2%(-0.380)#93 | 1.1%(-0.229)#8,062 |
| 94. | Essex Village | 0.86% | 1.2%(-0.381)#94 | 1.1%(-0.231)#8,074 |
| 95. | Northford | 0.84% | 1.2%(-0.403)#95 | 1.1%(-0.252)#8,226 |
| 96. | Waterbury | 0.84% | 1.2%(-0.404)#96 | 1.1%(-0.253)#8,234 |
| 97. | Baltic | 0.82% | 1.2%(-0.419)#97 | 1.1%(-0.269)#8,342 |
| 98. | Milford City Balance | 0.81% | 1.2%(-0.432)#98 | 1.1%(-0.281)#8,414 |
| 99. | Hazardville | 0.81% | 1.2%(-0.435)#99 | 1.1%(-0.284)#8,429 |
| 100. | Niantic | 0.80% | 1.2%(-0.437)#100 | 1.1%(-0.286)#8,450 |
Common Questions
What are the Top 10 Cities with the Highest Percentage of Population Employed in Life, Physical & Social Science in Connecticut?
Top 10 Cities with the Highest Percentage of Population Employed in Life, Physical & Social Science in Connecticut are:
#1
11.1%
#2
9.2%
#3
6.8%
#4
4.8%
#5
3.3%
#6
3.2%
#7
3.2%
#8
3.1%
#9
3.1%
#10
3.1%
What city has the Highest Percentage of Population Employed in Life, Physical & Social Science in Connecticut?
Mystic has the Highest Percentage of Population Employed in Life, Physical & Social Science in Connecticut with 11.1%.
What is the Percentage of Population Employed in Life, Physical & Social Science in the State of Connecticut?
Percentage of Population Employed in Life, Physical & Social Science in Connecticut is 1.2%.
What is the Percentage of Population Employed in Life, Physical & Social Science in the United States?
Percentage of Population Employed in Life, Physical & Social Science in the United States is 1.1%.