Shaver Lake, CA Map & Demographics
Shaver Lake Map
Shaver Lake Overview
$62,868
PER CAPITA INCOME
$138,750
AVG FAMILY INCOME
$125,000
AVG HOUSEHOLD INCOME
60.2%
WAGE / INCOME GAP [ % ]
39.8¢/ $1
WAGE / INCOME GAP [ $ ]
0.33
INEQUALITY / GINI INDEX
306
TOTAL POPULATION
166
MALE POPULATION
140
FEMALE POPULATION
118.57
MALES / 100 FEMALES
84.34
FEMALES / 100 MALES
66.4
MEDIAN AGE
2.2
AVG FAMILY SIZE
1.8
AVG HOUSEHOLD SIZE
94
LABOR FORCE [ PEOPLE ]
31.5%
PERCENT IN LABOR FORCE
6.4%
UNEMPLOYMENT RATE
Shaver Lake Zip Codes
Shaver Lake Area Codes
Income in Shaver Lake
Income Overview in Shaver Lake
Per Capita Income in Shaver Lake is $62,868, while median incomes of families and households are $138,750 and $125,000 respectively.
| Characteristic | Number | Measure |
| Per Capita Income | 306 | $62,868 |
| Median Family Income | 118 | $138,750 |
| Mean Family Income | 118 | $132,726 |
| Median Household Income | 168 | $125,000 |
| Mean Household Income | 168 | $112,130 |
| Income Deficit | 118 | $0 |
| Wage / Income Gap (%) | 306 | 60.24% |
| Wage / Income Gap ($) | 306 | 39.76¢ per $1 |
| Gini / Inequality Index | 306 | 0.33 |
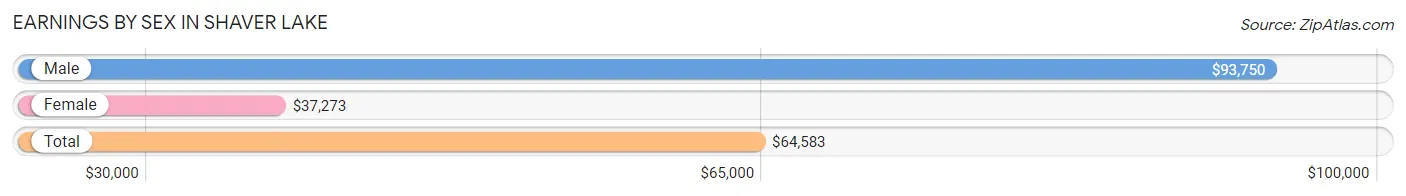
Earnings by Sex in Shaver Lake
Average Earnings in Shaver Lake are $64,583, $93,750 for men and $37,273 for women, a difference of 60.2%.
| Sex | Number | Average Earnings |
| Male | 56 (57.1%) | $93,750 |
| Female | 42 (42.9%) | $37,273 |
| Total | 98 (100.0%) | $64,583 |
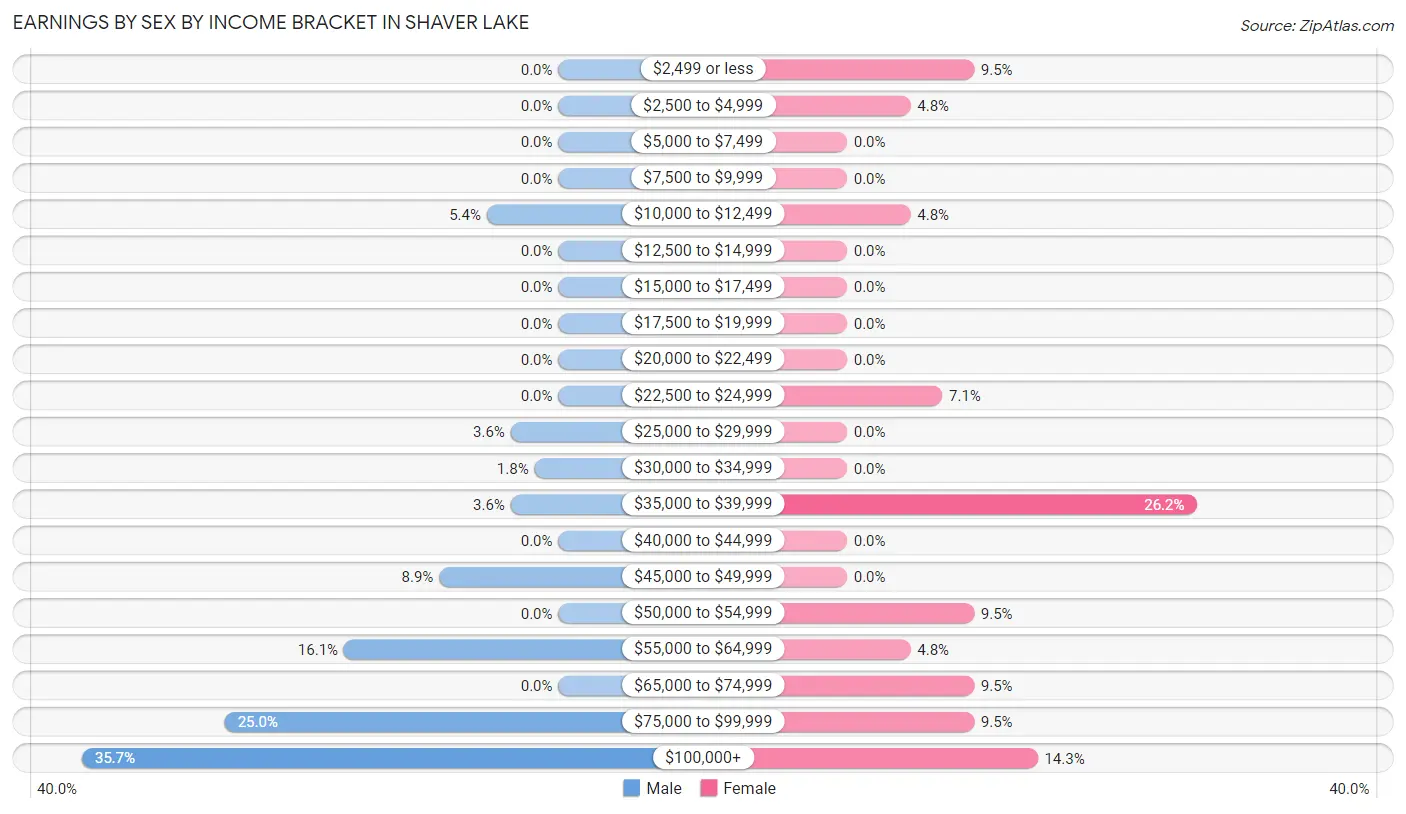
Earnings by Sex by Income Bracket in Shaver Lake
The most common earnings brackets in Shaver Lake are $100,000+ for men (20 | 35.7%) and $35,000 to $39,999 for women (11 | 26.2%).
| Income | Male | Female |
| $2,499 or less | 0 (0.0%) | 4 (9.5%) |
| $2,500 to $4,999 | 0 (0.0%) | 2 (4.8%) |
| $5,000 to $7,499 | 0 (0.0%) | 0 (0.0%) |
| $7,500 to $9,999 | 0 (0.0%) | 0 (0.0%) |
| $10,000 to $12,499 | 3 (5.4%) | 2 (4.8%) |
| $12,500 to $14,999 | 0 (0.0%) | 0 (0.0%) |
| $15,000 to $17,499 | 0 (0.0%) | 0 (0.0%) |
| $17,500 to $19,999 | 0 (0.0%) | 0 (0.0%) |
| $20,000 to $22,499 | 0 (0.0%) | 0 (0.0%) |
| $22,500 to $24,999 | 0 (0.0%) | 3 (7.1%) |
| $25,000 to $29,999 | 2 (3.6%) | 0 (0.0%) |
| $30,000 to $34,999 | 1 (1.8%) | 0 (0.0%) |
| $35,000 to $39,999 | 2 (3.6%) | 11 (26.2%) |
| $40,000 to $44,999 | 0 (0.0%) | 0 (0.0%) |
| $45,000 to $49,999 | 5 (8.9%) | 0 (0.0%) |
| $50,000 to $54,999 | 0 (0.0%) | 4 (9.5%) |
| $55,000 to $64,999 | 9 (16.1%) | 2 (4.8%) |
| $65,000 to $74,999 | 0 (0.0%) | 4 (9.5%) |
| $75,000 to $99,999 | 14 (25.0%) | 4 (9.5%) |
| $100,000+ | 20 (35.7%) | 6 (14.3%) |
| Total | 56 (100.0%) | 42 (100.0%) |
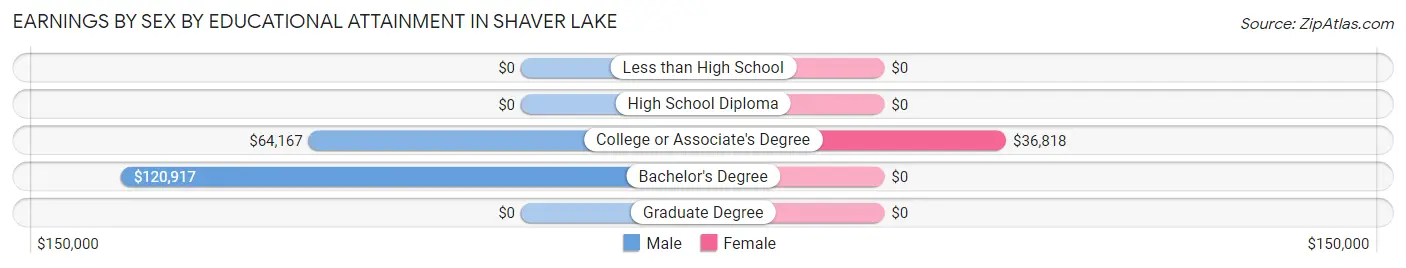
Earnings by Sex by Educational Attainment in Shaver Lake
Average earnings in Shaver Lake are $93,750 for men and $37,273 for women, a difference of 60.2%. Men with an educational attainment of bachelor's degree enjoy the highest average annual earnings of $120,917, while those with college or associate's degree education earn the least with $64,167. Women with an educational attainment of college or associate's degree earn the most with the average annual earnings of $36,818, while those with college or associate's degree education have the smallest earnings of $36,818.
| Educational Attainment | Male Income | Female Income |
| Less than High School | - | - |
| High School Diploma | - | - |
| College or Associate's Degree | $64,167 | $36,818 |
| Bachelor's Degree | $120,917 | $0 |
| Graduate Degree | - | - |
| Total | $93,750 | $37,273 |
Family Income in Shaver Lake
Family Income Brackets in Shaver Lake
According to the Shaver Lake family income data, there are 48 families falling into the $150,000 to $199,999 income range, which is the most common income bracket and makes up 40.7% of all families.
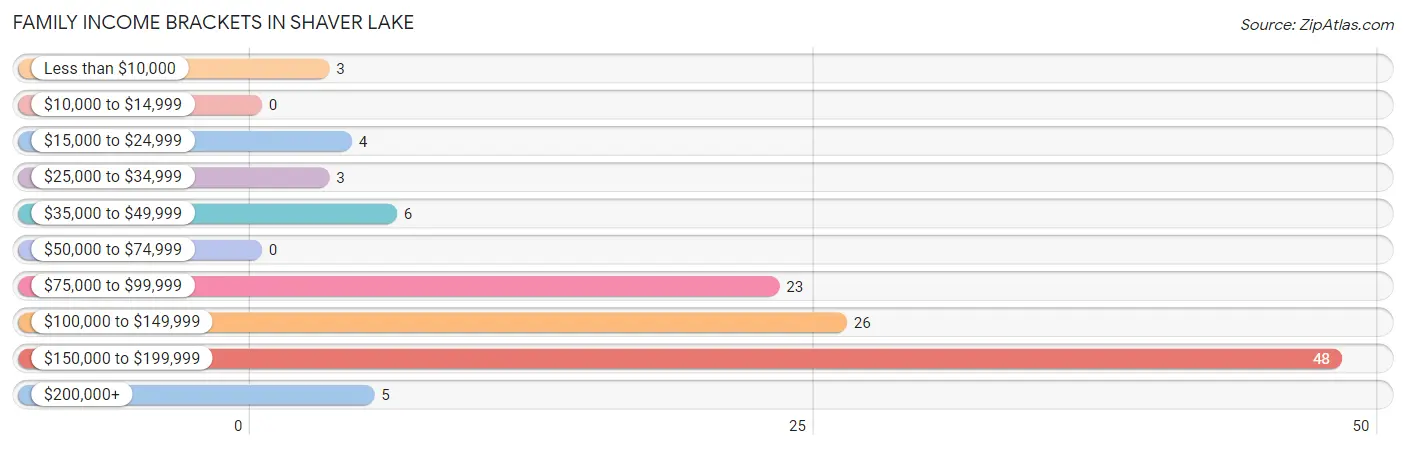
| Income Bracket | # Families | % Families |
| Less than $10,000 | 3 | 2.5% |
| $10,000 to $14,999 | 0 | 0.0% |
| $15,000 to $24,999 | 4 | 3.4% |
| $25,000 to $34,999 | 3 | 2.5% |
| $35,000 to $49,999 | 6 | 5.1% |
| $50,000 to $74,999 | 0 | 0.0% |
| $75,000 to $99,999 | 23 | 19.5% |
| $100,000 to $149,999 | 26 | 22.0% |
| $150,000 to $199,999 | 48 | 40.7% |
| $200,000+ | 5 | 4.2% |
Family Income by Famaliy Size in Shaver Lake
3-person families (6 | 5.1%) account for the highest median family income in Shaver Lake with $163,750 per family, while 2-person families (108 | 91.5%) have the highest median income of $68,334 per family member.
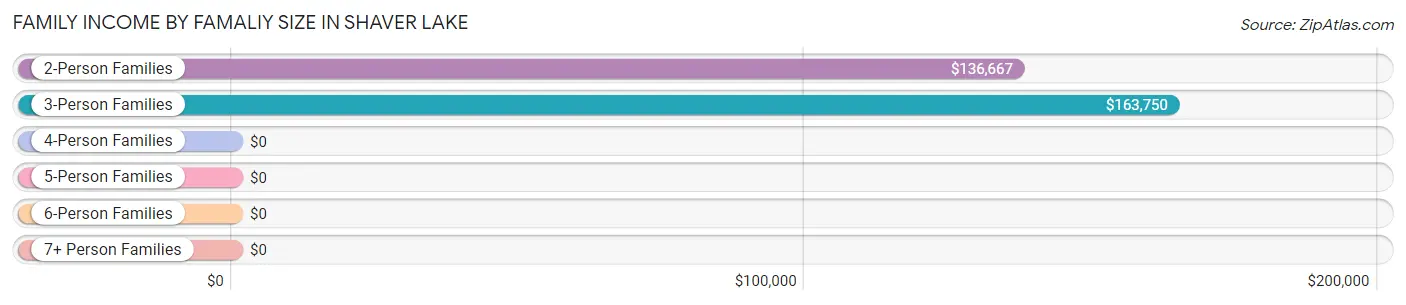
| Income Bracket | # Families | Median Income |
| 2-Person Families | 108 (91.5%) | $136,667 |
| 3-Person Families | 6 (5.1%) | $163,750 |
| 4-Person Families | 2 (1.7%) | $0 |
| 5-Person Families | 2 (1.7%) | $0 |
| 6-Person Families | 0 (0.0%) | $0 |
| 7+ Person Families | 0 (0.0%) | $0 |
| Total | 118 (100.0%) | $138,750 |
Family Income by Number of Earners in Shaver Lake
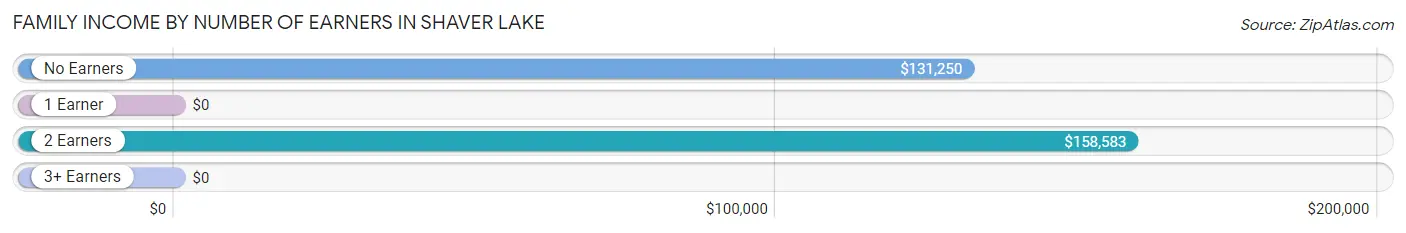
| Number of Earners | # Families | Median Income |
| No Earners | 66 (55.9%) | $131,250 |
| 1 Earner | 19 (16.1%) | $0 |
| 2 Earners | 33 (28.0%) | $158,583 |
| 3+ Earners | 0 (0.0%) | $0 |
| Total | 118 (100.0%) | $138,750 |
Household Income in Shaver Lake
Household Income Brackets in Shaver Lake
With 48 households falling in the category, the $150,000 to $199,999 income range is the most frequent in Shaver Lake, accounting for 28.6% of all households. In contrast, only 5 households (3.0%) fall into the $200,000+ income bracket, making it the least populous group.
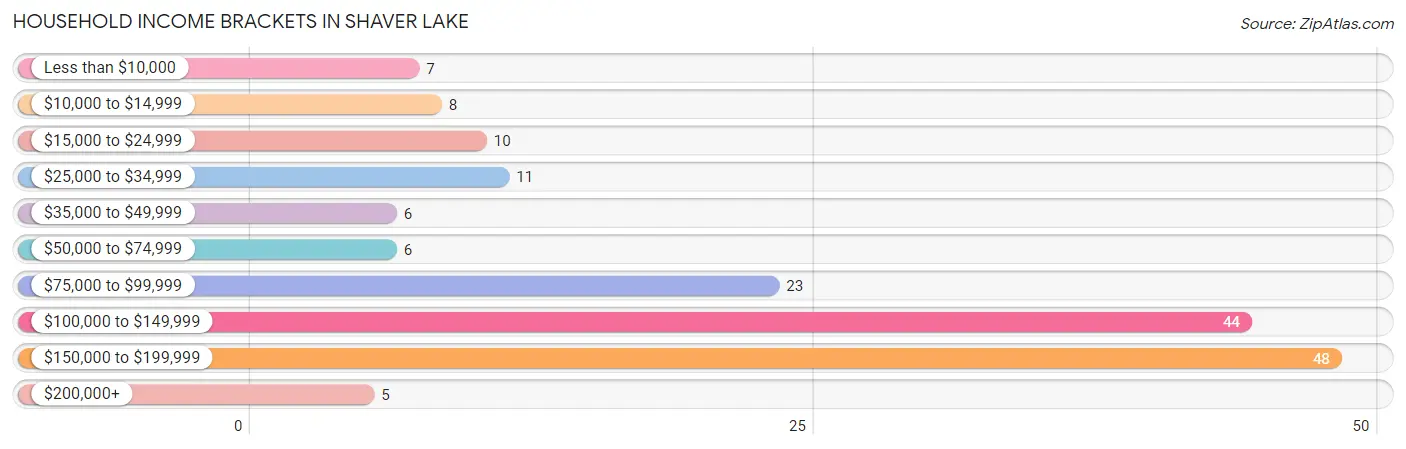
| Income Bracket | # Households | % Households |
| Less than $10,000 | 7 | 4.2% |
| $10,000 to $14,999 | 8 | 4.8% |
| $15,000 to $24,999 | 10 | 6.0% |
| $25,000 to $34,999 | 11 | 6.5% |
| $35,000 to $49,999 | 6 | 3.6% |
| $50,000 to $74,999 | 6 | 3.6% |
| $75,000 to $99,999 | 23 | 13.7% |
| $100,000 to $149,999 | 44 | 26.2% |
| $150,000 to $199,999 | 48 | 28.6% |
| $200,000+ | 5 | 3.0% |
Household Income by Householder Age in Shaver Lake
The median household income in Shaver Lake is $125,000, with the highest median household income of $158,500 found in the 25 to 44 years age bracket for the primary householder. A total of 26 households (15.5%) fall into this category.
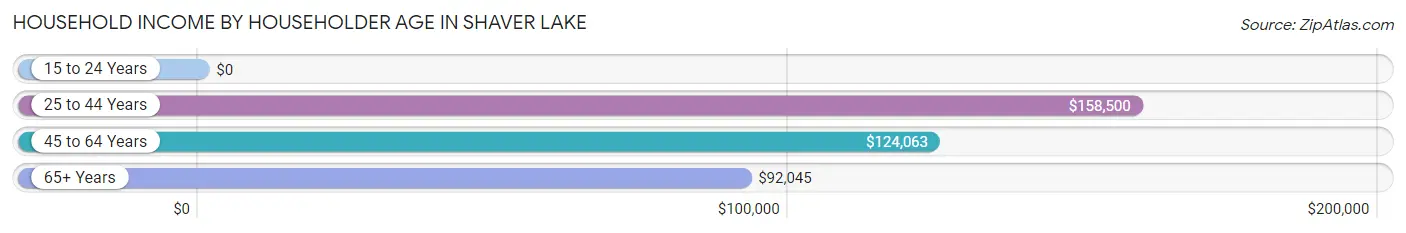
| Income Bracket | # Households | Median Income |
| 15 to 24 Years | 0 (0.0%) | $0 |
| 25 to 44 Years | 26 (15.5%) | $158,500 |
| 45 to 64 Years | 40 (23.8%) | $124,063 |
| 65+ Years | 102 (60.7%) | $92,045 |
| Total | 168 (100.0%) | $125,000 |
Poverty in Shaver Lake
Income Below Poverty by Sex and Age in Shaver Lake
With 9.0% poverty level for males and 5.0% for females among the residents of Shaver Lake, 25 to 34 year old males and 55 to 64 year old females are the most vulnerable to poverty, with 3 males (25.0%) and 5 females (17.9%) in their respective age groups living below the poverty level.
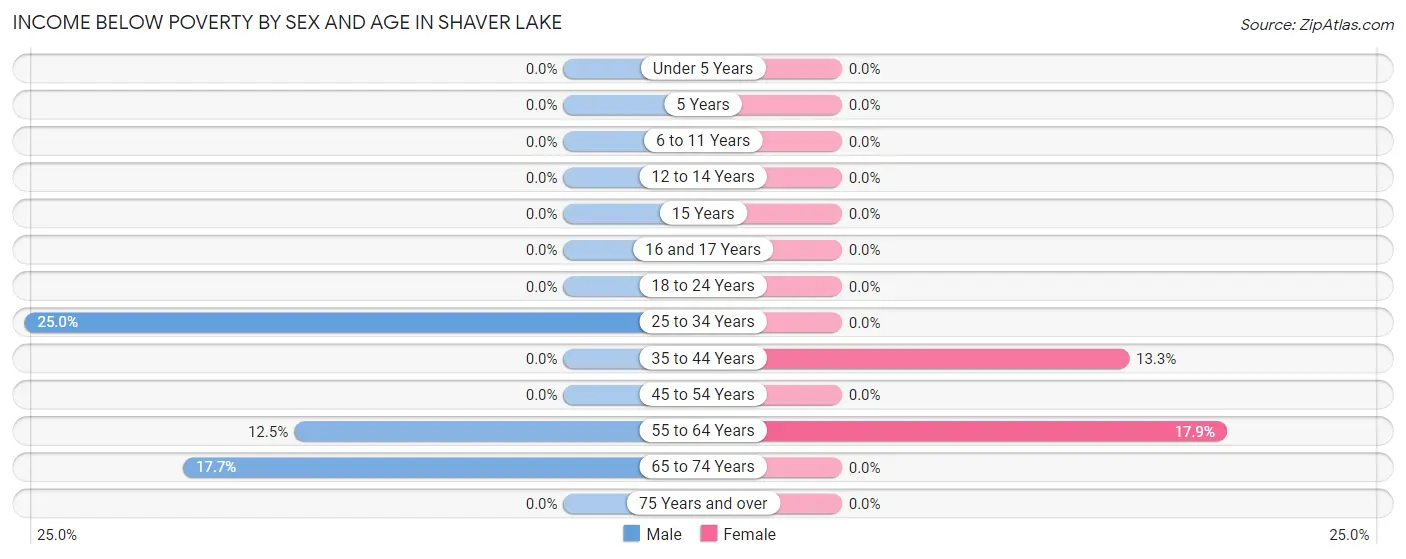
| Age Bracket | Male | Female |
| Under 5 Years | 0 (0.0%) | 0 (0.0%) |
| 5 Years | 0 (0.0%) | 0 (0.0%) |
| 6 to 11 Years | 0 (0.0%) | 0 (0.0%) |
| 12 to 14 Years | 0 (0.0%) | 0 (0.0%) |
| 15 Years | 0 (0.0%) | 0 (0.0%) |
| 16 and 17 Years | 0 (0.0%) | 0 (0.0%) |
| 18 to 24 Years | 0 (0.0%) | 0 (0.0%) |
| 25 to 34 Years | 3 (25.0%) | 0 (0.0%) |
| 35 to 44 Years | 0 (0.0%) | 2 (13.3%) |
| 45 to 54 Years | 0 (0.0%) | 0 (0.0%) |
| 55 to 64 Years | 3 (12.5%) | 5 (17.9%) |
| 65 to 74 Years | 9 (17.6%) | 0 (0.0%) |
| 75 Years and over | 0 (0.0%) | 0 (0.0%) |
| Total | 15 (9.0%) | 7 (5.0%) |
Income Above Poverty by Sex and Age in Shaver Lake
According to the poverty statistics in Shaver Lake, males aged 12 to 14 years and females aged under 5 years are the age groups that are most secure financially, with 100.0% of males and 100.0% of females in these age groups living above the poverty line.
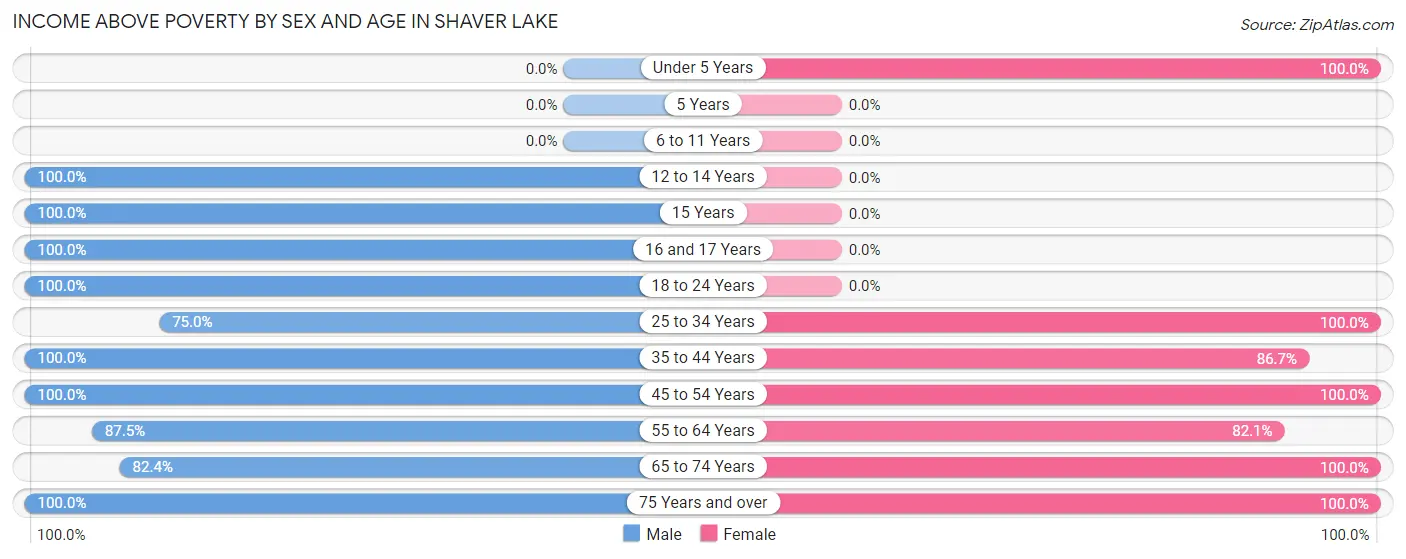
| Age Bracket | Male | Female |
| Under 5 Years | 0 (0.0%) | 2 (100.0%) |
| 5 Years | 0 (0.0%) | 0 (0.0%) |
| 6 to 11 Years | 0 (0.0%) | 0 (0.0%) |
| 12 to 14 Years | 3 (100.0%) | 0 (0.0%) |
| 15 Years | 3 (100.0%) | 0 (0.0%) |
| 16 and 17 Years | 3 (100.0%) | 0 (0.0%) |
| 18 to 24 Years | 3 (100.0%) | 0 (0.0%) |
| 25 to 34 Years | 9 (75.0%) | 4 (100.0%) |
| 35 to 44 Years | 22 (100.0%) | 13 (86.7%) |
| 45 to 54 Years | 3 (100.0%) | 10 (100.0%) |
| 55 to 64 Years | 21 (87.5%) | 23 (82.1%) |
| 65 to 74 Years | 42 (82.4%) | 44 (100.0%) |
| 75 Years and over | 42 (100.0%) | 37 (100.0%) |
| Total | 151 (91.0%) | 133 (95.0%) |
Income Below Poverty Among Married-Couple Families in Shaver Lake
The poverty statistics for married-couple families in Shaver Lake show that 4.6% or 5 of the total 109 families live below the poverty line. Families with no children have the highest poverty rate of 4.8%, comprising of 5 families. On the other hand, families with 1 or 2 children have the lowest poverty rate of 0.0%, which includes 0 families.
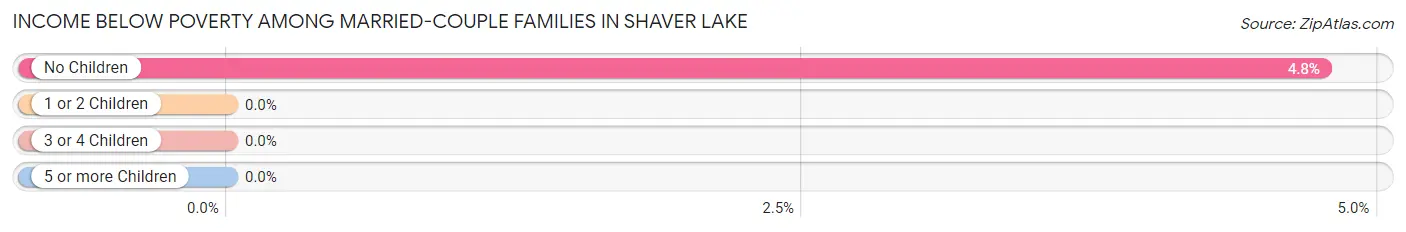
| Children | Above Poverty | Below Poverty |
| No Children | 100 (95.2%) | 5 (4.8%) |
| 1 or 2 Children | 4 (100.0%) | 0 (0.0%) |
| 3 or 4 Children | 0 (0.0%) | 0 (0.0%) |
| 5 or more Children | 0 (0.0%) | 0 (0.0%) |
| Total | 104 (95.4%) | 5 (4.6%) |
Income Below Poverty Among Single-Parent Households in Shaver Lake
| Children | Single Father | Single Mother |
| No Children | 0 (0.0%) | 0 (0.0%) |
| 1 or 2 Children | 0 (0.0%) | 0 (0.0%) |
| 3 or 4 Children | 0 (0.0%) | 0 (0.0%) |
| 5 or more Children | 0 (0.0%) | 0 (0.0%) |
| Total | 0 (0.0%) | 0 (0.0%) |
Income Below Poverty Among Married-Couple vs Single-Parent Households in Shaver Lake
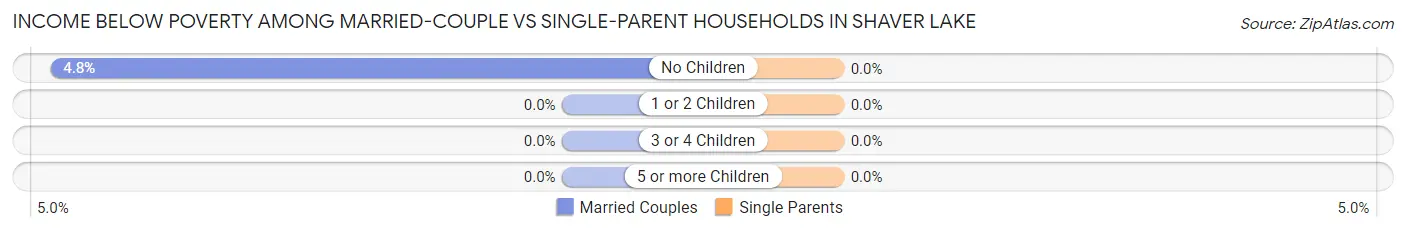
| Children | Married-Couple Families | Single-Parent Households |
| No Children | 5 (4.8%) | 0 (0.0%) |
| 1 or 2 Children | 0 (0.0%) | 0 (0.0%) |
| 3 or 4 Children | 0 (0.0%) | 0 (0.0%) |
| 5 or more Children | 0 (0.0%) | 0 (0.0%) |
| Total | 5 (4.6%) | 0 (0.0%) |
Race in Shaver Lake
The most populous races in Shaver Lake are White / Caucasian (263 | 86.0%), Hispanic or Latino (63 | 20.6%), and Two or more Races (30 | 9.8%).
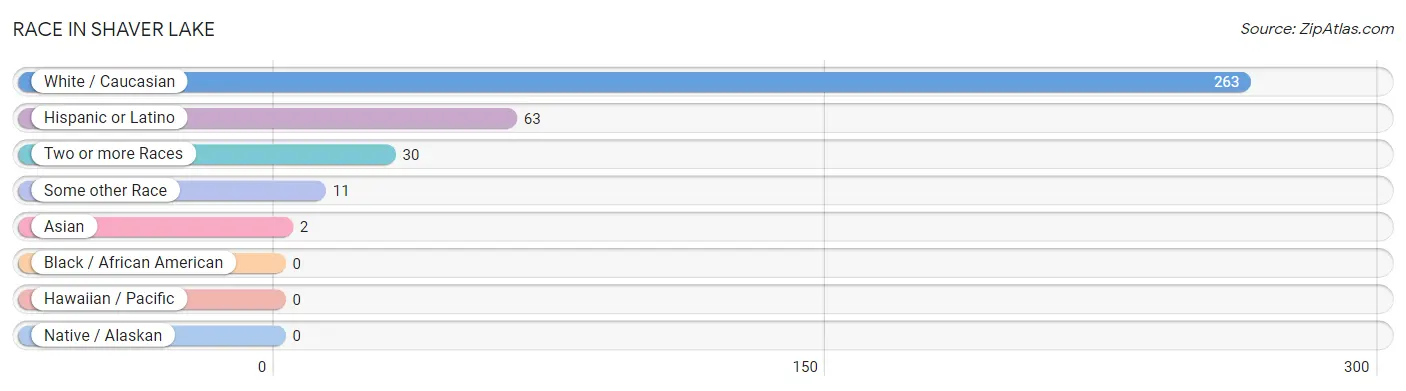
| Race | # Population | % Population |
| Asian | 2 | 0.6% |
| Black / African American | 0 | 0.0% |
| Hawaiian / Pacific | 0 | 0.0% |
| Hispanic or Latino | 63 | 20.6% |
| Native / Alaskan | 0 | 0.0% |
| White / Caucasian | 263 | 86.0% |
| Two or more Races | 30 | 9.8% |
| Some other Race | 11 | 3.6% |
| Total | 306 | 100.0% |
Ancestry in Shaver Lake
The most populous ancestries reported in Shaver Lake are English (61 | 19.9%), Mexican (61 | 19.9%), German (40 | 13.1%), Irish (38 | 12.4%), and Italian (25 | 8.2%), together accounting for 73.5% of all Shaver Lake residents.
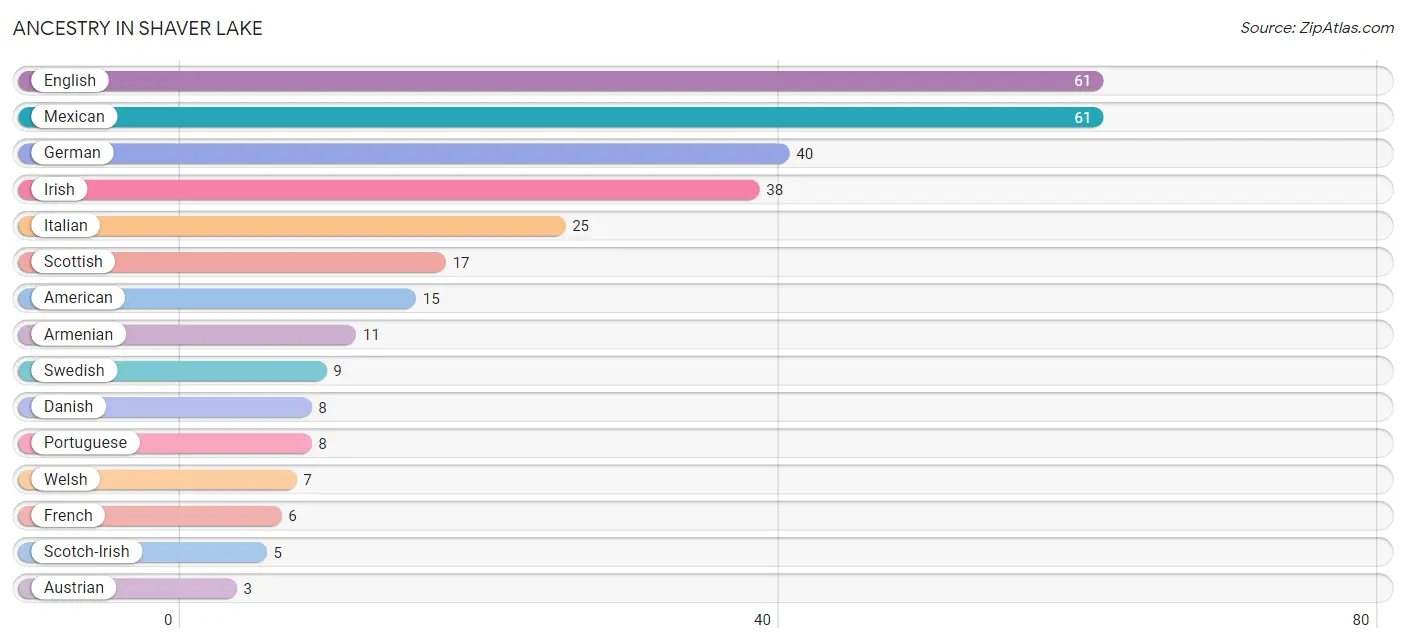
| Ancestry | # Population | % Population |
| American | 15 | 4.9% |
| Armenian | 11 | 3.6% |
| Austrian | 3 | 1.0% |
| Bhutanese | 2 | 0.6% |
| British | 2 | 0.6% |
| Czech | 1 | 0.3% |
| Danish | 8 | 2.6% |
| Dutch | 3 | 1.0% |
| Dutch West Indian | 2 | 0.6% |
| Eastern European | 2 | 0.6% |
| English | 61 | 19.9% |
| French | 6 | 2.0% |
| German | 40 | 13.1% |
| Irish | 38 | 12.4% |
| Italian | 25 | 8.2% |
| Mexican | 61 | 19.9% |
| Norwegian | 1 | 0.3% |
| Polish | 3 | 1.0% |
| Portuguese | 8 | 2.6% |
| Puerto Rican | 2 | 0.6% |
| Scotch-Irish | 5 | 1.6% |
| Scottish | 17 | 5.6% |
| Swedish | 9 | 2.9% |
| Welsh | 7 | 2.3% | View All 24 Rows |
Immigrants in Shaver Lake
The most numerous immigrant groups reported in Shaver Lake came from Asia (2 | 0.6%), Eastern Asia (2 | 0.6%), Europe (2 | 0.6%), Japan (2 | 0.6%), and Netherlands (2 | 0.6%), together accounting for 3.3% of all Shaver Lake residents.
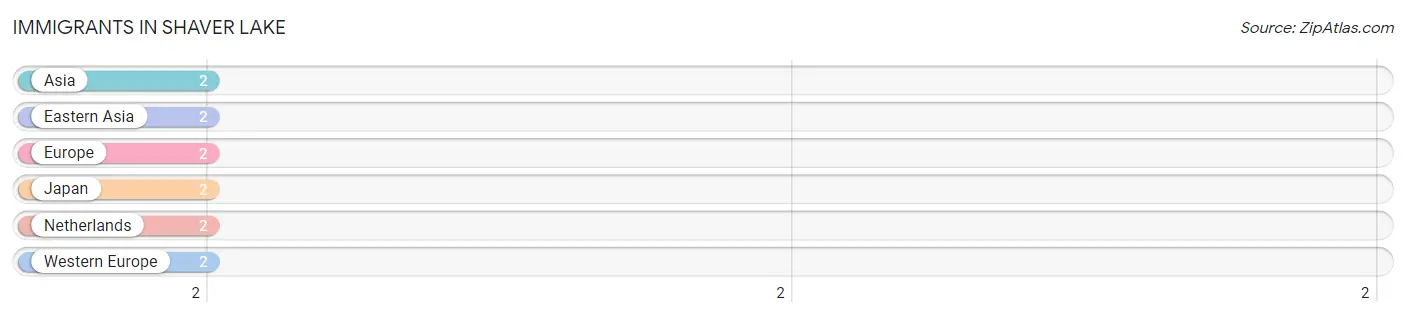
| Immigration Origin | # Population | % Population |
| Asia | 2 | 0.6% |
| Eastern Asia | 2 | 0.6% |
| Europe | 2 | 0.6% |
| Japan | 2 | 0.6% |
| Netherlands | 2 | 0.6% |
| Western Europe | 2 | 0.6% | View All 6 Rows |
Sex and Age in Shaver Lake
Sex and Age in Shaver Lake
The most populous age groups in Shaver Lake are 70 to 74 Years (28 | 16.9%) for men and 70 to 74 Years (28 | 20.0%) for women.
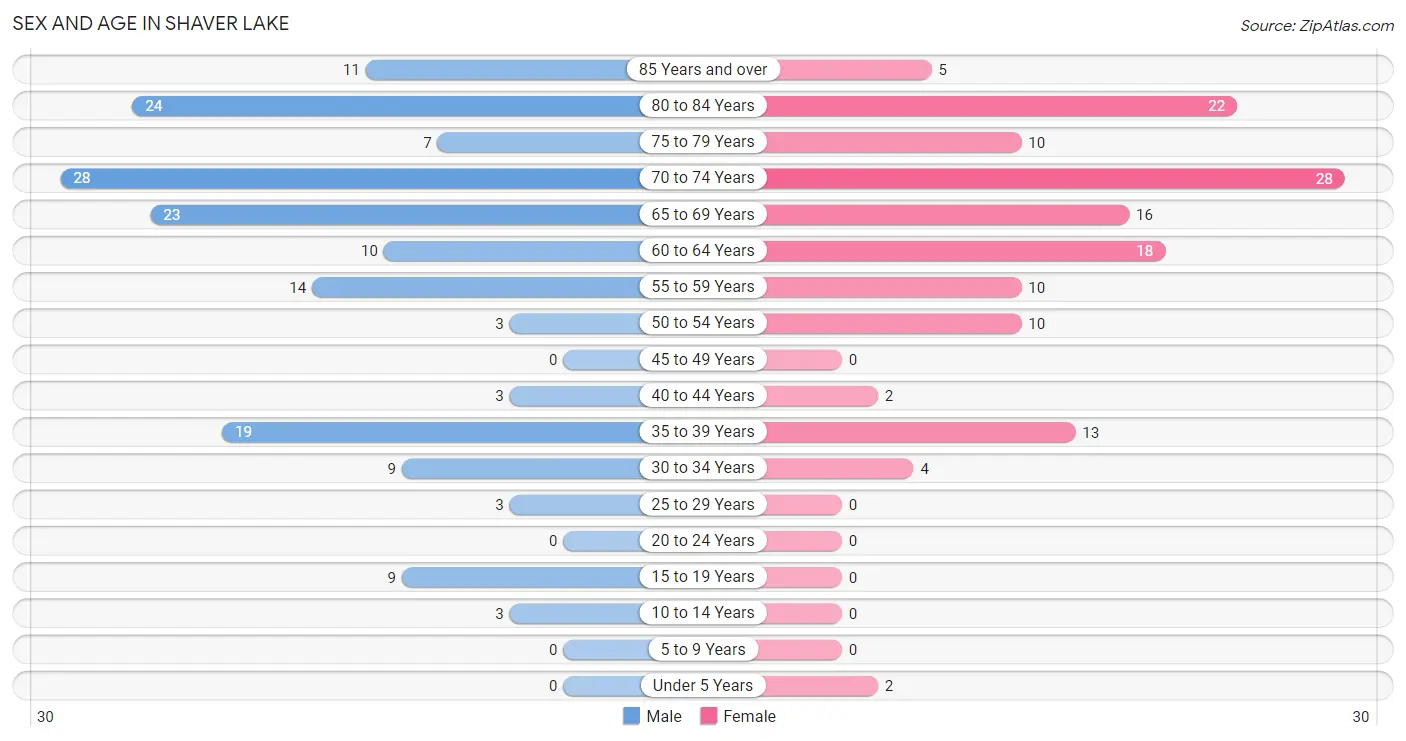
| Age Bracket | Male | Female |
| Under 5 Years | 0 (0.0%) | 2 (1.4%) |
| 5 to 9 Years | 0 (0.0%) | 0 (0.0%) |
| 10 to 14 Years | 3 (1.8%) | 0 (0.0%) |
| 15 to 19 Years | 9 (5.4%) | 0 (0.0%) |
| 20 to 24 Years | 0 (0.0%) | 0 (0.0%) |
| 25 to 29 Years | 3 (1.8%) | 0 (0.0%) |
| 30 to 34 Years | 9 (5.4%) | 4 (2.9%) |
| 35 to 39 Years | 19 (11.5%) | 13 (9.3%) |
| 40 to 44 Years | 3 (1.8%) | 2 (1.4%) |
| 45 to 49 Years | 0 (0.0%) | 0 (0.0%) |
| 50 to 54 Years | 3 (1.8%) | 10 (7.1%) |
| 55 to 59 Years | 14 (8.4%) | 10 (7.1%) |
| 60 to 64 Years | 10 (6.0%) | 18 (12.9%) |
| 65 to 69 Years | 23 (13.9%) | 16 (11.4%) |
| 70 to 74 Years | 28 (16.9%) | 28 (20.0%) |
| 75 to 79 Years | 7 (4.2%) | 10 (7.1%) |
| 80 to 84 Years | 24 (14.5%) | 22 (15.7%) |
| 85 Years and over | 11 (6.6%) | 5 (3.6%) |
| Total | 166 (100.0%) | 140 (100.0%) |
Families and Households in Shaver Lake
Median Family Size in Shaver Lake
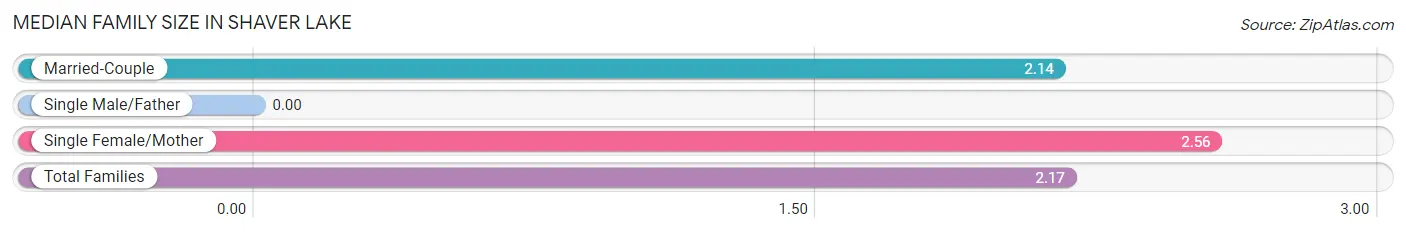
| Family Type | # Families | Family Size |
| Married-Couple | 109 (92.4%) | 2.14 |
| Single Male/Father | 0 (0.0%) | - |
| Single Female/Mother | 9 (7.6%) | 2.56 |
| Total Families | 118 (100.0%) | 2.17 |
Median Household Size in Shaver Lake
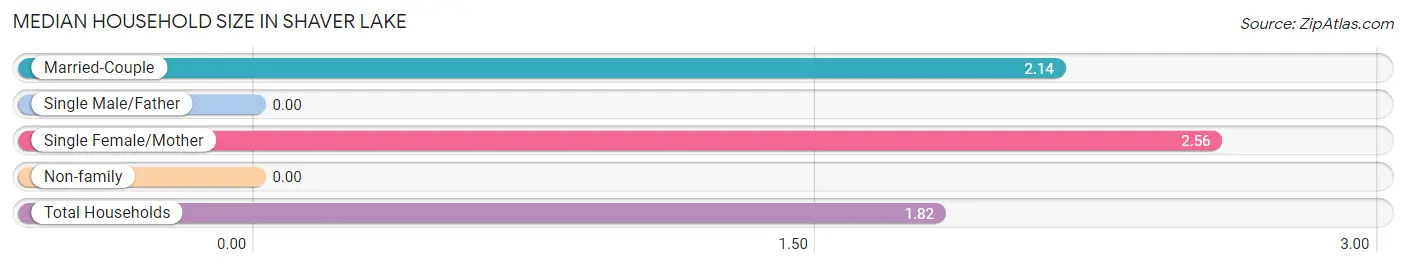
| Household Type | # Households | Household Size |
| Married-Couple | 109 (64.9%) | 2.14 |
| Single Male/Father | 0 (0.0%) | - |
| Single Female/Mother | 9 (5.4%) | 2.56 |
| Non-family | 50 (29.8%) | - |
| Total Households | 168 (100.0%) | 1.82 |
Household Size by Marriage Status in Shaver Lake
Out of a total of 168 households in Shaver Lake, 118 (70.2%) are family households, while 50 (29.8%) are nonfamily households. The most numerous type of family households are 2-person households, comprising 108, and the most common type of nonfamily households are 1-person households, comprising 50.
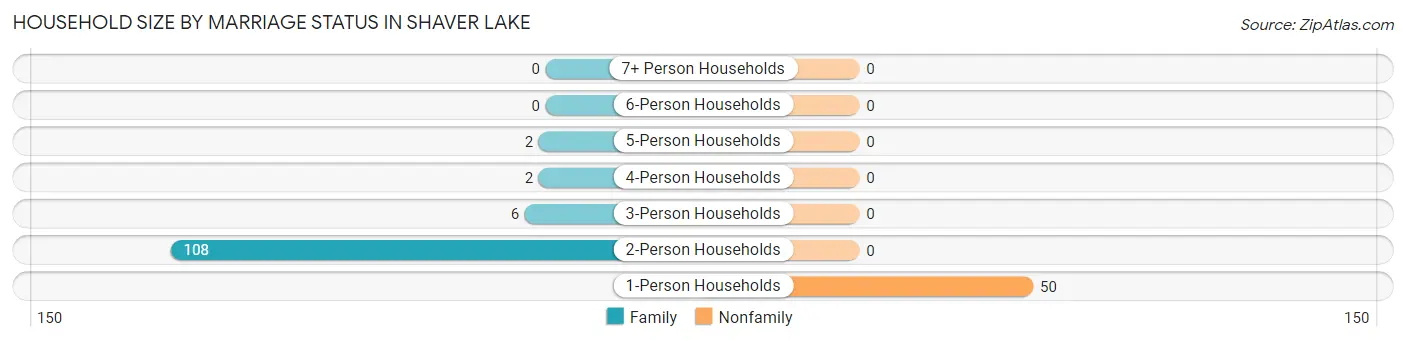
| Household Size | Family Households | Nonfamily Households |
| 1-Person Households | - | 50 (29.8%) |
| 2-Person Households | 108 (64.3%) | 0 (0.0%) |
| 3-Person Households | 6 (3.6%) | 0 (0.0%) |
| 4-Person Households | 2 (1.2%) | 0 (0.0%) |
| 5-Person Households | 2 (1.2%) | 0 (0.0%) |
| 6-Person Households | 0 (0.0%) | 0 (0.0%) |
| 7+ Person Households | 0 (0.0%) | 0 (0.0%) |
| Total | 118 (70.2%) | 50 (29.8%) |
Female Fertility in Shaver Lake
Fertility by Age in Shaver Lake
| Age Bracket | Women with Births | Births / 1,000 Women |
| 15 to 19 years | 0 (0.0%) | 0.0 |
| 20 to 34 years | 0 (0.0%) | 0.0 |
| 35 to 50 years | 0 (0.0%) | 0.0 |
| Total | 0 (0.0%) | 0.0 |
Fertility by Age by Marriage Status in Shaver Lake
| Age Bracket | Married | Unmarried |
| 15 to 19 years | 0 (0.0%) | 0 (0.0%) |
| 20 to 34 years | 0 (0.0%) | 0 (0.0%) |
| 35 to 50 years | 0 (0.0%) | 0 (0.0%) |
| Total | 0 (0.0%) | 0 (0.0%) |
Fertility by Education in Shaver Lake
| Educational Attainment | Women with Births | Births / 1,000 Women |
| Less than High School | 0 (0.0%) | 0.0 |
| High School Diploma | 0 (0.0%) | 0.0 |
| College or Associate's Degree | 0 (0.0%) | 0.0 |
| Bachelor's Degree | 0 (0.0%) | 0.0 |
| Graduate Degree | 0 (0.0%) | 0.0 |
| Total | 0 (0.0%) | 0.0 |
Fertility by Education by Marriage Status in Shaver Lake
| Educational Attainment | Married | Unmarried |
| Less than High School | 0 (0.0%) | 0 (0.0%) |
| High School Diploma | 0 (0.0%) | 0 (0.0%) |
| College or Associate's Degree | 0 (0.0%) | 0 (0.0%) |
| Bachelor's Degree | 0 (0.0%) | 0 (0.0%) |
| Graduate Degree | 0 (0.0%) | 0 (0.0%) |
| Total | 0 (0.0%) | 0 (0.0%) |
Employment Characteristics in Shaver Lake
Employment by Class of Employer in Shaver Lake
Among the 88 employed individuals in Shaver Lake, private company employees (61 | 69.3%), self-employed (not incorporated) (18 | 20.4%), and federal government employees (5 | 5.7%) make up the most common classes of employment.
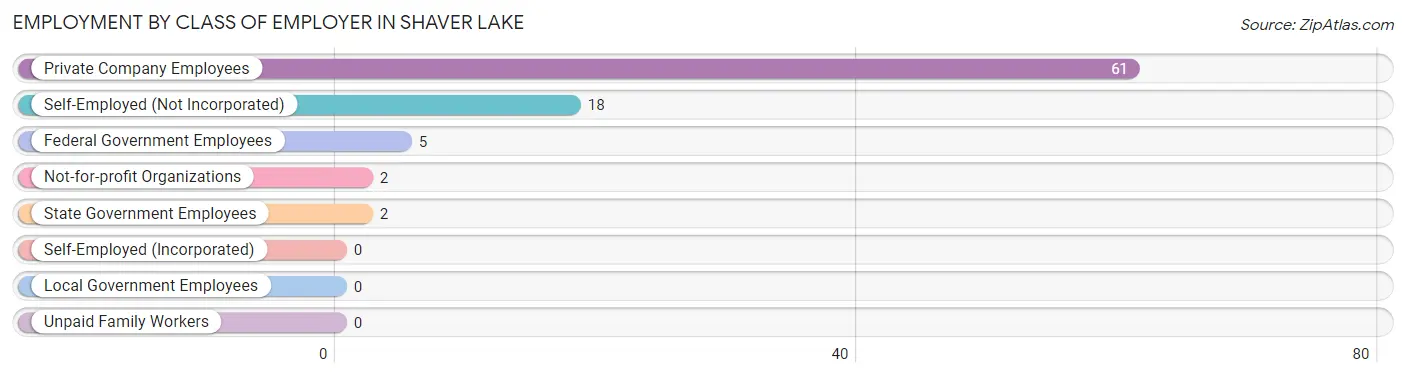
| Employer Class | # Employees | % Employees |
| Private Company Employees | 61 | 69.3% |
| Self-Employed (Incorporated) | 0 | 0.0% |
| Self-Employed (Not Incorporated) | 18 | 20.4% |
| Not-for-profit Organizations | 2 | 2.3% |
| Local Government Employees | 0 | 0.0% |
| State Government Employees | 2 | 2.3% |
| Federal Government Employees | 5 | 5.7% |
| Unpaid Family Workers | 0 | 0.0% |
| Total | 88 | 100.0% |
Employment Status by Age in Shaver Lake
According to the labor force statistics for Shaver Lake, out of the total population over 16 years of age (298), 31.5% or 94 individuals are in the labor force, with 6.4% or 6 of them unemployed. The age group with the highest labor force participation rate is 30 to 34 years, with 100.0% or 13 individuals in the labor force. Within the labor force, the 30 to 34 years age range has the highest percentage of unemployed individuals, with 15.4% or 2 of them being unemployed.
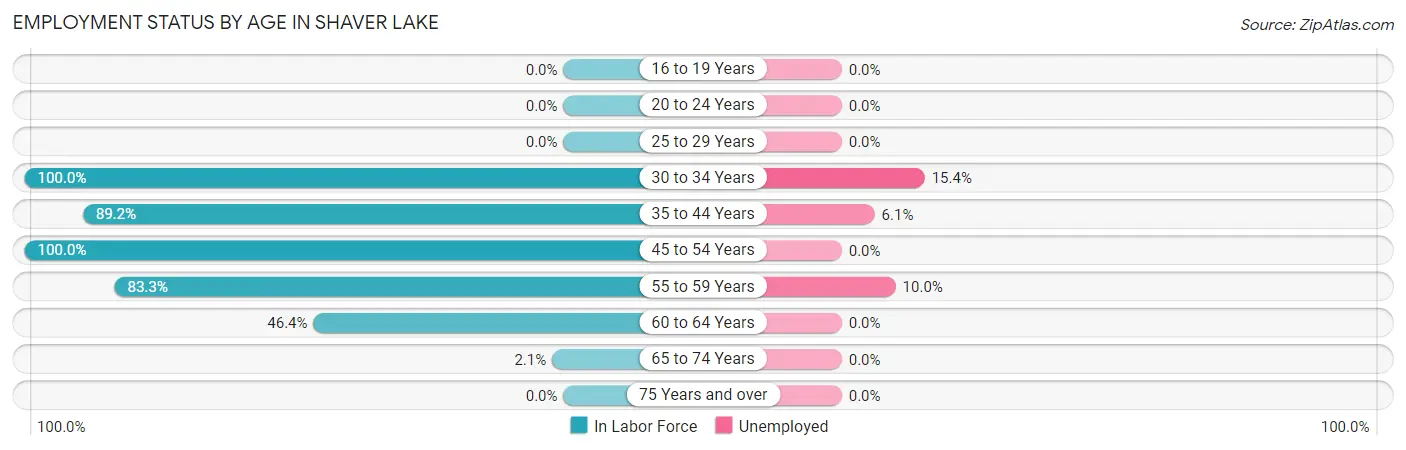
| Age Bracket | In Labor Force | Unemployed |
| 16 to 19 Years | 0 (0.0%) | 0 (0.0%) |
| 20 to 24 Years | 0 (0.0%) | 0 (0.0%) |
| 25 to 29 Years | 0 (0.0%) | 0 (0.0%) |
| 30 to 34 Years | 13 (100.0%) | 2 (15.4%) |
| 35 to 44 Years | 33 (89.2%) | 2 (6.1%) |
| 45 to 54 Years | 13 (100.0%) | 0 (0.0%) |
| 55 to 59 Years | 20 (83.3%) | 2 (10.0%) |
| 60 to 64 Years | 13 (46.4%) | 0 (0.0%) |
| 65 to 74 Years | 2 (2.1%) | 0 (0.0%) |
| 75 Years and over | 0 (0.0%) | 0 (0.0%) |
| Total | 94 (31.5%) | 6 (6.4%) |
Employment Status by Educational Attainment in Shaver Lake
According to labor force statistics for Shaver Lake, 78.0% of individuals (92) out of the total population between 25 and 64 years of age (118) are in the labor force, with 6.5% or 6 of them being unemployed. The group with the highest labor force participation rate are those with the educational attainment of less than high school, with 100.0% or 4 individuals in the labor force. Within the labor force, individuals with high school diploma education have the highest percentage of unemployment, with 20.0% or 2 of them being unemployed.
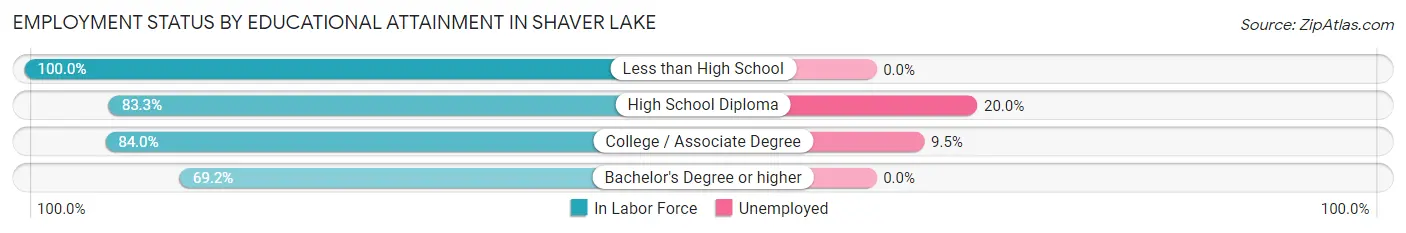
| Educational Attainment | In Labor Force | Unemployed |
| Less than High School | 4 (100.0%) | 0 (0.0%) |
| High School Diploma | 10 (83.3%) | 2 (20.0%) |
| College / Associate Degree | 42 (84.0%) | 5 (9.5%) |
| Bachelor's Degree or higher | 36 (69.2%) | 0 (0.0%) |
| Total | 92 (78.0%) | 8 (6.5%) |
Employment Occupations by Sex in Shaver Lake
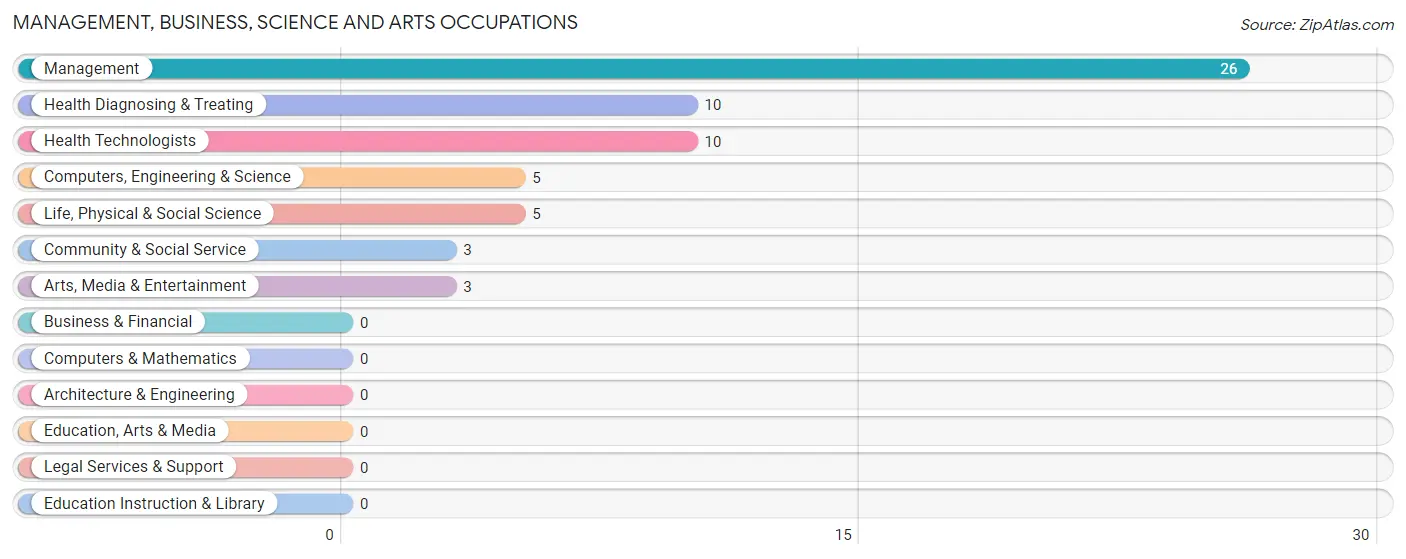
Management, Business, Science and Arts Occupations
The most common Management, Business, Science and Arts occupations in Shaver Lake are Management (26 | 29.5%), Health Diagnosing & Treating (10 | 11.4%), Health Technologists (10 | 11.4%), Computers, Engineering & Science (5 | 5.7%), and Life, Physical & Social Science (5 | 5.7%).
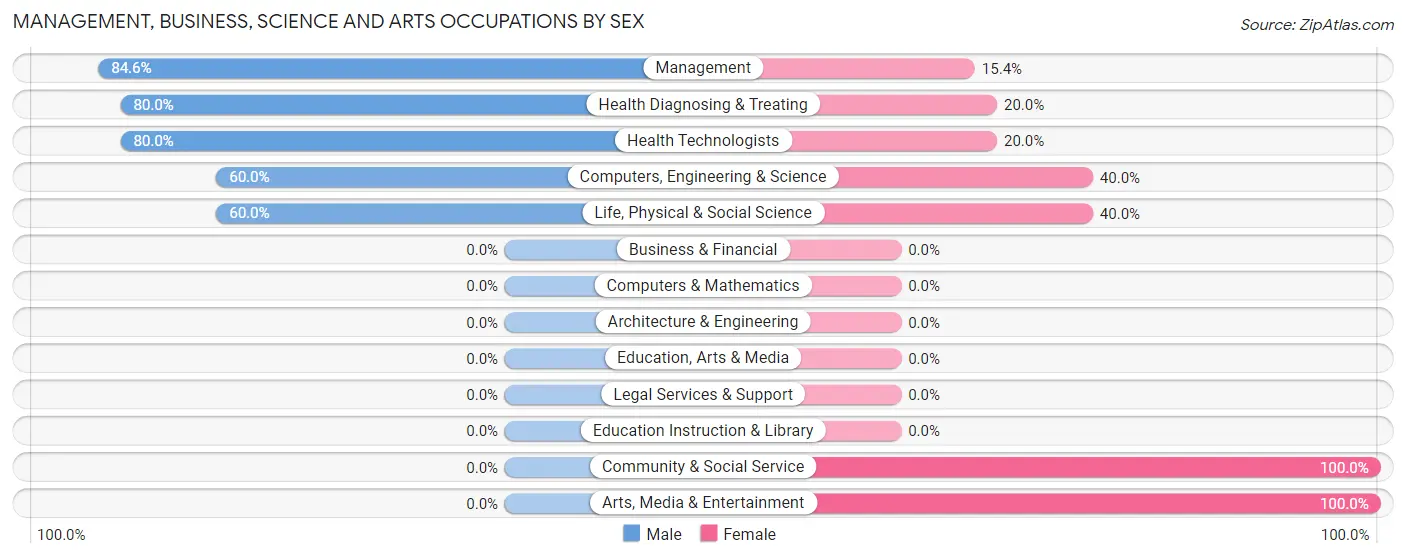
Management, Business, Science and Arts Occupations by Sex
Within the Management, Business, Science and Arts occupations in Shaver Lake, the most male-oriented occupations are Management (84.6%), Health Diagnosing & Treating (80.0%), and Health Technologists (80.0%), while the most female-oriented occupations are Community & Social Service (100.0%), Arts, Media & Entertainment (100.0%), and Computers, Engineering & Science (40.0%).
| Occupation | Male | Female |
| Management | 22 (84.6%) | 4 (15.4%) |
| Business & Financial | 0 (0.0%) | 0 (0.0%) |
| Computers, Engineering & Science | 3 (60.0%) | 2 (40.0%) |
| Computers & Mathematics | 0 (0.0%) | 0 (0.0%) |
| Architecture & Engineering | 0 (0.0%) | 0 (0.0%) |
| Life, Physical & Social Science | 3 (60.0%) | 2 (40.0%) |
| Community & Social Service | 0 (0.0%) | 3 (100.0%) |
| Education, Arts & Media | 0 (0.0%) | 0 (0.0%) |
| Legal Services & Support | 0 (0.0%) | 0 (0.0%) |
| Education Instruction & Library | 0 (0.0%) | 0 (0.0%) |
| Arts, Media & Entertainment | 0 (0.0%) | 3 (100.0%) |
| Health Diagnosing & Treating | 8 (80.0%) | 2 (20.0%) |
| Health Technologists | 8 (80.0%) | 2 (20.0%) |
| Total (Category) | 33 (75.0%) | 11 (25.0%) |
| Total (Overall) | 52 (59.1%) | 36 (40.9%) |
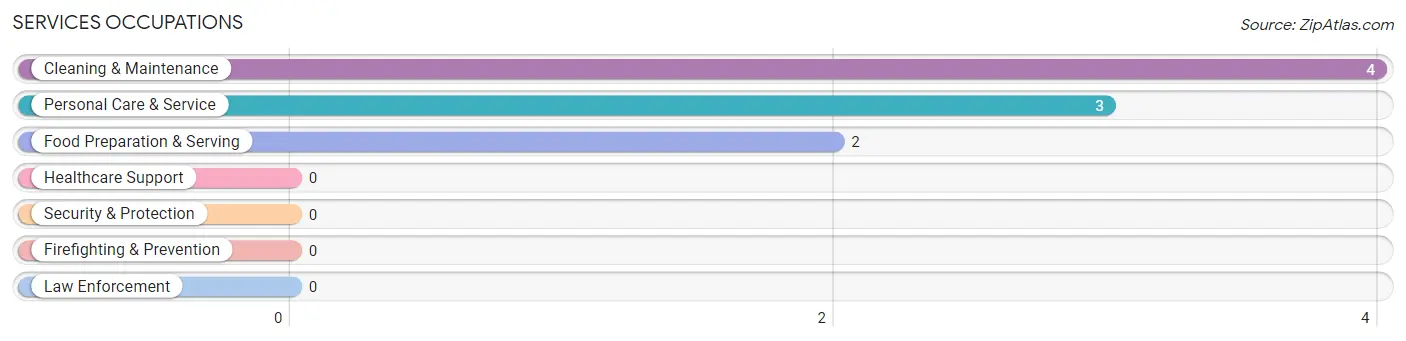
Services Occupations
The most common Services occupations in Shaver Lake are Cleaning & Maintenance (4 | 4.5%), Personal Care & Service (3 | 3.4%), and Food Preparation & Serving (2 | 2.3%).
Services Occupations by Sex
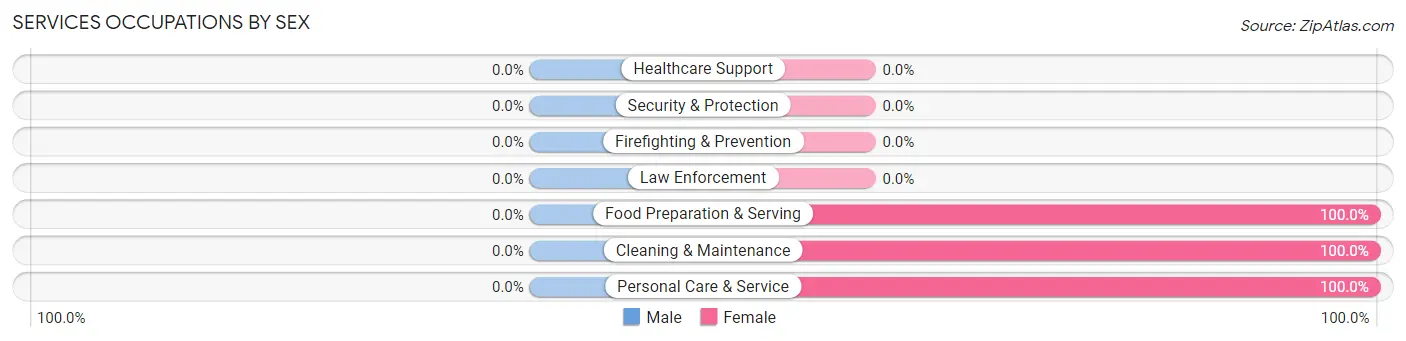
| Occupation | Male | Female |
| Healthcare Support | 0 (0.0%) | 0 (0.0%) |
| Security & Protection | 0 (0.0%) | 0 (0.0%) |
| Firefighting & Prevention | 0 (0.0%) | 0 (0.0%) |
| Law Enforcement | 0 (0.0%) | 0 (0.0%) |
| Food Preparation & Serving | 0 (0.0%) | 2 (100.0%) |
| Cleaning & Maintenance | 0 (0.0%) | 4 (100.0%) |
| Personal Care & Service | 0 (0.0%) | 3 (100.0%) |
| Total (Category) | 0 (0.0%) | 9 (100.0%) |
| Total (Overall) | 52 (59.1%) | 36 (40.9%) |
Sales and Office Occupations
The most common Sales and Office occupations in Shaver Lake are , and Office & Administration (14 | 15.9%).
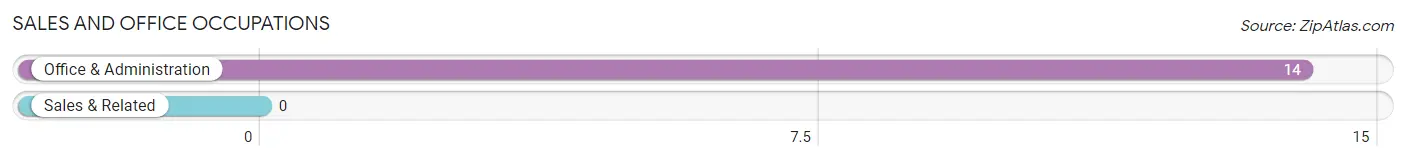
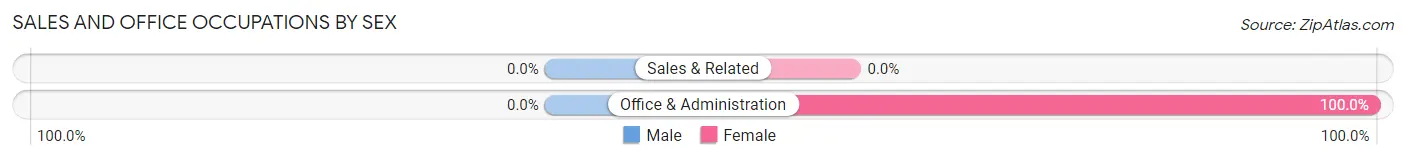
Sales and Office Occupations by Sex
| Occupation | Male | Female |
| Sales & Related | 0 (0.0%) | 0 (0.0%) |
| Office & Administration | 0 (0.0%) | 14 (100.0%) |
| Total (Category) | 0 (0.0%) | 14 (100.0%) |
| Total (Overall) | 52 (59.1%) | 36 (40.9%) |
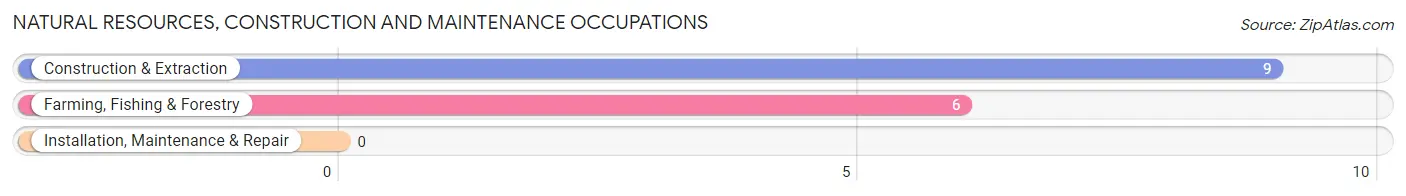
Natural Resources, Construction and Maintenance Occupations
The most common Natural Resources, Construction and Maintenance occupations in Shaver Lake are Construction & Extraction (9 | 10.2%), and Farming, Fishing & Forestry (6 | 6.8%).
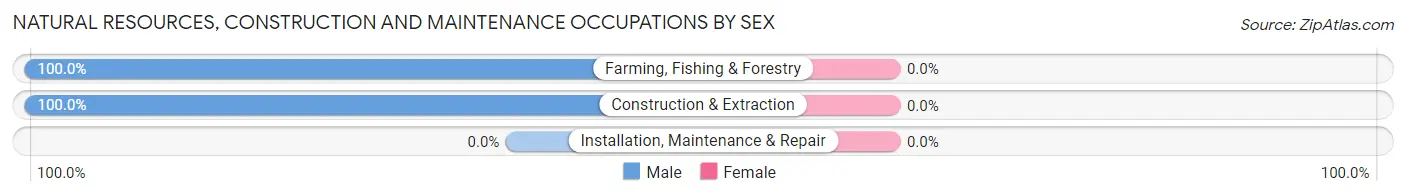
Natural Resources, Construction and Maintenance Occupations by Sex
| Occupation | Male | Female |
| Farming, Fishing & Forestry | 6 (100.0%) | 0 (0.0%) |
| Construction & Extraction | 9 (100.0%) | 0 (0.0%) |
| Installation, Maintenance & Repair | 0 (0.0%) | 0 (0.0%) |
| Total (Category) | 15 (100.0%) | 0 (0.0%) |
| Total (Overall) | 52 (59.1%) | 36 (40.9%) |
Production, Transportation and Moving Occupations
The most common Production, Transportation and Moving occupations in Shaver Lake are Production (5 | 5.7%), and Transportation (1 | 1.1%).
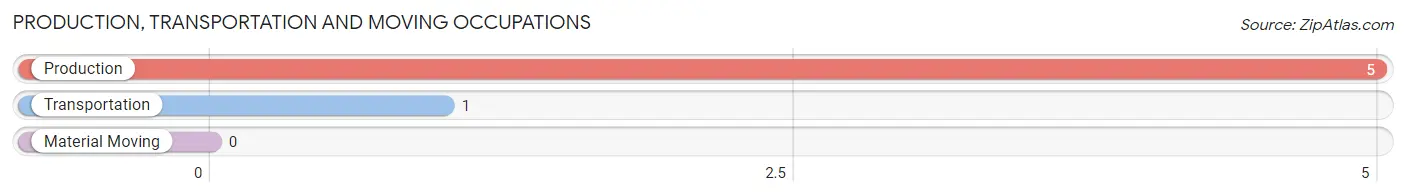
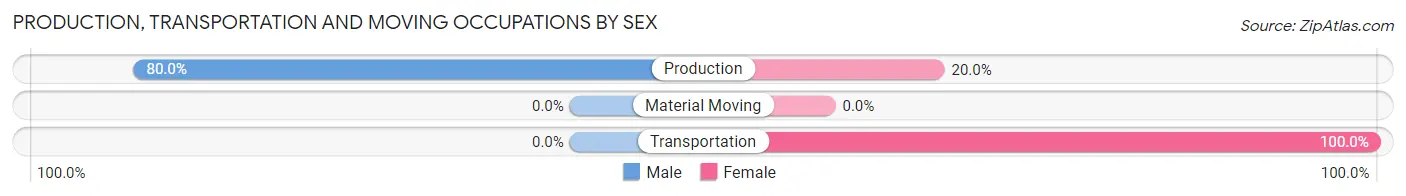
Production, Transportation and Moving Occupations by Sex
| Occupation | Male | Female |
| Production | 4 (80.0%) | 1 (20.0%) |
| Transportation | 0 (0.0%) | 1 (100.0%) |
| Material Moving | 0 (0.0%) | 0 (0.0%) |
| Total (Category) | 4 (66.7%) | 2 (33.3%) |
| Total (Overall) | 52 (59.1%) | 36 (40.9%) |
Employment Industries by Sex in Shaver Lake
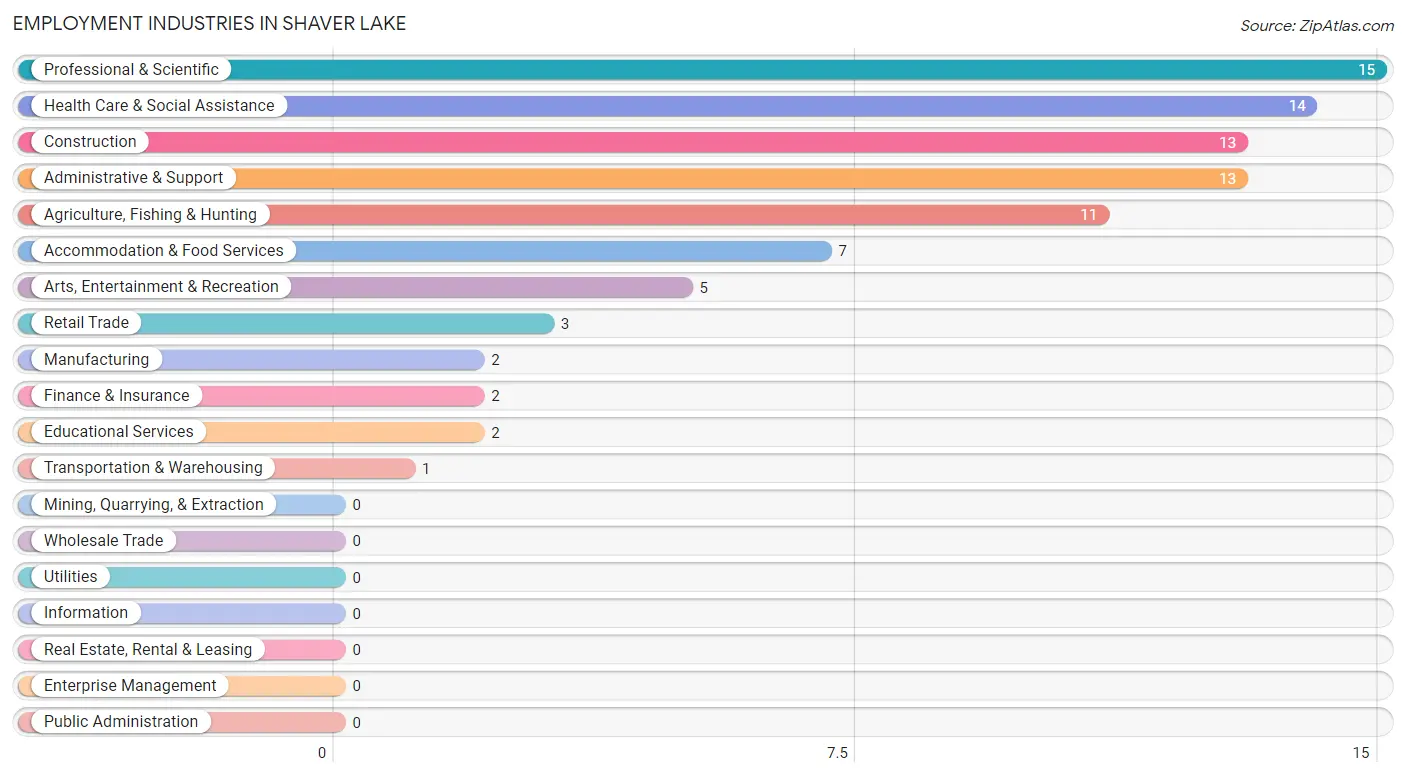
Employment Industries in Shaver Lake
The major employment industries in Shaver Lake include Professional & Scientific (15 | 17.1%), Health Care & Social Assistance (14 | 15.9%), Construction (13 | 14.8%), Administrative & Support (13 | 14.8%), and Agriculture, Fishing & Hunting (11 | 12.5%).
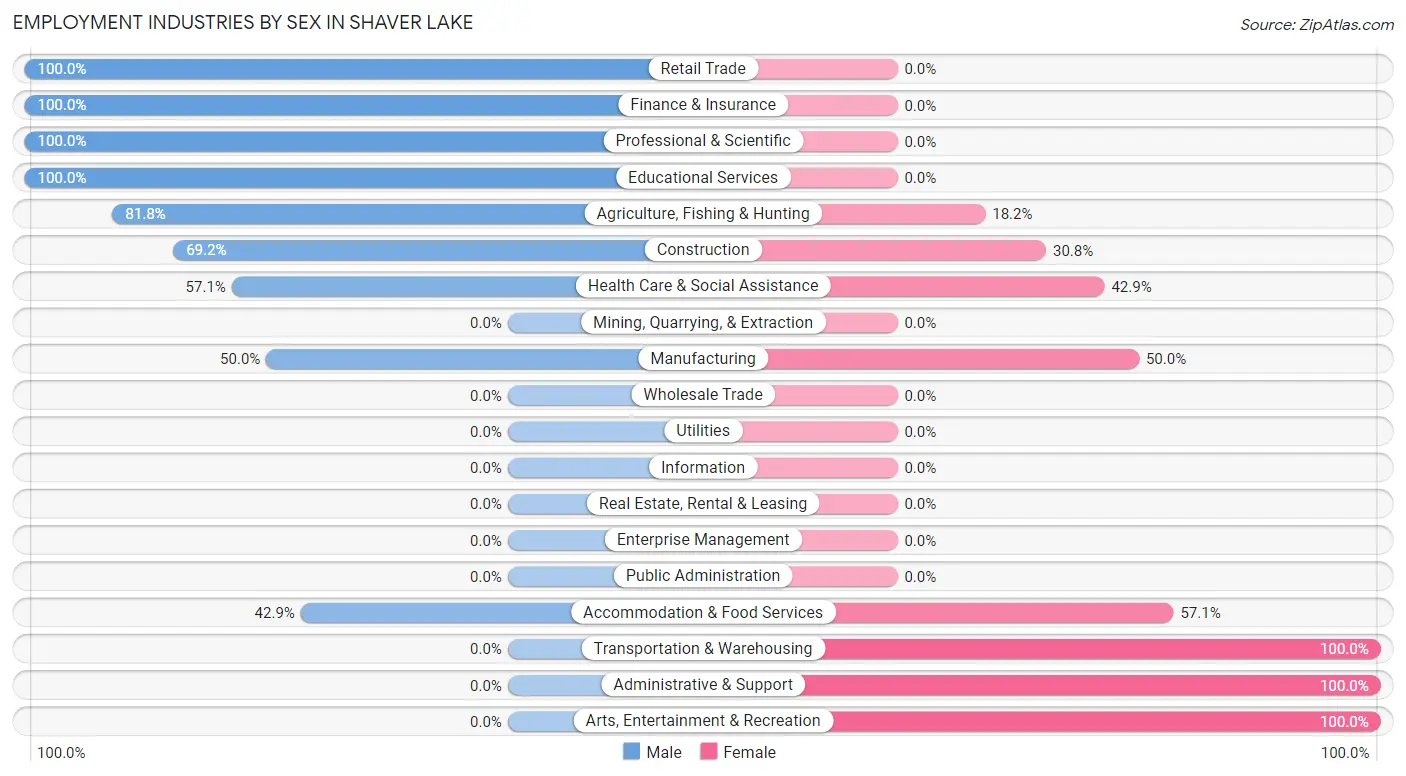
Employment Industries by Sex in Shaver Lake
The Shaver Lake industries that see more men than women are Retail Trade (100.0%), Finance & Insurance (100.0%), and Professional & Scientific (100.0%), whereas the industries that tend to have a higher number of women are Transportation & Warehousing (100.0%), Administrative & Support (100.0%), and Arts, Entertainment & Recreation (100.0%).
| Industry | Male | Female |
| Agriculture, Fishing & Hunting | 9 (81.8%) | 2 (18.2%) |
| Mining, Quarrying, & Extraction | 0 (0.0%) | 0 (0.0%) |
| Construction | 9 (69.2%) | 4 (30.8%) |
| Manufacturing | 1 (50.0%) | 1 (50.0%) |
| Wholesale Trade | 0 (0.0%) | 0 (0.0%) |
| Retail Trade | 3 (100.0%) | 0 (0.0%) |
| Transportation & Warehousing | 0 (0.0%) | 1 (100.0%) |
| Utilities | 0 (0.0%) | 0 (0.0%) |
| Information | 0 (0.0%) | 0 (0.0%) |
| Finance & Insurance | 2 (100.0%) | 0 (0.0%) |
| Real Estate, Rental & Leasing | 0 (0.0%) | 0 (0.0%) |
| Professional & Scientific | 15 (100.0%) | 0 (0.0%) |
| Enterprise Management | 0 (0.0%) | 0 (0.0%) |
| Administrative & Support | 0 (0.0%) | 13 (100.0%) |
| Educational Services | 2 (100.0%) | 0 (0.0%) |
| Health Care & Social Assistance | 8 (57.1%) | 6 (42.9%) |
| Arts, Entertainment & Recreation | 0 (0.0%) | 5 (100.0%) |
| Accommodation & Food Services | 3 (42.9%) | 4 (57.1%) |
| Public Administration | 0 (0.0%) | 0 (0.0%) |
| Total | 52 (59.1%) | 36 (40.9%) |
Education in Shaver Lake
School Enrollment in Shaver Lake
The most common levels of schooling among the 17 students in Shaver Lake are high school (9 | 52.9%), middle school (3 | 17.6%), and graduate / professional (3 | 17.6%).
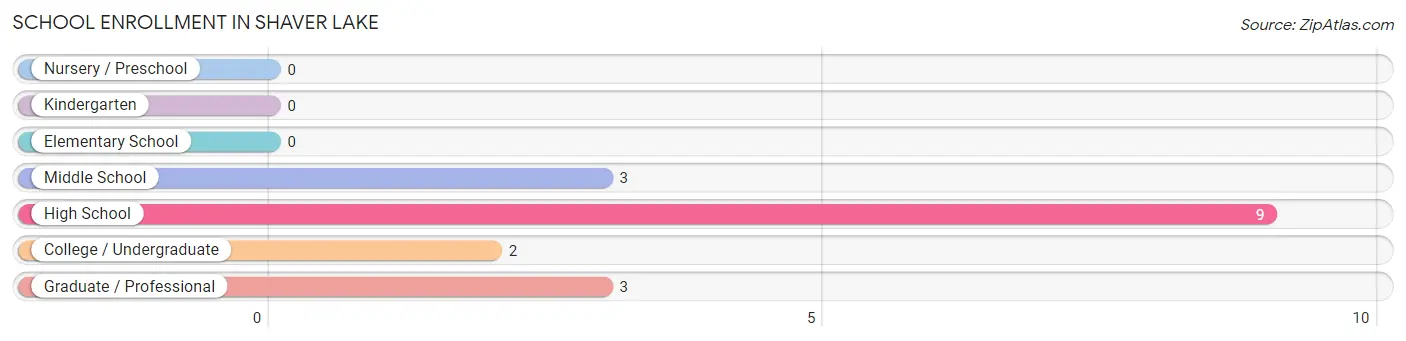
| School Level | # Students | % Students |
| Nursery / Preschool | 0 | 0.0% |
| Kindergarten | 0 | 0.0% |
| Elementary School | 0 | 0.0% |
| Middle School | 3 | 17.6% |
| High School | 9 | 52.9% |
| College / Undergraduate | 2 | 11.8% |
| Graduate / Professional | 3 | 17.6% |
| Total | 17 | 100.0% |
School Enrollment by Age by Funding Source in Shaver Lake
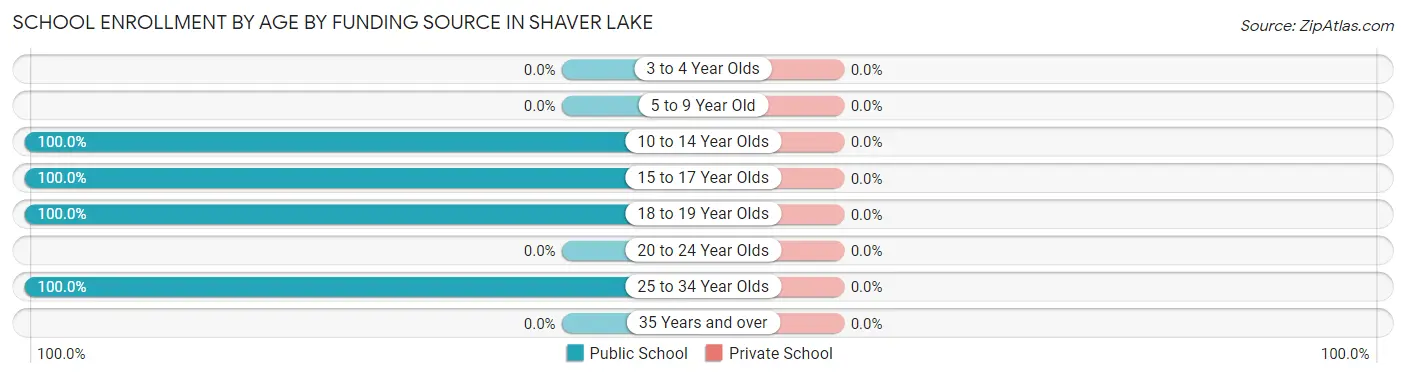
| Age Bracket | Public School | Private School |
| 3 to 4 Year Olds | 0 (0.0%) | 0 (0.0%) |
| 5 to 9 Year Old | 0 (0.0%) | 0 (0.0%) |
| 10 to 14 Year Olds | 3 (100.0%) | 0 (0.0%) |
| 15 to 17 Year Olds | 6 (100.0%) | 0 (0.0%) |
| 18 to 19 Year Olds | 3 (100.0%) | 0 (0.0%) |
| 20 to 24 Year Olds | 0 (0.0%) | 0 (0.0%) |
| 25 to 34 Year Olds | 5 (100.0%) | 0 (0.0%) |
| 35 Years and over | 0 (0.0%) | 0 (0.0%) |
| Total | 17 (100.0%) | 0 (0.0%) |
Educational Attainment by Field of Study in Shaver Lake
Education (52 | 29.4%), bio, nature & agricultural (29 | 16.4%), business (22 | 12.4%), science & technology (17 | 9.6%), and computers & mathematics (15 | 8.5%) are the most common fields of study among 177 individuals in Shaver Lake who have obtained a bachelor's degree or higher.
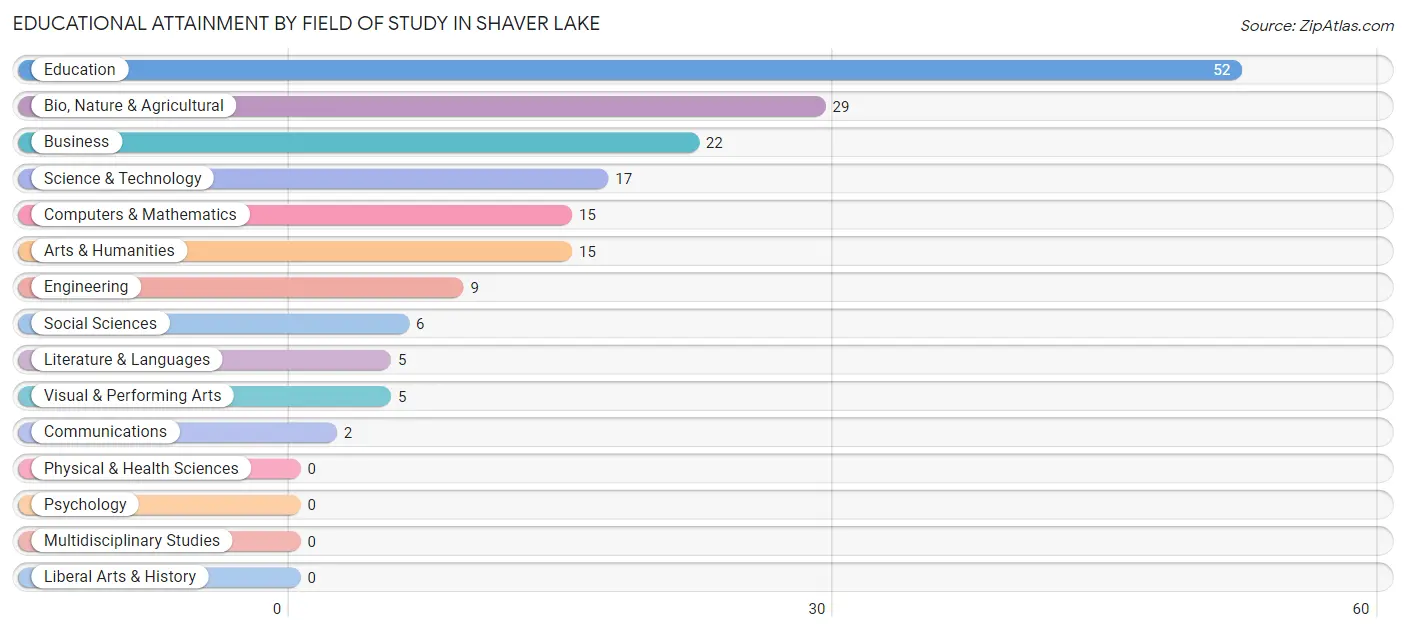
| Field of Study | # Graduates | % Graduates |
| Computers & Mathematics | 15 | 8.5% |
| Bio, Nature & Agricultural | 29 | 16.4% |
| Physical & Health Sciences | 0 | 0.0% |
| Psychology | 0 | 0.0% |
| Social Sciences | 6 | 3.4% |
| Engineering | 9 | 5.1% |
| Multidisciplinary Studies | 0 | 0.0% |
| Science & Technology | 17 | 9.6% |
| Business | 22 | 12.4% |
| Education | 52 | 29.4% |
| Literature & Languages | 5 | 2.8% |
| Liberal Arts & History | 0 | 0.0% |
| Visual & Performing Arts | 5 | 2.8% |
| Communications | 2 | 1.1% |
| Arts & Humanities | 15 | 8.5% |
| Total | 177 | 100.0% |
Transportation & Commute in Shaver Lake
Vehicle Availability by Sex in Shaver Lake
The most prevalent vehicle ownership categories in Shaver Lake are males with 3 vehicles (23, accounting for 44.2%) and females with 3 vehicles (11, making up 63.9%).
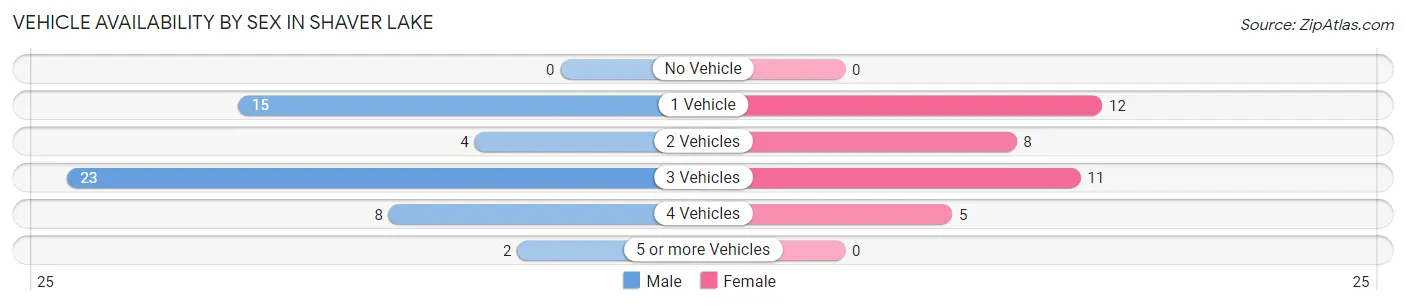
| Vehicles Available | Male | Female |
| No Vehicle | 0 (0.0%) | 0 (0.0%) |
| 1 Vehicle | 15 (28.8%) | 12 (33.3%) |
| 2 Vehicles | 4 (7.7%) | 8 (22.2%) |
| 3 Vehicles | 23 (44.2%) | 11 (30.6%) |
| 4 Vehicles | 8 (15.4%) | 5 (13.9%) |
| 5 or more Vehicles | 2 (3.8%) | 0 (0.0%) |
| Total | 52 (100.0%) | 36 (100.0%) |
Commute Time in Shaver Lake
The most frequently occuring commute durations in Shaver Lake are 90 or more minutes (21 commuters, 28.8%), 60 to 89 minutes (18 commuters, 24.7%), and 15 to 19 minutes (11 commuters, 15.1%).
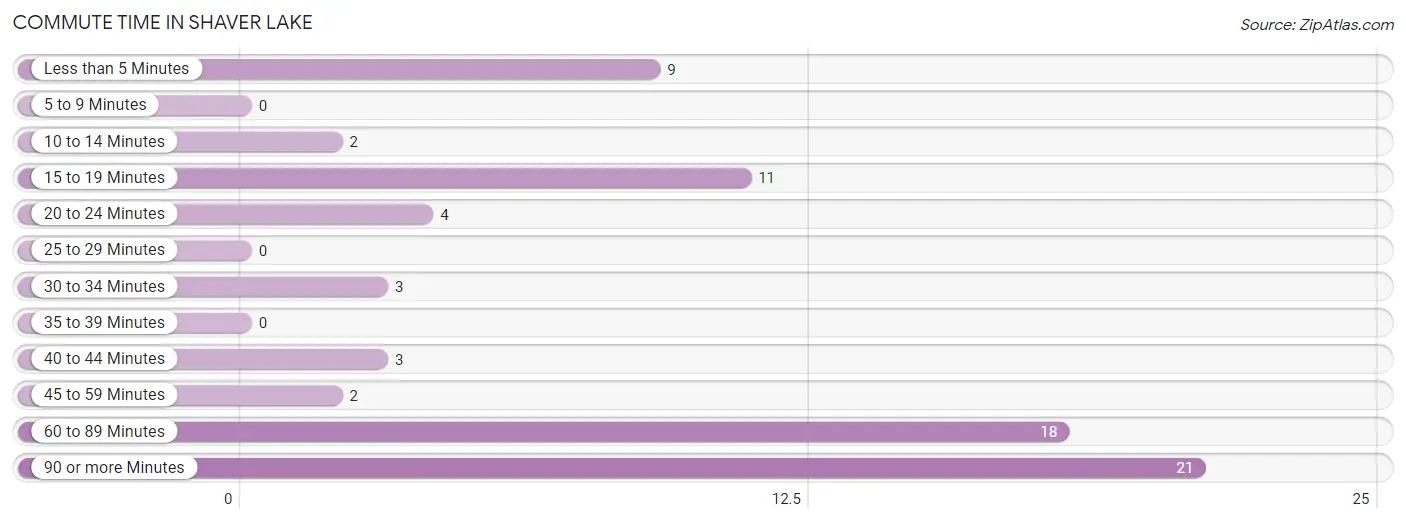
| Commute Time | # Commuters | % Commuters |
| Less than 5 Minutes | 9 | 12.3% |
| 5 to 9 Minutes | 0 | 0.0% |
| 10 to 14 Minutes | 2 | 2.7% |
| 15 to 19 Minutes | 11 | 15.1% |
| 20 to 24 Minutes | 4 | 5.5% |
| 25 to 29 Minutes | 0 | 0.0% |
| 30 to 34 Minutes | 3 | 4.1% |
| 35 to 39 Minutes | 0 | 0.0% |
| 40 to 44 Minutes | 3 | 4.1% |
| 45 to 59 Minutes | 2 | 2.7% |
| 60 to 89 Minutes | 18 | 24.7% |
| 90 or more Minutes | 21 | 28.8% |
Commute Time by Sex in Shaver Lake
The most common commute times in Shaver Lake are 90 or more minutes (20 commuters, 38.5%) for males and 15 to 19 minutes (9 commuters, 42.9%) for females.
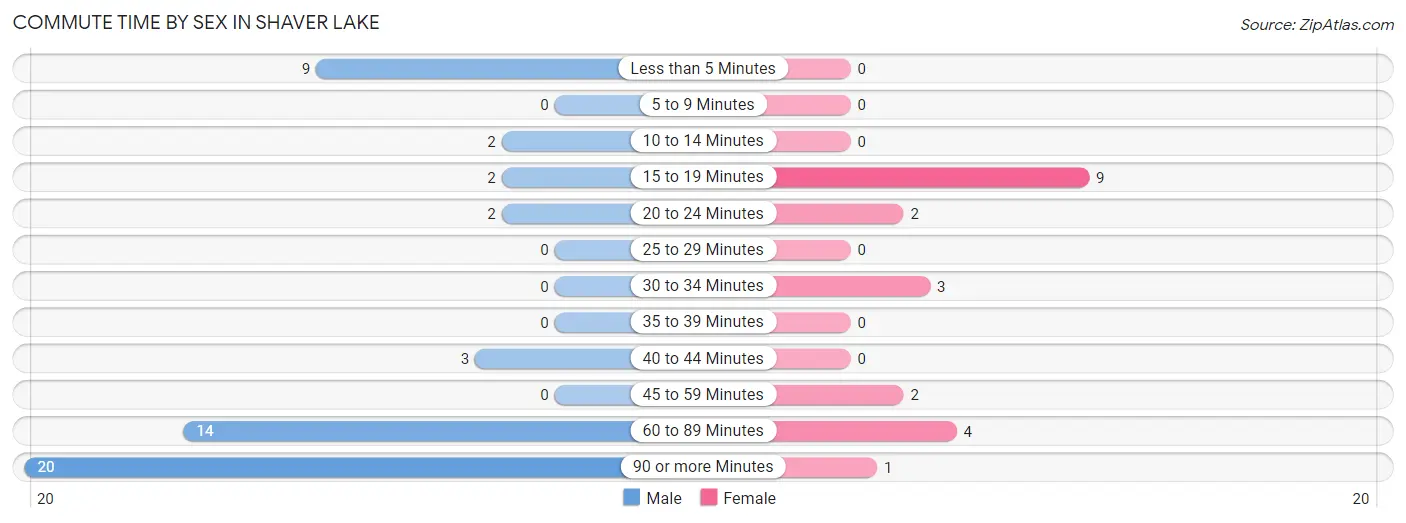
| Commute Time | Male | Female |
| Less than 5 Minutes | 9 (17.3%) | 0 (0.0%) |
| 5 to 9 Minutes | 0 (0.0%) | 0 (0.0%) |
| 10 to 14 Minutes | 2 (3.8%) | 0 (0.0%) |
| 15 to 19 Minutes | 2 (3.8%) | 9 (42.9%) |
| 20 to 24 Minutes | 2 (3.8%) | 2 (9.5%) |
| 25 to 29 Minutes | 0 (0.0%) | 0 (0.0%) |
| 30 to 34 Minutes | 0 (0.0%) | 3 (14.3%) |
| 35 to 39 Minutes | 0 (0.0%) | 0 (0.0%) |
| 40 to 44 Minutes | 3 (5.8%) | 0 (0.0%) |
| 45 to 59 Minutes | 0 (0.0%) | 2 (9.5%) |
| 60 to 89 Minutes | 14 (26.9%) | 4 (19.1%) |
| 90 or more Minutes | 20 (38.5%) | 1 (4.8%) |
Time of Departure to Work by Sex in Shaver Lake
The most frequent times of departure to work in Shaver Lake are 4:00 PM to 11:59 PM (23, 44.2%) for males and 6:00 AM to 6:29 AM (9, 42.9%) for females.
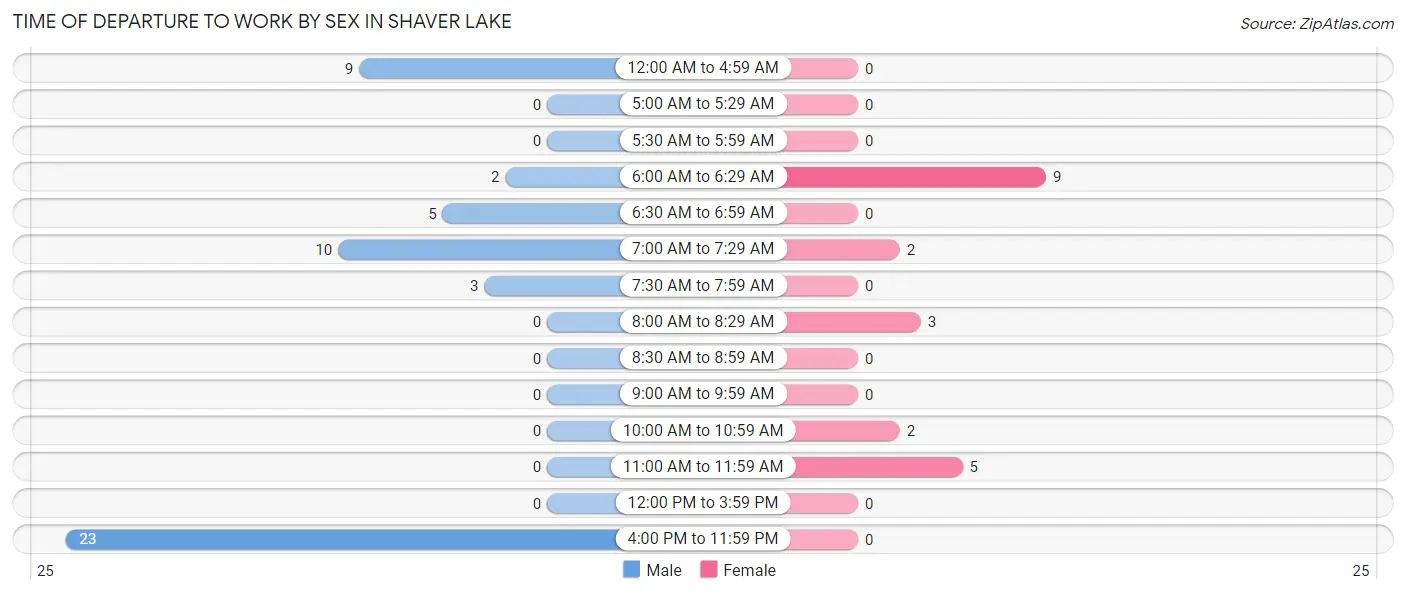
| Time of Departure | Male | Female |
| 12:00 AM to 4:59 AM | 9 (17.3%) | 0 (0.0%) |
| 5:00 AM to 5:29 AM | 0 (0.0%) | 0 (0.0%) |
| 5:30 AM to 5:59 AM | 0 (0.0%) | 0 (0.0%) |
| 6:00 AM to 6:29 AM | 2 (3.8%) | 9 (42.9%) |
| 6:30 AM to 6:59 AM | 5 (9.6%) | 0 (0.0%) |
| 7:00 AM to 7:29 AM | 10 (19.2%) | 2 (9.5%) |
| 7:30 AM to 7:59 AM | 3 (5.8%) | 0 (0.0%) |
| 8:00 AM to 8:29 AM | 0 (0.0%) | 3 (14.3%) |
| 8:30 AM to 8:59 AM | 0 (0.0%) | 0 (0.0%) |
| 9:00 AM to 9:59 AM | 0 (0.0%) | 0 (0.0%) |
| 10:00 AM to 10:59 AM | 0 (0.0%) | 2 (9.5%) |
| 11:00 AM to 11:59 AM | 0 (0.0%) | 5 (23.8%) |
| 12:00 PM to 3:59 PM | 0 (0.0%) | 0 (0.0%) |
| 4:00 PM to 11:59 PM | 23 (44.2%) | 0 (0.0%) |
| Total | 52 (100.0%) | 21 (100.0%) |
Housing Occupancy in Shaver Lake
Occupancy by Ownership in Shaver Lake
Of the total 168 dwellings in Shaver Lake, owner-occupied units account for 158 (94.1%), while renter-occupied units make up 10 (5.9%).
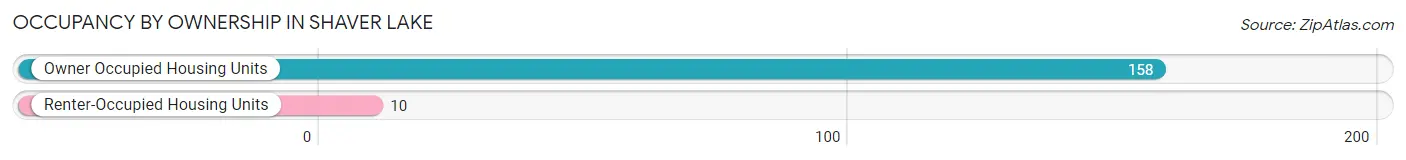
| Occupancy | # Housing Units | % Housing Units |
| Owner Occupied Housing Units | 158 | 94.1% |
| Renter-Occupied Housing Units | 10 | 5.9% |
| Total Occupied Housing Units | 168 | 100.0% |
Occupancy by Household Size in Shaver Lake
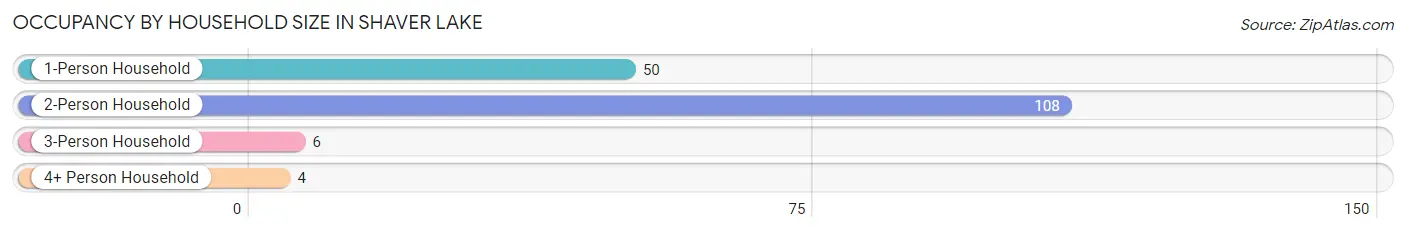
| Household Size | # Housing Units | % Housing Units |
| 1-Person Household | 50 | 29.8% |
| 2-Person Household | 108 | 64.3% |
| 3-Person Household | 6 | 3.6% |
| 4+ Person Household | 4 | 2.4% |
| Total Housing Units | 168 | 100.0% |
Occupancy by Ownership by Household Size in Shaver Lake
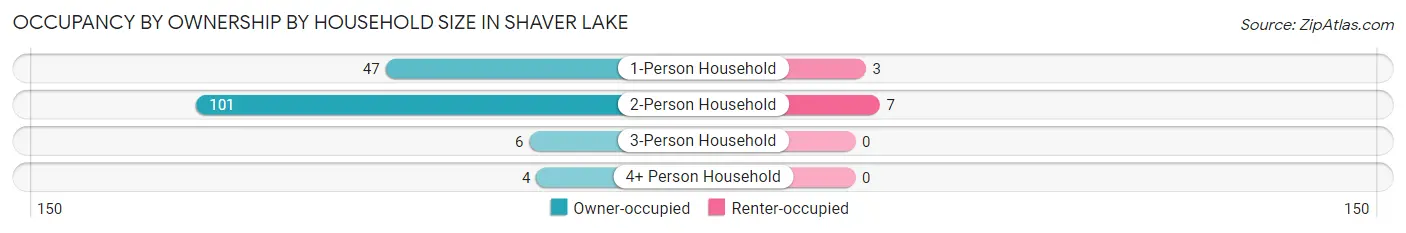
| Household Size | Owner-occupied | Renter-occupied |
| 1-Person Household | 47 (94.0%) | 3 (6.0%) |
| 2-Person Household | 101 (93.5%) | 7 (6.5%) |
| 3-Person Household | 6 (100.0%) | 0 (0.0%) |
| 4+ Person Household | 4 (100.0%) | 0 (0.0%) |
| Total Housing Units | 158 (94.1%) | 10 (5.9%) |
Occupancy by Educational Attainment in Shaver Lake
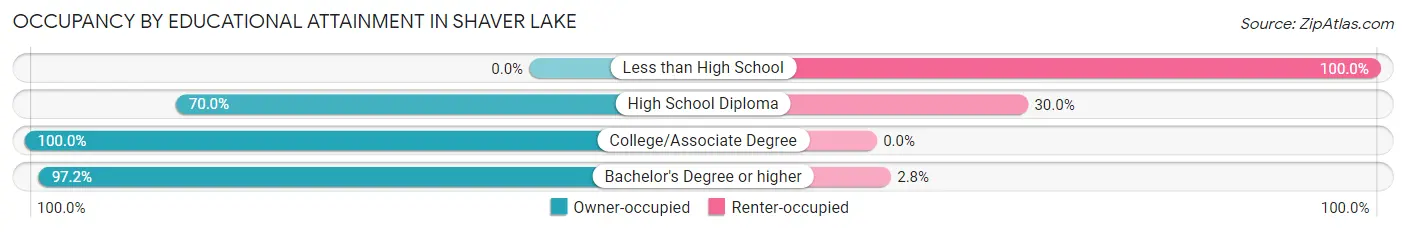
| Household Size | Owner-occupied | Renter-occupied |
| Less than High School | 0 (0.0%) | 4 (100.0%) |
| High School Diploma | 7 (70.0%) | 3 (30.0%) |
| College/Associate Degree | 47 (100.0%) | 0 (0.0%) |
| Bachelor's Degree or higher | 104 (97.2%) | 3 (2.8%) |
Occupancy by Age of Householder in Shaver Lake
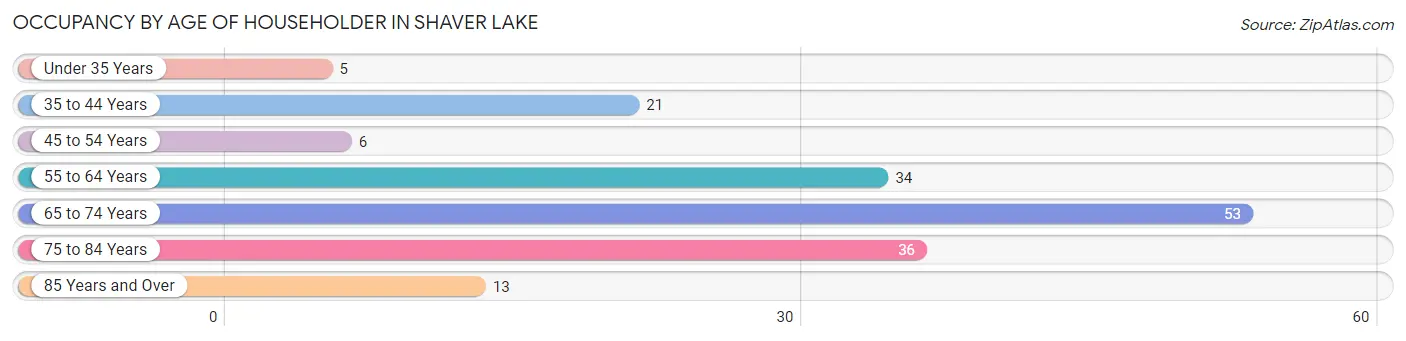
| Age Bracket | # Households | % Households |
| Under 35 Years | 5 | 3.0% |
| 35 to 44 Years | 21 | 12.5% |
| 45 to 54 Years | 6 | 3.6% |
| 55 to 64 Years | 34 | 20.2% |
| 65 to 74 Years | 53 | 31.6% |
| 75 to 84 Years | 36 | 21.4% |
| 85 Years and Over | 13 | 7.7% |
| Total | 168 | 100.0% |
Housing Finances in Shaver Lake
Median Income by Occupancy in Shaver Lake
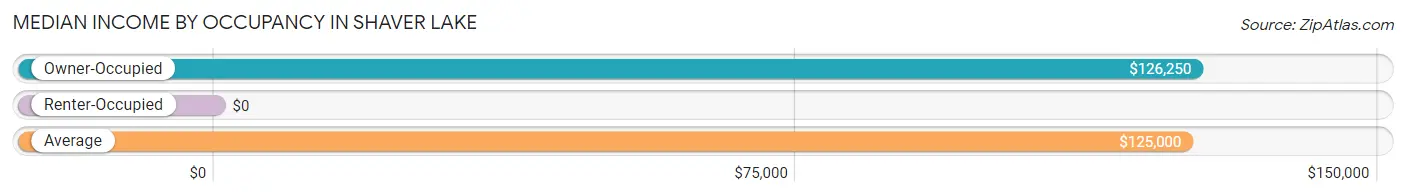
| Occupancy Type | # Households | Median Income |
| Owner-Occupied | 158 (94.1%) | $126,250 |
| Renter-Occupied | 10 (5.9%) | $0 |
| Average | 168 (100.0%) | $125,000 |
Occupancy by Householder Income Bracket in Shaver Lake
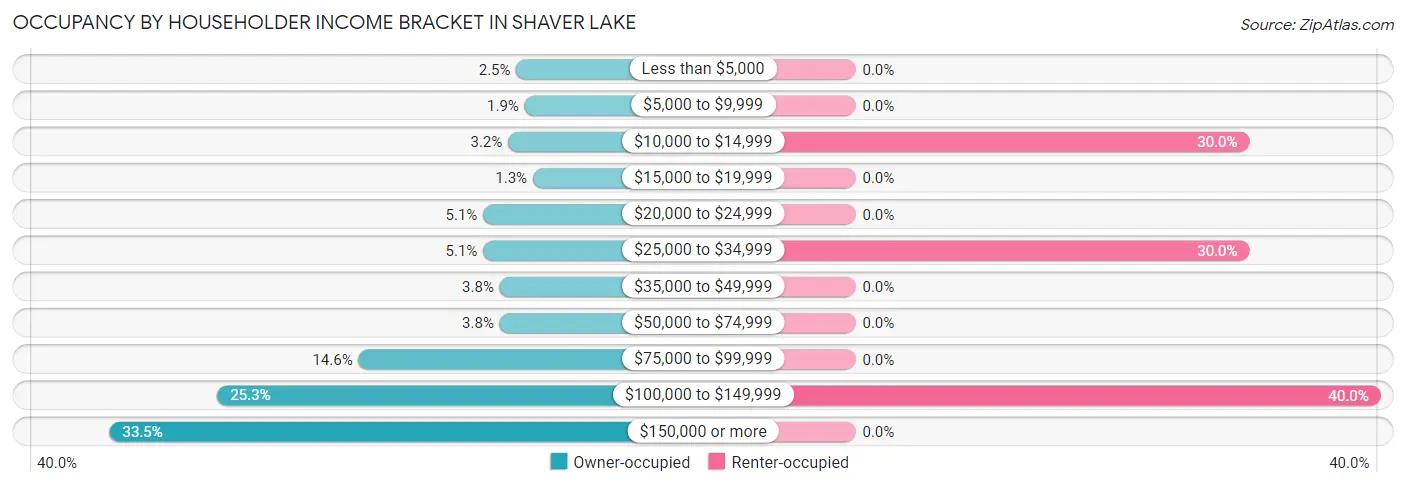
| Income Bracket | Owner-occupied | Renter-occupied |
| Less than $5,000 | 4 (2.5%) | 0 (0.0%) |
| $5,000 to $9,999 | 3 (1.9%) | 0 (0.0%) |
| $10,000 to $14,999 | 5 (3.2%) | 3 (30.0%) |
| $15,000 to $19,999 | 2 (1.3%) | 0 (0.0%) |
| $20,000 to $24,999 | 8 (5.1%) | 0 (0.0%) |
| $25,000 to $34,999 | 8 (5.1%) | 3 (30.0%) |
| $35,000 to $49,999 | 6 (3.8%) | 0 (0.0%) |
| $50,000 to $74,999 | 6 (3.8%) | 0 (0.0%) |
| $75,000 to $99,999 | 23 (14.6%) | 0 (0.0%) |
| $100,000 to $149,999 | 40 (25.3%) | 4 (40.0%) |
| $150,000 or more | 53 (33.5%) | 0 (0.0%) |
| Total | 158 (100.0%) | 10 (100.0%) |
Monthly Housing Cost Tiers in Shaver Lake
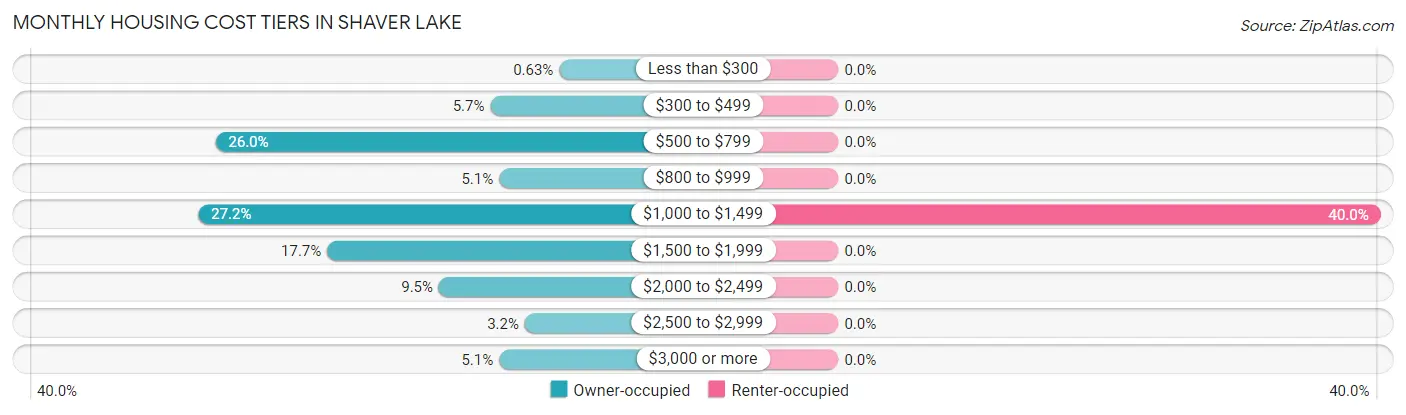
| Monthly Cost | Owner-occupied | Renter-occupied |
| Less than $300 | 1 (0.6%) | 0 (0.0%) |
| $300 to $499 | 9 (5.7%) | 0 (0.0%) |
| $500 to $799 | 41 (26.0%) | 0 (0.0%) |
| $800 to $999 | 8 (5.1%) | 0 (0.0%) |
| $1,000 to $1,499 | 43 (27.2%) | 4 (40.0%) |
| $1,500 to $1,999 | 28 (17.7%) | 0 (0.0%) |
| $2,000 to $2,499 | 15 (9.5%) | 0 (0.0%) |
| $2,500 to $2,999 | 5 (3.2%) | 0 (0.0%) |
| $3,000 or more | 8 (5.1%) | 0 (0.0%) |
| Total | 158 (100.0%) | 10 (100.0%) |
Physical Housing Characteristics in Shaver Lake
Housing Structures in Shaver Lake
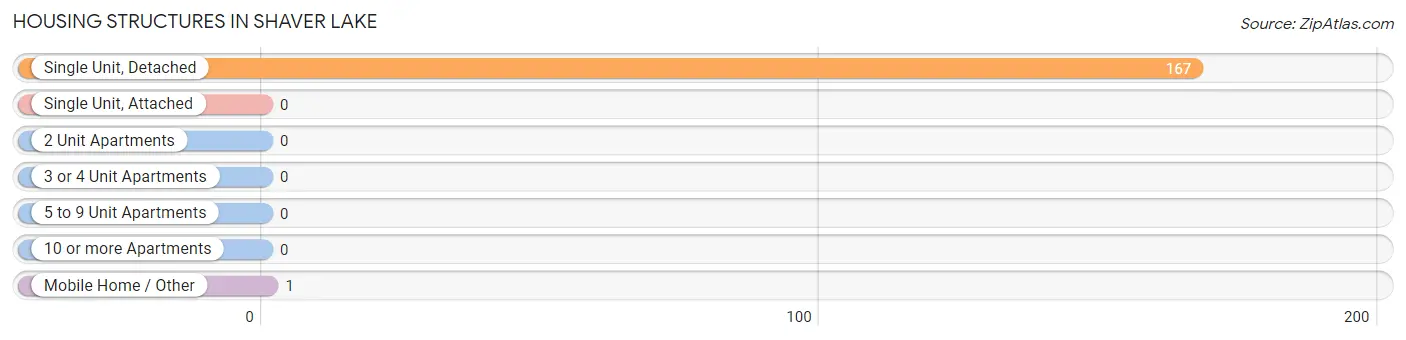
| Structure Type | # Housing Units | % Housing Units |
| Single Unit, Detached | 167 | 99.4% |
| Single Unit, Attached | 0 | 0.0% |
| 2 Unit Apartments | 0 | 0.0% |
| 3 or 4 Unit Apartments | 0 | 0.0% |
| 5 to 9 Unit Apartments | 0 | 0.0% |
| 10 or more Apartments | 0 | 0.0% |
| Mobile Home / Other | 1 | 0.6% |
| Total | 168 | 100.0% |
Housing Structures by Occupancy in Shaver Lake
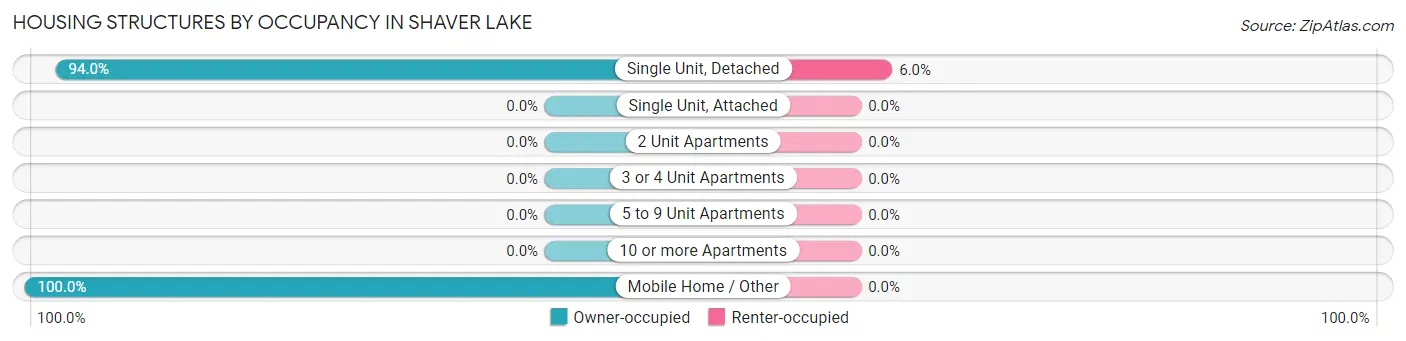
| Structure Type | Owner-occupied | Renter-occupied |
| Single Unit, Detached | 157 (94.0%) | 10 (6.0%) |
| Single Unit, Attached | 0 (0.0%) | 0 (0.0%) |
| 2 Unit Apartments | 0 (0.0%) | 0 (0.0%) |
| 3 or 4 Unit Apartments | 0 (0.0%) | 0 (0.0%) |
| 5 to 9 Unit Apartments | 0 (0.0%) | 0 (0.0%) |
| 10 or more Apartments | 0 (0.0%) | 0 (0.0%) |
| Mobile Home / Other | 1 (100.0%) | 0 (0.0%) |
| Total | 158 (94.1%) | 10 (5.9%) |
Housing Structures by Number of Rooms in Shaver Lake
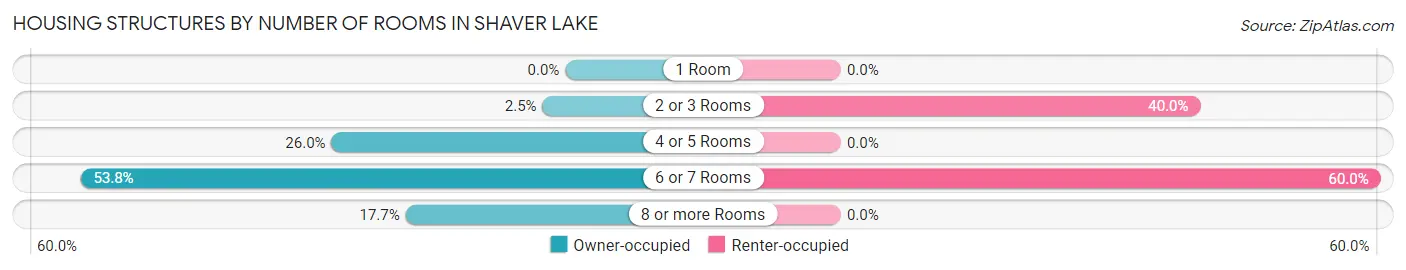
| Number of Rooms | Owner-occupied | Renter-occupied |
| 1 Room | 0 (0.0%) | 0 (0.0%) |
| 2 or 3 Rooms | 4 (2.5%) | 4 (40.0%) |
| 4 or 5 Rooms | 41 (26.0%) | 0 (0.0%) |
| 6 or 7 Rooms | 85 (53.8%) | 6 (60.0%) |
| 8 or more Rooms | 28 (17.7%) | 0 (0.0%) |
| Total | 158 (100.0%) | 10 (100.0%) |
Housing Structure by Heating Type in Shaver Lake
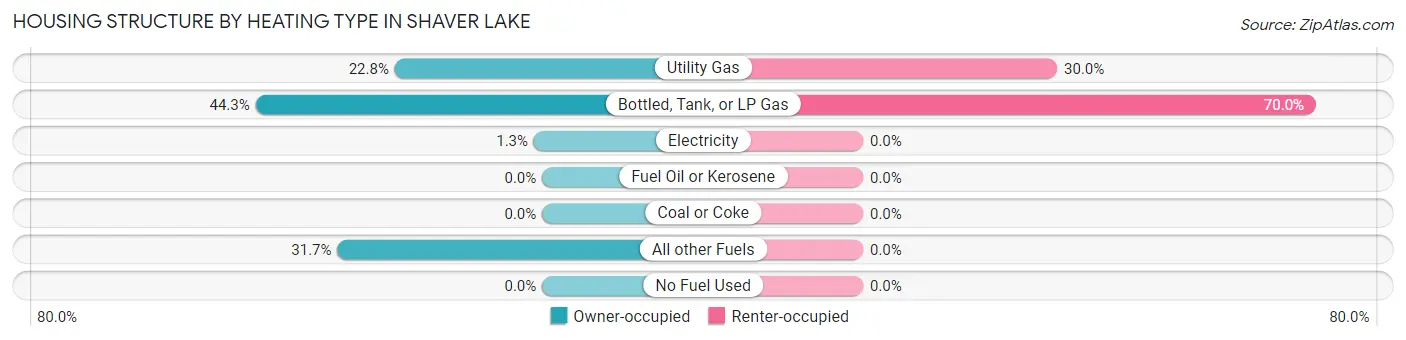
| Heating Type | Owner-occupied | Renter-occupied |
| Utility Gas | 36 (22.8%) | 3 (30.0%) |
| Bottled, Tank, or LP Gas | 70 (44.3%) | 7 (70.0%) |
| Electricity | 2 (1.3%) | 0 (0.0%) |
| Fuel Oil or Kerosene | 0 (0.0%) | 0 (0.0%) |
| Coal or Coke | 0 (0.0%) | 0 (0.0%) |
| All other Fuels | 50 (31.7%) | 0 (0.0%) |
| No Fuel Used | 0 (0.0%) | 0 (0.0%) |
| Total | 158 (100.0%) | 10 (100.0%) |
Household Vehicle Usage in Shaver Lake
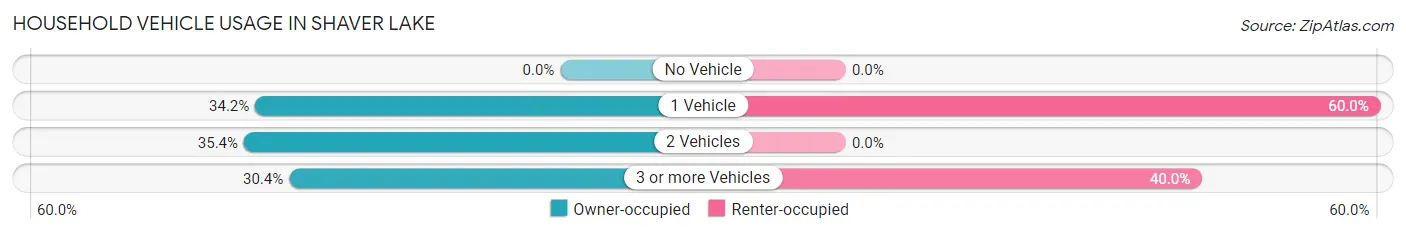
| Vehicles per Household | Owner-occupied | Renter-occupied |
| No Vehicle | 0 (0.0%) | 0 (0.0%) |
| 1 Vehicle | 54 (34.2%) | 6 (60.0%) |
| 2 Vehicles | 56 (35.4%) | 0 (0.0%) |
| 3 or more Vehicles | 48 (30.4%) | 4 (40.0%) |
| Total | 158 (100.0%) | 10 (100.0%) |
Real Estate & Mortgages in Shaver Lake
Real Estate and Mortgage Overview in Shaver Lake
| Characteristic | Without Mortgage | With Mortgage |
| Housing Units | 94 | 64 |
| Median Property Value | $635,000 | $550,000 |
| Median Household Income | $124,063 | $30 |
| Monthly Housing Costs | $784 | $8 |
| Real Estate Taxes | $2,910 | $0 |
Property Value by Mortgage Status in Shaver Lake
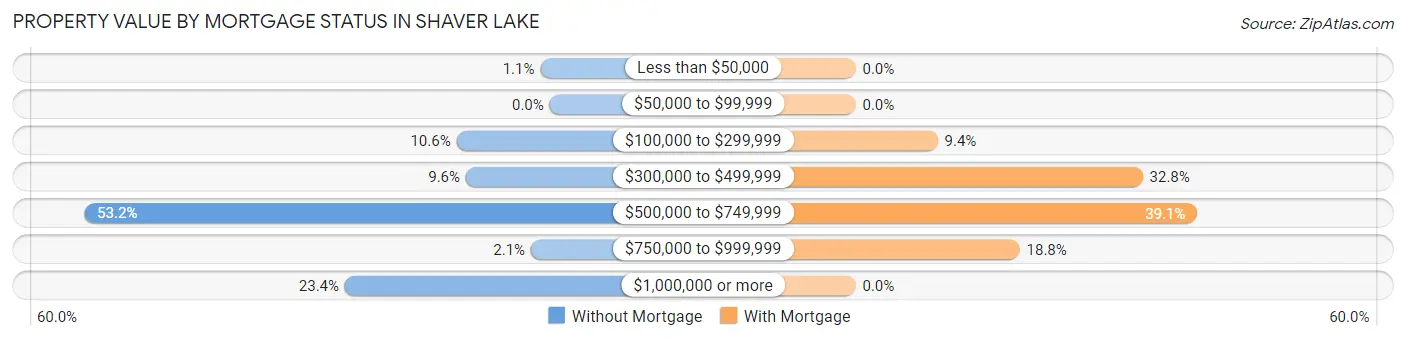
| Property Value | Without Mortgage | With Mortgage |
| Less than $50,000 | 1 (1.1%) | 0 (0.0%) |
| $50,000 to $99,999 | 0 (0.0%) | 0 (0.0%) |
| $100,000 to $299,999 | 10 (10.6%) | 6 (9.4%) |
| $300,000 to $499,999 | 9 (9.6%) | 21 (32.8%) |
| $500,000 to $749,999 | 50 (53.2%) | 25 (39.1%) |
| $750,000 to $999,999 | 2 (2.1%) | 12 (18.8%) |
| $1,000,000 or more | 22 (23.4%) | 0 (0.0%) |
| Total | 94 (100.0%) | 64 (100.0%) |
Household Income by Mortgage Status in Shaver Lake
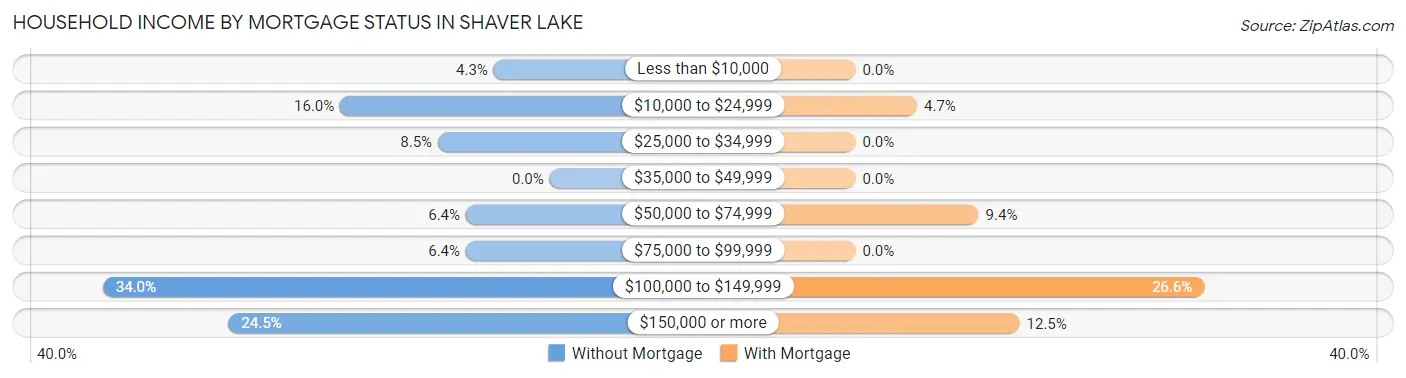
| Household Income | Without Mortgage | With Mortgage |
| Less than $10,000 | 4 (4.3%) | 0 (0.0%) |
| $10,000 to $24,999 | 15 (16.0%) | 3 (4.7%) |
| $25,000 to $34,999 | 8 (8.5%) | 0 (0.0%) |
| $35,000 to $49,999 | 0 (0.0%) | 0 (0.0%) |
| $50,000 to $74,999 | 6 (6.4%) | 6 (9.4%) |
| $75,000 to $99,999 | 6 (6.4%) | 0 (0.0%) |
| $100,000 to $149,999 | 32 (34.0%) | 17 (26.6%) |
| $150,000 or more | 23 (24.5%) | 8 (12.5%) |
| Total | 94 (100.0%) | 64 (100.0%) |
Property Value to Household Income Ratio in Shaver Lake
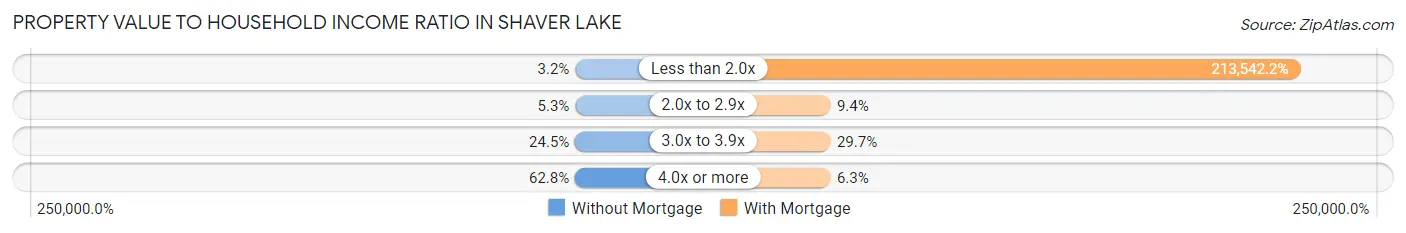
| Value-to-Income Ratio | Without Mortgage | With Mortgage |
| Less than 2.0x | 3 (3.2%) | 136,667 (213,542.2%) |
| 2.0x to 2.9x | 5 (5.3%) | 6 (9.4%) |
| 3.0x to 3.9x | 23 (24.5%) | 19 (29.7%) |
| 4.0x or more | 59 (62.8%) | 4 (6.2%) |
| Total | 94 (100.0%) | 64 (100.0%) |
Real Estate Taxes by Mortgage Status in Shaver Lake
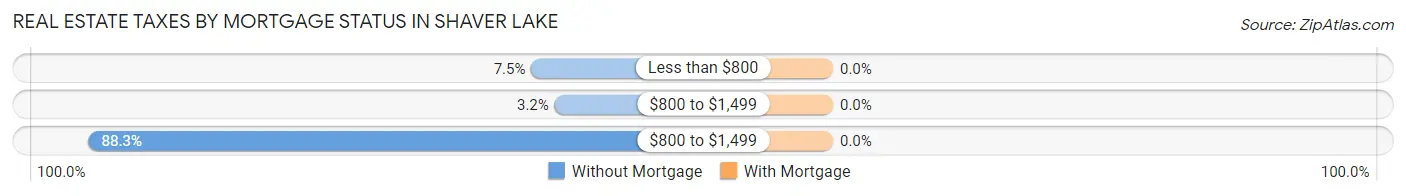
| Property Taxes | Without Mortgage | With Mortgage |
| Less than $800 | 7 (7.4%) | 0 (0.0%) |
| $800 to $1,499 | 3 (3.2%) | 0 (0.0%) |
| $800 to $1,499 | 83 (88.3%) | 0 (0.0%) |
| Total | 94 (100.0%) | 64 (100.0%) |
Health & Disability in Shaver Lake
Health Insurance Coverage by Age in Shaver Lake
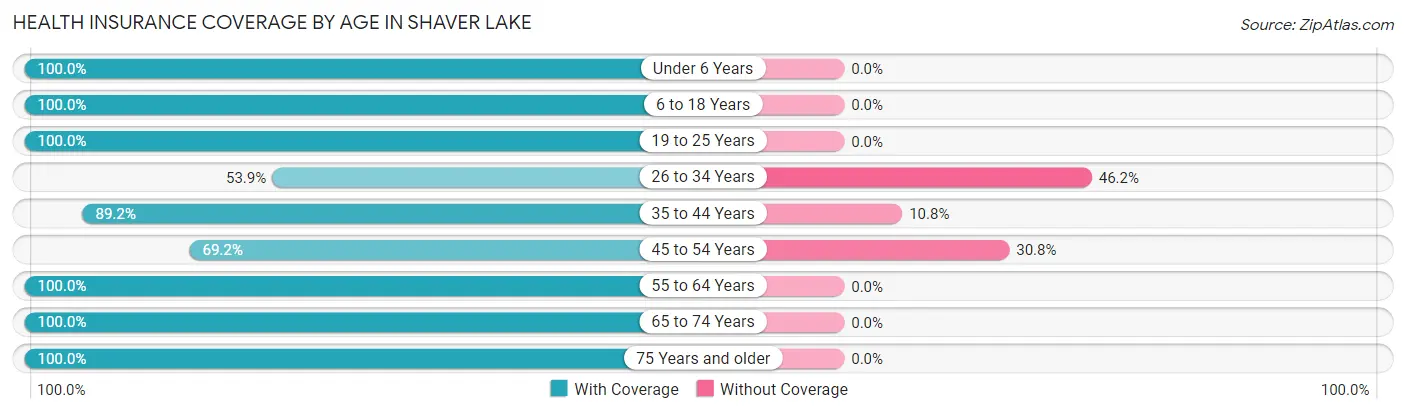
| Age Bracket | With Coverage | Without Coverage |
| Under 6 Years | 2 (100.0%) | 0 (0.0%) |
| 6 to 18 Years | 12 (100.0%) | 0 (0.0%) |
| 19 to 25 Years | 3 (100.0%) | 0 (0.0%) |
| 26 to 34 Years | 7 (53.8%) | 6 (46.2%) |
| 35 to 44 Years | 33 (89.2%) | 4 (10.8%) |
| 45 to 54 Years | 9 (69.2%) | 4 (30.8%) |
| 55 to 64 Years | 52 (100.0%) | 0 (0.0%) |
| 65 to 74 Years | 95 (100.0%) | 0 (0.0%) |
| 75 Years and older | 79 (100.0%) | 0 (0.0%) |
| Total | 292 (95.4%) | 14 (4.6%) |
Health Insurance Coverage by Citizenship Status in Shaver Lake
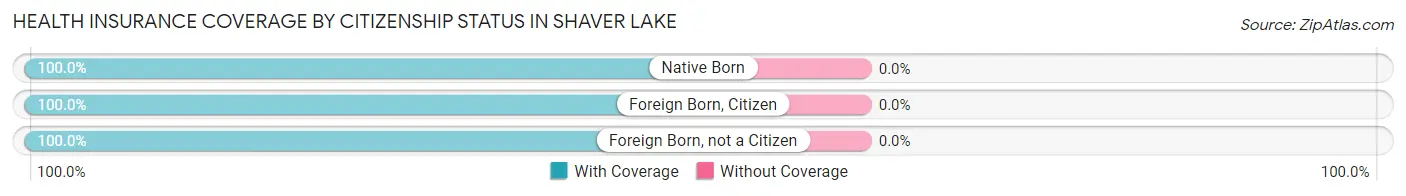
| Citizenship Status | With Coverage | Without Coverage |
| Native Born | 2 (100.0%) | 0 (0.0%) |
| Foreign Born, Citizen | 12 (100.0%) | 0 (0.0%) |
| Foreign Born, not a Citizen | 3 (100.0%) | 0 (0.0%) |
Health Insurance Coverage by Household Income in Shaver Lake
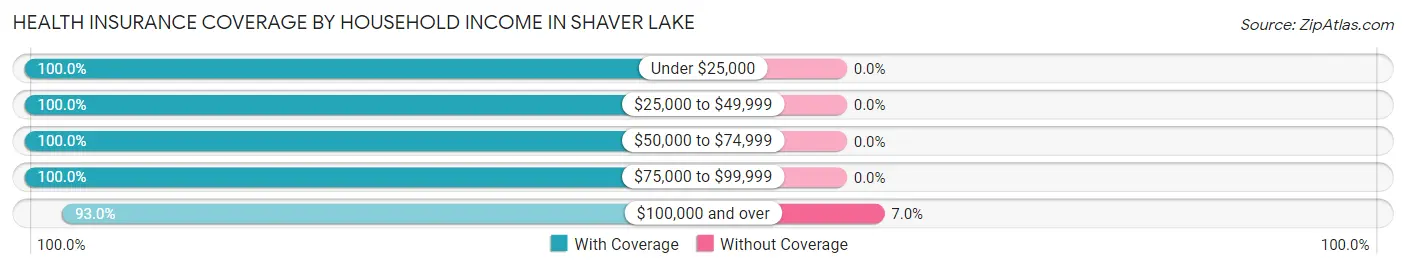
| Household Income | With Coverage | Without Coverage |
| Under $25,000 | 33 (100.0%) | 0 (0.0%) |
| $25,000 to $49,999 | 26 (100.0%) | 0 (0.0%) |
| $50,000 to $74,999 | 6 (100.0%) | 0 (0.0%) |
| $75,000 to $99,999 | 42 (100.0%) | 0 (0.0%) |
| $100,000 and over | 185 (93.0%) | 14 (7.0%) |
Public vs Private Health Insurance Coverage by Age in Shaver Lake
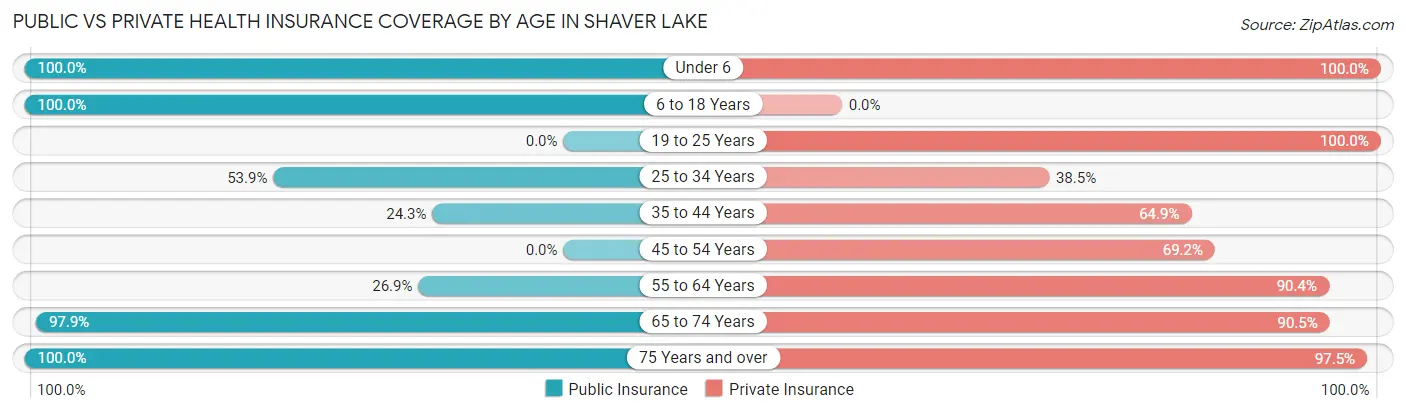
| Age Bracket | Public Insurance | Private Insurance |
| Under 6 | 2 (100.0%) | 2 (100.0%) |
| 6 to 18 Years | 12 (100.0%) | 0 (0.0%) |
| 19 to 25 Years | 0 (0.0%) | 3 (100.0%) |
| 25 to 34 Years | 7 (53.8%) | 5 (38.5%) |
| 35 to 44 Years | 9 (24.3%) | 24 (64.9%) |
| 45 to 54 Years | 0 (0.0%) | 9 (69.2%) |
| 55 to 64 Years | 14 (26.9%) | 47 (90.4%) |
| 65 to 74 Years | 93 (97.9%) | 86 (90.5%) |
| 75 Years and over | 79 (100.0%) | 77 (97.5%) |
| Total | 216 (70.6%) | 253 (82.7%) |
Disability Status by Sex by Age in Shaver Lake
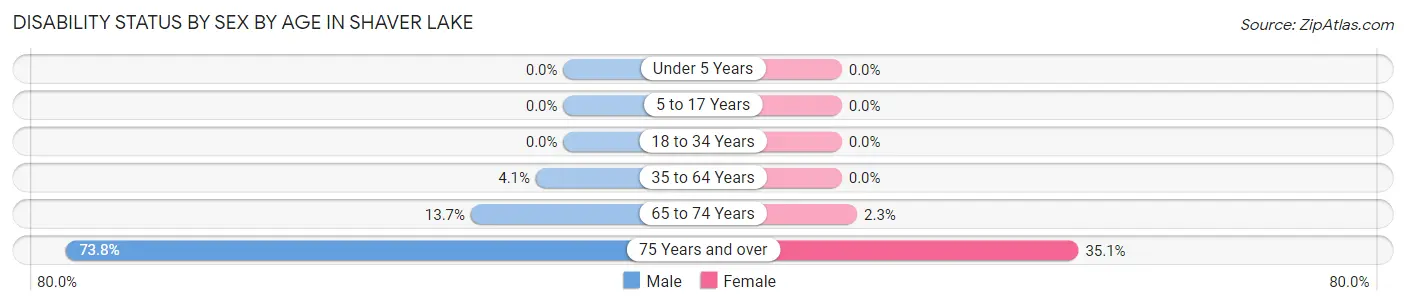
| Age Bracket | Male | Female |
| Under 5 Years | 0 (0.0%) | 0 (0.0%) |
| 5 to 17 Years | 0 (0.0%) | 0 (0.0%) |
| 18 to 34 Years | 0 (0.0%) | 0 (0.0%) |
| 35 to 64 Years | 2 (4.1%) | 0 (0.0%) |
| 65 to 74 Years | 7 (13.7%) | 1 (2.3%) |
| 75 Years and over | 31 (73.8%) | 13 (35.1%) |
Disability Class by Sex by Age in Shaver Lake
Disability Class: Hearing Difficulty
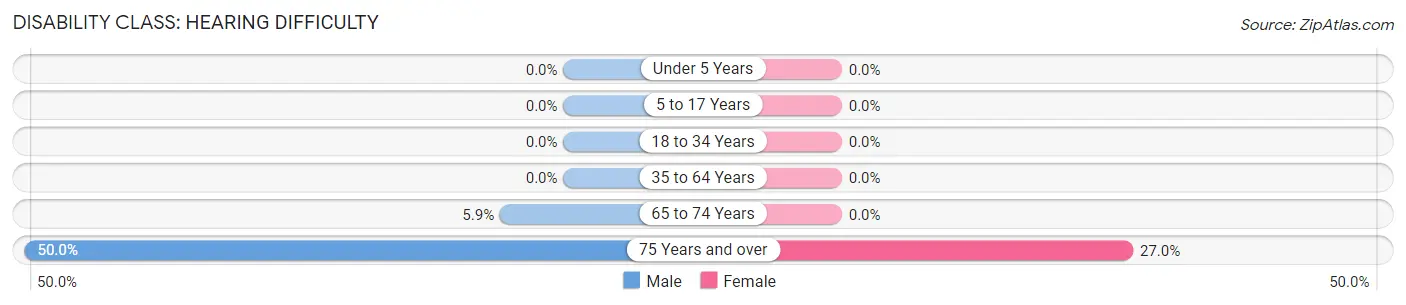
| Age Bracket | Male | Female |
| Under 5 Years | 0 (0.0%) | 0 (0.0%) |
| 5 to 17 Years | 0 (0.0%) | 0 (0.0%) |
| 18 to 34 Years | 0 (0.0%) | 0 (0.0%) |
| 35 to 64 Years | 0 (0.0%) | 0 (0.0%) |
| 65 to 74 Years | 3 (5.9%) | 0 (0.0%) |
| 75 Years and over | 21 (50.0%) | 10 (27.0%) |
Disability Class: Vision Difficulty
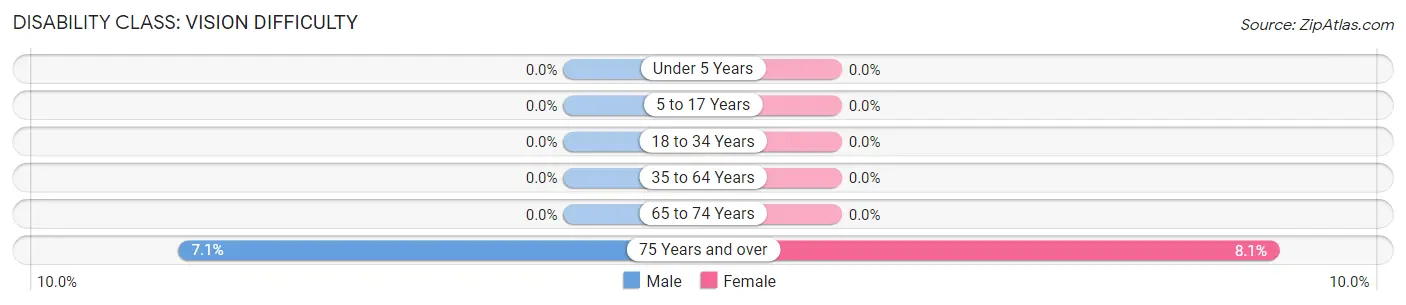
| Age Bracket | Male | Female |
| Under 5 Years | 0 (0.0%) | 0 (0.0%) |
| 5 to 17 Years | 0 (0.0%) | 0 (0.0%) |
| 18 to 34 Years | 0 (0.0%) | 0 (0.0%) |
| 35 to 64 Years | 0 (0.0%) | 0 (0.0%) |
| 65 to 74 Years | 0 (0.0%) | 0 (0.0%) |
| 75 Years and over | 3 (7.1%) | 3 (8.1%) |
Disability Class: Cognitive Difficulty
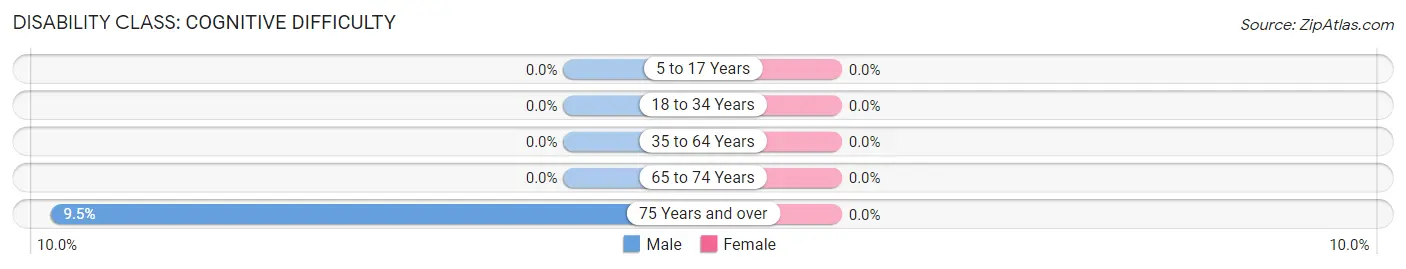
| Age Bracket | Male | Female |
| 5 to 17 Years | 0 (0.0%) | 0 (0.0%) |
| 18 to 34 Years | 0 (0.0%) | 0 (0.0%) |
| 35 to 64 Years | 0 (0.0%) | 0 (0.0%) |
| 65 to 74 Years | 0 (0.0%) | 0 (0.0%) |
| 75 Years and over | 4 (9.5%) | 0 (0.0%) |
Disability Class: Ambulatory Difficulty
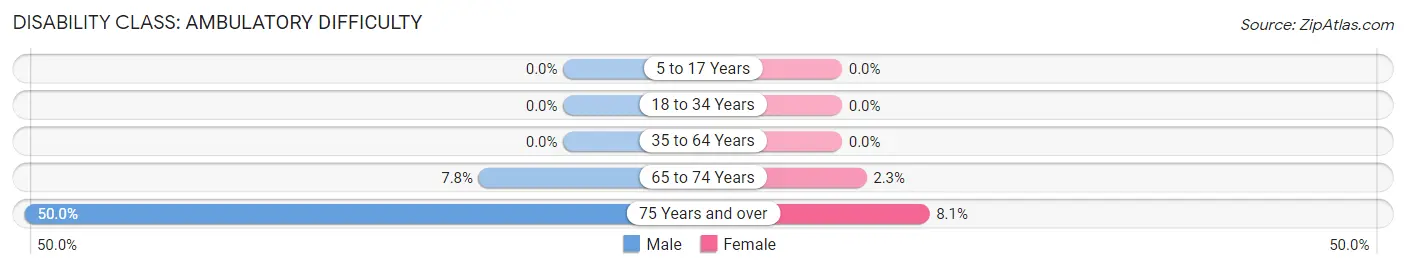
| Age Bracket | Male | Female |
| 5 to 17 Years | 0 (0.0%) | 0 (0.0%) |
| 18 to 34 Years | 0 (0.0%) | 0 (0.0%) |
| 35 to 64 Years | 0 (0.0%) | 0 (0.0%) |
| 65 to 74 Years | 4 (7.8%) | 1 (2.3%) |
| 75 Years and over | 21 (50.0%) | 3 (8.1%) |
Disability Class: Self-Care Difficulty
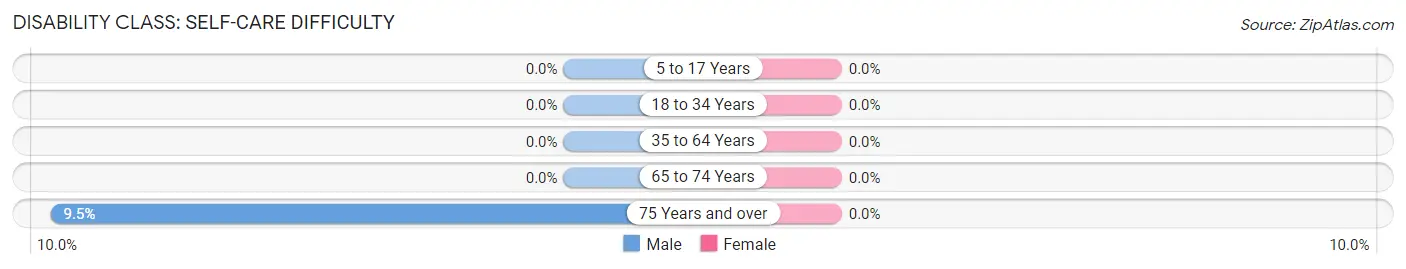
| Age Bracket | Male | Female |
| 5 to 17 Years | 0 (0.0%) | 0 (0.0%) |
| 18 to 34 Years | 0 (0.0%) | 0 (0.0%) |
| 35 to 64 Years | 0 (0.0%) | 0 (0.0%) |
| 65 to 74 Years | 0 (0.0%) | 0 (0.0%) |
| 75 Years and over | 4 (9.5%) | 0 (0.0%) |
Technology Access in Shaver Lake
Computing Device Access in Shaver Lake
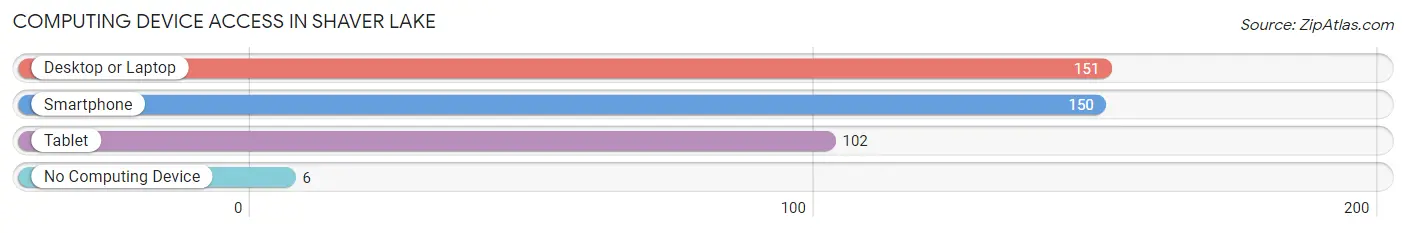
| Device Type | # Households | % Households |
| Desktop or Laptop | 151 | 89.9% |
| Smartphone | 150 | 89.3% |
| Tablet | 102 | 60.7% |
| No Computing Device | 6 | 3.6% |
| Total | 168 | 100.0% |
Internet Access in Shaver Lake
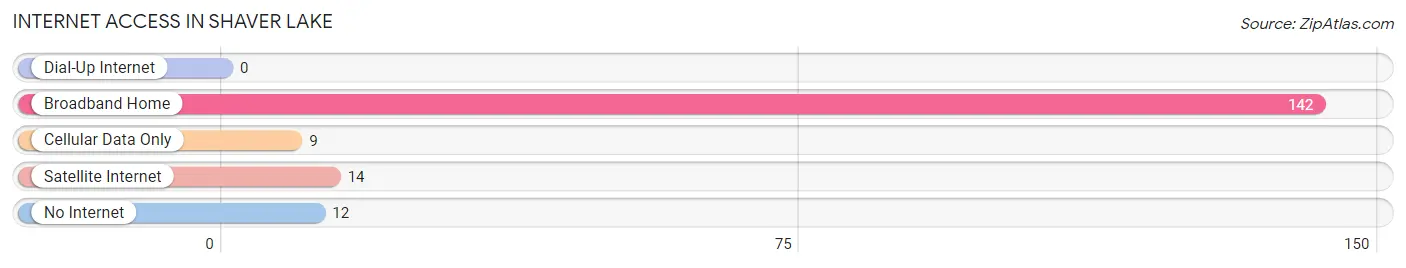
| Internet Type | # Households | % Households |
| Dial-Up Internet | 0 | 0.0% |
| Broadband Home | 142 | 84.5% |
| Cellular Data Only | 9 | 5.4% |
| Satellite Internet | 14 | 8.3% |
| No Internet | 12 | 7.1% |
| Total | 168 | 100.0% |
Shaver Lake Summary
Shaver Lake is a small mountain community located in the Sierra Nevada Mountains of California, approximately 45 miles northeast of Fresno. It is situated at an elevation of 5,500 feet and is surrounded by the Sierra National Forest. The lake itself is a man-made reservoir created in the early 1950s by the construction of Shaver Dam. The lake is a popular destination for fishing, boating, camping, and other outdoor activities.
History
The area around Shaver Lake has been inhabited for thousands of years by the Mono and Yokut Native American tribes. The first European settlers arrived in the area in the late 1800s, and the town of Shaver Lake was established in the early 1900s. The town was named after a local rancher, William Shaver, who owned a large ranch in the area.
In the early 1950s, the U.S. Army Corps of Engineers began construction of Shaver Dam, which created the lake. The dam was completed in 1954, and the lake quickly became a popular destination for fishing, boating, and other outdoor activities.
Geography
Shaver Lake is located in the Sierra Nevada Mountains of California, approximately 45 miles northeast of Fresno. It is situated at an elevation of 5,500 feet and is surrounded by the Sierra National Forest. The lake itself is a man-made reservoir created in the early 1950s by the construction of Shaver Dam. The lake is approximately 4 miles long and 1 mile wide, and has a maximum depth of approximately 200 feet.
The area around Shaver Lake is mostly mountainous, with several peaks rising to over 8,000 feet. The lake is fed by several creeks and streams, including the North Fork of the Kings River, which flows into the lake from the north.
Economy
The economy of Shaver Lake is largely based on tourism. The lake is a popular destination for fishing, boating, camping, and other outdoor activities. The area also has several resorts and lodges, as well as restaurants and other businesses catering to tourists.
In addition to tourism, the area is also home to several logging and lumber companies. The lumber industry has been a major part of the local economy since the early 1900s.
Demographics
As of the 2010 census, the population of Shaver Lake was 1,143. The racial makeup of the town was 94.3% White, 0.7% African American, 0.7% Native American, 0.7% Asian, 0.2% Pacific Islander, and 2.6% from other races. The median household income was $45,000, and the median age was 44.
Conclusion
Shaver Lake is a small mountain community located in the Sierra Nevada Mountains of California, approximately 45 miles northeast of Fresno. It is situated at an elevation of 5,500 feet and is surrounded by the Sierra National Forest. The lake itself is a man-made reservoir created in the early 1950s by the construction of Shaver Dam. The lake is a popular destination for fishing, boating, camping, and other outdoor activities. The economy of Shaver Lake is largely based on tourism, as well as logging and lumber companies. As of the 2010 census, the population of Shaver Lake was 1,143.
Common Questions
What is Per Capita Income in Shaver Lake?
Per Capita income in Shaver Lake is $62,868.
What is the Median Family Income in Shaver Lake?
Median Family Income in Shaver Lake is $138,750.
What is the Median Household income in Shaver Lake?
Median Household Income in Shaver Lake is $125,000.
What is Income or Wage Gap in Shaver Lake?
Income or Wage Gap in Shaver Lake is 60.2%.
Women in Shaver Lake earn 39.8 cents for every dollar earned by a man.
What is Inequality or Gini Index in Shaver Lake?
Inequality or Gini Index in Shaver Lake is 0.33.
What is the Total Population of Shaver Lake?
Total Population of Shaver Lake is 306.
What is the Total Male Population of Shaver Lake?
Total Male Population of Shaver Lake is 166.
What is the Total Female Population of Shaver Lake?
Total Female Population of Shaver Lake is 140.
What is the Ratio of Males per 100 Females in Shaver Lake?
There are 118.57 Males per 100 Females in Shaver Lake.
What is the Ratio of Females per 100 Males in Shaver Lake?
There are 84.34 Females per 100 Males in Shaver Lake.
What is the Median Population Age in Shaver Lake?
Median Population Age in Shaver Lake is 66.4 Years.
What is the Average Family Size in Shaver Lake
Average Family Size in Shaver Lake is 2.2 People.
What is the Average Household Size in Shaver Lake
Average Household Size in Shaver Lake is 1.8 People.
How Large is the Labor Force in Shaver Lake?
There are 94 People in the Labor Forcein in Shaver Lake.
What is the Percentage of People in the Labor Force in Shaver Lake?
31.5% of People are in the Labor Force in Shaver Lake.
What is the Unemployment Rate in Shaver Lake?
Unemployment Rate in Shaver Lake is 6.4%.