Cities with the Highest Percentage of Population Employed in Life, Physical & Social Science in New Jersey
RELATED REPORTS & OPTIONS
Life, Physical & Social Science
New Jersey
Compare Cities
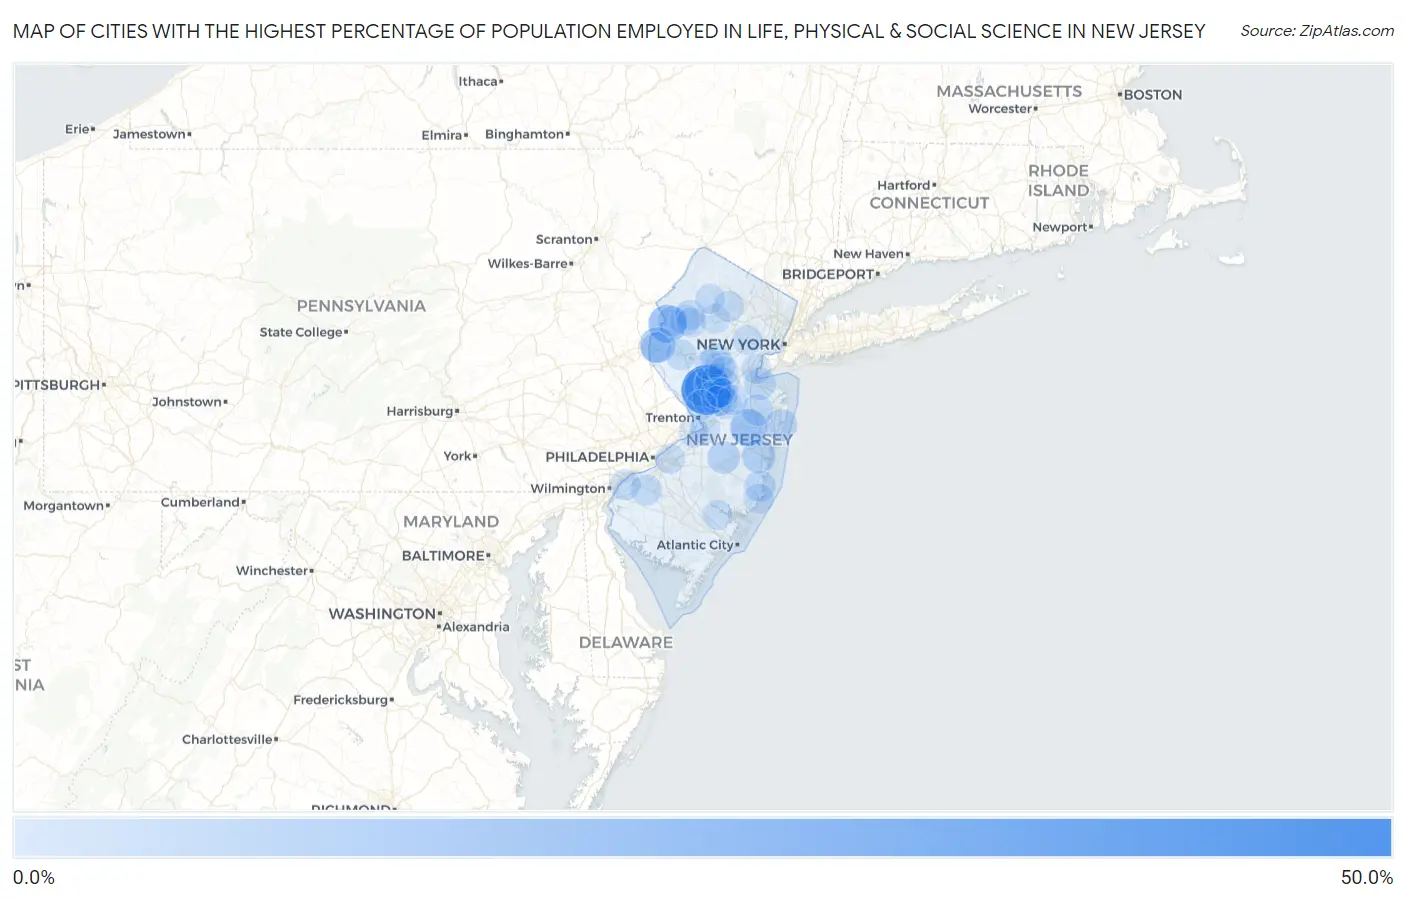
Map of Cities with the Highest Percentage of Population Employed in Life, Physical & Social Science in New Jersey
0.0%
50.0%
Cities with the Highest Percentage of Population Employed in Life, Physical & Social Science in New Jersey
| City | % Employed | vs State | vs National | |
| 1. | Blawenburg | 47.5% | 1.3%(+46.2)#1 | 1.1%(+46.4)#20 |
| 2. | Skillman | 21.5% | 1.3%(+20.3)#2 | 1.1%(+20.5)#66 |
| 3. | Bridgeville | 20.3% | 1.3%(+19.0)#3 | 1.1%(+19.2)#74 |
| 4. | Vista Center | 17.5% | 1.3%(+16.2)#4 | 1.1%(+16.4)#92 |
| 5. | Upper Stewartsville | 15.0% | 1.3%(+13.8)#5 | 1.1%(+13.9)#116 |
| 6. | Deans | 10.1% | 1.3%(+8.87)#6 | 1.1%(+9.04)#221 |
| 7. | Silver Ridge | 10.0% | 1.3%(+8.78)#7 | 1.1%(+8.94)#226 |
| 8. | Pluckemin | 8.7% | 1.3%(+7.44)#8 | 1.1%(+7.60)#293 |
| 9. | Princeton | 8.0% | 1.3%(+6.76)#9 | 1.1%(+6.93)#341 |
| 10. | Country Lake Estates | 7.9% | 1.3%(+6.66)#10 | 1.1%(+6.83)#349 |
| 11. | West Belmar | 6.9% | 1.3%(+5.63)#11 | 1.1%(+5.80)#445 |
| 12. | Dennisville | 6.7% | 1.3%(+5.47)#12 | 1.1%(+5.64)#466 |
| 13. | Neshanic | 6.4% | 1.3%(+5.15)#13 | 1.1%(+5.31)#512 |
| 14. | Cliffwood Beach | 6.2% | 1.3%(+5.00)#14 | 1.1%(+5.16)#538 |
| 15. | East Freehold | 6.1% | 1.3%(+4.86)#15 | 1.1%(+5.02)#560 |
| 16. | Princeton Meadows | 6.0% | 1.3%(+4.71)#16 | 1.1%(+4.88)#588 |
| 17. | Auburn | 5.8% | 1.3%(+4.54)#17 | 1.1%(+4.70)#616 |
| 18. | Belle Mead | 5.7% | 1.3%(+4.41)#18 | 1.1%(+4.57)#640 |
| 19. | Rocky Hill Borough | 5.5% | 1.3%(+4.25)#19 | 1.1%(+4.41)#668 |
| 20. | Monroe Manor | 5.3% | 1.3%(+4.06)#20 | 1.1%(+4.22)#721 |
| 21. | Barnegat | 5.3% | 1.3%(+4.02)#21 | 1.1%(+4.18)#727 |
| 22. | Sea Bright Borough | 5.2% | 1.3%(+3.96)#22 | 1.1%(+4.13)#739 |
| 23. | Mullica Hill | 5.0% | 1.3%(+3.76)#23 | 1.1%(+3.92)#785 |
| 24. | Fieldsboro Borough | 4.9% | 1.3%(+3.61)#24 | 1.1%(+3.77)#825 |
| 25. | New Gretna | 4.9% | 1.3%(+3.60)#25 | 1.1%(+3.76)#829 |
| 26. | Woodcliff Lake Borough | 4.7% | 1.3%(+3.49)#26 | 1.1%(+3.65)#865 |
| 27. | Chatham Borough | 4.6% | 1.3%(+3.37)#27 | 1.1%(+3.53)#901 |
| 28. | Magnolia Borough | 4.6% | 1.3%(+3.36)#28 | 1.1%(+3.53)#902 |
| 29. | Harlingen | 4.6% | 1.3%(+3.31)#29 | 1.1%(+3.47)#922 |
| 30. | Pedricktown | 4.5% | 1.3%(+3.29)#30 | 1.1%(+3.45)#927 |
| 31. | Franklin Park | 4.5% | 1.3%(+3.22)#31 | 1.1%(+3.39)#964 |
| 32. | Green Knoll | 4.5% | 1.3%(+3.20)#32 | 1.1%(+3.37)#969 |
| 33. | Highland Park Borough | 4.4% | 1.3%(+3.17)#33 | 1.1%(+3.33)#982 |
| 34. | Clinton | 4.4% | 1.3%(+3.17)#34 | 1.1%(+3.33)#983 |
| 35. | Pennington Borough | 4.4% | 1.3%(+3.16)#35 | 1.1%(+3.33)#984 |
| 36. | Kingston | 4.4% | 1.3%(+3.16)#36 | 1.1%(+3.32)#989 |
| 37. | Allenhurst Borough | 4.4% | 1.3%(+3.11)#37 | 1.1%(+3.28)#1,011 |
| 38. | Cape May Point Borough | 4.3% | 1.3%(+3.09)#38 | 1.1%(+3.26)#1,022 |
| 39. | Blackwells Mills | 4.3% | 1.3%(+3.03)#39 | 1.1%(+3.20)#1,041 |
| 40. | Harvey Cedars Borough | 4.2% | 1.3%(+2.96)#40 | 1.1%(+3.12)#1,074 |
| 41. | Spring Lake Borough | 4.2% | 1.3%(+2.92)#41 | 1.1%(+3.08)#1,089 |
| 42. | Florham Park Borough | 4.1% | 1.3%(+2.88)#42 | 1.1%(+3.04)#1,105 |
| 43. | Cranbury | 4.1% | 1.3%(+2.82)#43 | 1.1%(+2.99)#1,126 |
| 44. | Greenwich | 4.1% | 1.3%(+2.81)#44 | 1.1%(+2.98)#1,128 |
| 45. | Lake Telemark | 3.9% | 1.3%(+2.66)#45 | 1.1%(+2.82)#1,217 |
| 46. | Llewellyn Park | 3.9% | 1.3%(+2.65)#46 | 1.1%(+2.81)#1,223 |
| 47. | Milltown Borough | 3.7% | 1.3%(+2.49)#47 | 1.1%(+2.65)#1,298 |
| 48. | Rockaway Borough | 3.7% | 1.3%(+2.45)#48 | 1.1%(+2.61)#1,333 |
| 49. | Vienna | 3.7% | 1.3%(+2.43)#49 | 1.1%(+2.60)#1,341 |
| 50. | Finderne | 3.7% | 1.3%(+2.43)#50 | 1.1%(+2.59)#1,348 |
| 51. | Bradley Gardens | 3.6% | 1.3%(+2.35)#51 | 1.1%(+2.51)#1,400 |
| 52. | Saddle River Borough | 3.5% | 1.3%(+2.24)#52 | 1.1%(+2.40)#1,492 |
| 53. | Mount Tabor | 3.4% | 1.3%(+2.16)#53 | 1.1%(+2.32)#1,538 |
| 54. | New Vernon | 3.4% | 1.3%(+2.13)#54 | 1.1%(+2.29)#1,555 |
| 55. | English Creek | 3.3% | 1.3%(+2.07)#55 | 1.1%(+2.23)#1,596 |
| 56. | Bordentown | 3.3% | 1.3%(+2.06)#56 | 1.1%(+2.22)#1,605 |
| 57. | Beach Haven West | 3.3% | 1.3%(+2.03)#57 | 1.1%(+2.20)#1,625 |
| 58. | Mountain Lake | 3.2% | 1.3%(+1.99)#58 | 1.1%(+2.15)#1,660 |
| 59. | Monmouth Junction | 3.2% | 1.3%(+1.98)#59 | 1.1%(+2.15)#1,666 |
| 60. | Plainsboro Center | 3.2% | 1.3%(+1.95)#60 | 1.1%(+2.11)#1,697 |
| 61. | Short Hills | 3.1% | 1.3%(+1.89)#61 | 1.1%(+2.06)#1,740 |
| 62. | Panther Valley | 3.1% | 1.3%(+1.86)#62 | 1.1%(+2.03)#1,776 |
| 63. | Medford Lakes Borough | 3.1% | 1.3%(+1.85)#63 | 1.1%(+2.02)#1,787 |
| 64. | Sewaren | 3.1% | 1.3%(+1.84)#64 | 1.1%(+2.00)#1,807 |
| 65. | Caldwell Borough | 3.1% | 1.3%(+1.82)#65 | 1.1%(+1.98)#1,821 |
| 66. | Old Tappan Borough | 3.0% | 1.3%(+1.77)#66 | 1.1%(+1.94)#1,870 |
| 67. | Hillsborough | 3.0% | 1.3%(+1.77)#67 | 1.1%(+1.93)#1,872 |
| 68. | Wharton Borough | 3.0% | 1.3%(+1.74)#68 | 1.1%(+1.91)#1,886 |
| 69. | Midland Park Borough | 3.0% | 1.3%(+1.70)#69 | 1.1%(+1.86)#1,920 |
| 70. | The Hills | 2.9% | 1.3%(+1.67)#70 | 1.1%(+1.83)#1,950 |
| 71. | Preakness | 2.9% | 1.3%(+1.65)#71 | 1.1%(+1.82)#1,960 |
| 72. | Seaside Heights Borough | 2.9% | 1.3%(+1.64)#72 | 1.1%(+1.80)#1,974 |
| 73. | Parsippany | 2.9% | 1.3%(+1.62)#73 | 1.1%(+1.79)#1,989 |
| 74. | Manville Borough | 2.9% | 1.3%(+1.62)#74 | 1.1%(+1.78)#1,992 |
| 75. | Egg Harbor City | 2.8% | 1.3%(+1.59)#75 | 1.1%(+1.75)#2,024 |
| 76. | Rossmoor | 2.8% | 1.3%(+1.57)#76 | 1.1%(+1.73)#2,046 |
| 77. | Lake Hiawatha | 2.8% | 1.3%(+1.53)#77 | 1.1%(+1.70)#2,103 |
| 78. | Lawrenceville | 2.8% | 1.3%(+1.50)#78 | 1.1%(+1.66)#2,148 |
| 79. | Madison Borough | 2.7% | 1.3%(+1.46)#79 | 1.1%(+1.63)#2,201 |
| 80. | Haddonfield Borough | 2.7% | 1.3%(+1.46)#80 | 1.1%(+1.62)#2,208 |
| 81. | Cherry Hill Mall | 2.7% | 1.3%(+1.42)#81 | 1.1%(+1.58)#2,248 |
| 82. | Lyons | 2.7% | 1.3%(+1.40)#82 | 1.1%(+1.56)#2,280 |
| 83. | Bogota Borough | 2.7% | 1.3%(+1.40)#83 | 1.1%(+1.56)#2,281 |
| 84. | Kenvil | 2.7% | 1.3%(+1.40)#84 | 1.1%(+1.56)#2,282 |
| 85. | Hackettstown | 2.6% | 1.3%(+1.39)#85 | 1.1%(+1.56)#2,287 |
| 86. | North Haledon Borough | 2.6% | 1.3%(+1.36)#86 | 1.1%(+1.53)#2,330 |
| 87. | Watchung Borough | 2.6% | 1.3%(+1.35)#87 | 1.1%(+1.51)#2,355 |
| 88. | Hampton Borough | 2.6% | 1.3%(+1.33)#88 | 1.1%(+1.50)#2,370 |
| 89. | New Providence Borough | 2.6% | 1.3%(+1.33)#89 | 1.1%(+1.50)#2,372 |
| 90. | Lake Mohawk | 2.6% | 1.3%(+1.33)#90 | 1.1%(+1.49)#2,382 |
| 91. | Hopatcong Borough | 2.6% | 1.3%(+1.31)#91 | 1.1%(+1.47)#2,415 |
| 92. | Bargaintown | 2.6% | 1.3%(+1.31)#92 | 1.1%(+1.47)#2,416 |
| 93. | Woodland Park Borough | 2.6% | 1.3%(+1.30)#93 | 1.1%(+1.46)#2,431 |
| 94. | Bridgewater Center | 2.6% | 1.3%(+1.30)#94 | 1.1%(+1.46)#2,433 |
| 95. | Franklin Center | 2.5% | 1.3%(+1.26)#95 | 1.1%(+1.43)#2,494 |
| 96. | Chester Borough | 2.5% | 1.3%(+1.26)#96 | 1.1%(+1.42)#2,498 |
| 97. | Heathcote | 2.5% | 1.3%(+1.25)#97 | 1.1%(+1.42)#2,507 |
| 98. | Florence | 2.5% | 1.3%(+1.25)#98 | 1.1%(+1.42)#2,509 |
| 99. | Bound Brook Borough | 2.5% | 1.3%(+1.25)#99 | 1.1%(+1.42)#2,510 |
| 100. | East Rutherford Borough | 2.5% | 1.3%(+1.22)#100 | 1.1%(+1.39)#2,555 |
Common Questions
What are the Top 10 Cities with the Highest Percentage of Population Employed in Life, Physical & Social Science in New Jersey?
Top 10 Cities with the Highest Percentage of Population Employed in Life, Physical & Social Science in New Jersey are:
#1
47.5%
#2
21.5%
#3
20.3%
#4
17.5%
#5
15.0%
#6
10.0%
#7
8.0%
#8
7.9%
#9
6.9%
#10
6.2%
What city has the Highest Percentage of Population Employed in Life, Physical & Social Science in New Jersey?
Blawenburg has the Highest Percentage of Population Employed in Life, Physical & Social Science in New Jersey with 47.5%.
What is the Percentage of Population Employed in Life, Physical & Social Science in the State of New Jersey?
Percentage of Population Employed in Life, Physical & Social Science in New Jersey is 1.3%.
What is the Percentage of Population Employed in Life, Physical & Social Science in the United States?
Percentage of Population Employed in Life, Physical & Social Science in the United States is 1.1%.