Cities with the Highest Percentage of Population Employed in Life, Physical & Social Science in Texas
RELATED REPORTS & OPTIONS
Life, Physical & Social Science
Texas
Compare Cities
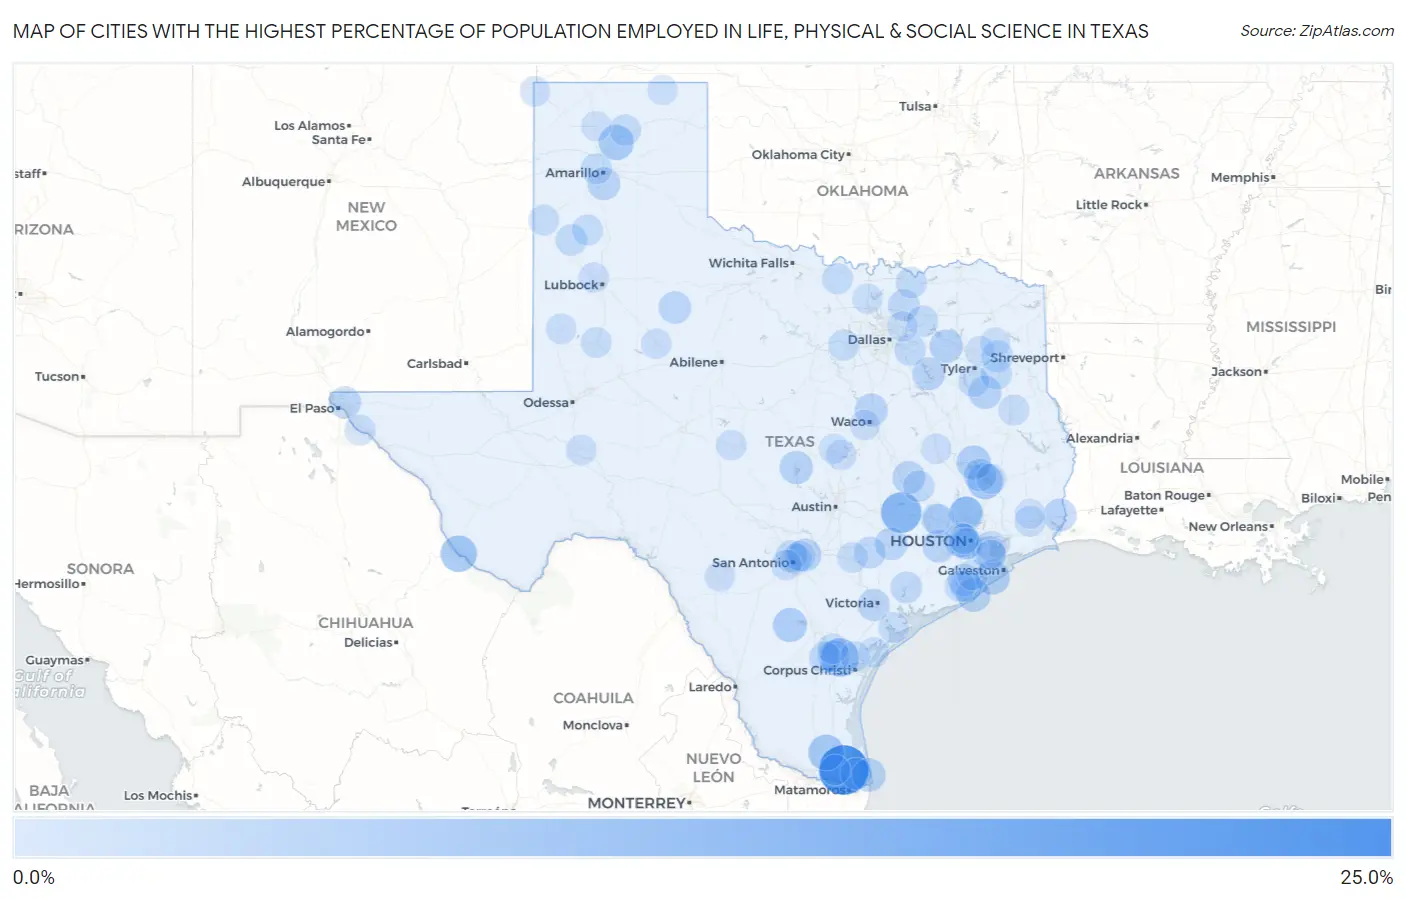
Map of Cities with the Highest Percentage of Population Employed in Life, Physical & Social Science in Texas
0.0%
25.0%
Cities with the Highest Percentage of Population Employed in Life, Physical & Social Science in Texas
| City | % Employed | vs State | vs National | |
| 1. | Arroyo Colorado Estates | 24.3% | 0.84%(+23.5)#1 | 1.1%(+23.2)#56 |
| 2. | Burton | 13.7% | 0.84%(+12.9)#2 | 1.1%(+12.6)#144 |
| 3. | Edroy | 11.0% | 0.84%(+10.2)#3 | 1.1%(+9.93)#201 |
| 4. | Presidio | 9.1% | 0.84%(+8.23)#4 | 1.1%(+7.98)#277 |
| 5. | Cape Royale | 8.6% | 0.84%(+7.73)#5 | 1.1%(+7.48)#301 |
| 6. | Lasara | 8.5% | 0.84%(+7.63)#6 | 1.1%(+7.38)#313 |
| 7. | Fritch | 7.7% | 0.84%(+6.88)#7 | 1.1%(+6.63)#363 |
| 8. | Jamaica Beach | 6.8% | 0.84%(+5.97)#8 | 1.1%(+5.72)#458 |
| 9. | Oak Ridge North | 6.8% | 0.84%(+5.92)#9 | 1.1%(+5.68)#462 |
| 10. | Westwood Shores | 6.7% | 0.84%(+5.87)#10 | 1.1%(+5.62)#467 |
| 11. | Bunker Hill Village | 6.7% | 0.84%(+5.85)#11 | 1.1%(+5.60)#468 |
| 12. | Tilden | 6.5% | 0.84%(+5.65)#12 | 1.1%(+5.40)#505 |
| 13. | Quintana | 6.1% | 0.84%(+5.22)#13 | 1.1%(+4.97)#574 |
| 14. | South Padre Island | 5.8% | 0.84%(+5.01)#14 | 1.1%(+4.76)#608 |
| 15. | Fruitvale | 5.7% | 0.84%(+4.86)#15 | 1.1%(+4.61)#632 |
| 16. | Buchanan Lake Village | 5.6% | 0.84%(+4.80)#16 | 1.1%(+4.55)#643 |
| 17. | Taylor Lake Village | 5.5% | 0.84%(+4.61)#17 | 1.1%(+4.36)#679 |
| 18. | New Summerfield | 5.4% | 0.84%(+4.59)#18 | 1.1%(+4.34)#687 |
| 19. | Randolph Afb | 5.3% | 0.84%(+4.49)#19 | 1.1%(+4.24)#711 |
| 20. | Orange | 5.3% | 0.84%(+4.45)#20 | 1.1%(+4.20)#726 |
| 21. | Timbercreek Canyon | 5.3% | 0.84%(+4.42)#21 | 1.1%(+4.17)#730 |
| 22. | Lake Bryan | 5.3% | 0.84%(+4.41)#22 | 1.1%(+4.16)#734 |
| 23. | Ross | 5.2% | 0.84%(+4.35)#23 | 1.1%(+4.10)#747 |
| 24. | Enchanted Oaks | 5.2% | 0.84%(+4.33)#24 | 1.1%(+4.08)#752 |
| 25. | Jayton | 4.9% | 0.84%(+4.05)#25 | 1.1%(+3.80)#817 |
| 26. | Point Blank | 4.9% | 0.84%(+4.05)#26 | 1.1%(+3.80)#818 |
| 27. | Weston Lakes | 4.9% | 0.84%(+4.03)#27 | 1.1%(+3.78)#823 |
| 28. | Weimar | 4.8% | 0.84%(+3.97)#28 | 1.1%(+3.72)#844 |
| 29. | Quail Creek | 4.6% | 0.84%(+3.71)#29 | 1.1%(+3.46)#924 |
| 30. | Fort Bliss | 4.4% | 0.84%(+3.60)#30 | 1.1%(+3.35)#972 |
| 31. | San Patricio | 4.3% | 0.84%(+3.44)#31 | 1.1%(+3.19)#1,042 |
| 32. | Bellaire | 4.2% | 0.84%(+3.35)#32 | 1.1%(+3.10)#1,082 |
| 33. | Castle Hills | 4.2% | 0.84%(+3.34)#33 | 1.1%(+3.09)#1,086 |
| 34. | Shenandoah | 4.1% | 0.84%(+3.25)#34 | 1.1%(+3.00)#1,117 |
| 35. | Bailey S Prairie | 4.1% | 0.84%(+3.22)#35 | 1.1%(+2.97)#1,129 |
| 36. | Lake Jackson | 4.1% | 0.84%(+3.22)#36 | 1.1%(+2.97)#1,130 |
| 37. | Hilltop Cdp Frio County | 4.0% | 0.84%(+3.14)#37 | 1.1%(+2.89)#1,176 |
| 38. | Orange Grove | 4.0% | 0.84%(+3.14)#38 | 1.1%(+2.89)#1,179 |
| 39. | Moulton | 4.0% | 0.84%(+3.12)#39 | 1.1%(+2.87)#1,193 |
| 40. | Melissa | 3.9% | 0.84%(+3.09)#40 | 1.1%(+2.84)#1,206 |
| 41. | Ganado | 3.9% | 0.84%(+3.08)#41 | 1.1%(+2.83)#1,215 |
| 42. | Clarksville City | 3.8% | 0.84%(+2.98)#42 | 1.1%(+2.74)#1,263 |
| 43. | Crandall | 3.7% | 0.84%(+2.89)#43 | 1.1%(+2.64)#1,299 |
| 44. | Bayview | 3.7% | 0.84%(+2.89)#44 | 1.1%(+2.64)#1,303 |
| 45. | Waller | 3.7% | 0.84%(+2.88)#45 | 1.1%(+2.64)#1,305 |
| 46. | New London | 3.7% | 0.84%(+2.84)#46 | 1.1%(+2.59)#1,349 |
| 47. | College Station | 3.6% | 0.84%(+2.77)#47 | 1.1%(+2.53)#1,394 |
| 48. | Stinnett | 3.5% | 0.84%(+2.68)#48 | 1.1%(+2.44)#1,463 |
| 49. | Earth | 3.5% | 0.84%(+2.67)#49 | 1.1%(+2.42)#1,471 |
| 50. | Caddo Mills | 3.5% | 0.84%(+2.67)#50 | 1.1%(+2.42)#1,472 |
| 51. | Bells | 3.5% | 0.84%(+2.64)#51 | 1.1%(+2.39)#1,496 |
| 52. | Bishop Hills | 3.4% | 0.84%(+2.61)#52 | 1.1%(+2.36)#1,517 |
| 53. | Bullard | 3.4% | 0.84%(+2.57)#53 | 1.1%(+2.32)#1,544 |
| 54. | Aledo | 3.3% | 0.84%(+2.46)#54 | 1.1%(+2.21)#1,613 |
| 55. | West University Place | 3.3% | 0.84%(+2.43)#55 | 1.1%(+2.19)#1,633 |
| 56. | Montague | 3.2% | 0.84%(+2.33)#56 | 1.1%(+2.08)#1,716 |
| 57. | Hart | 3.2% | 0.84%(+2.32)#57 | 1.1%(+2.07)#1,726 |
| 58. | Morgan S Point | 3.1% | 0.84%(+2.22)#58 | 1.1%(+1.97)#1,832 |
| 59. | Brazoria | 3.0% | 0.84%(+2.20)#59 | 1.1%(+1.95)#1,855 |
| 60. | Tornillo | 3.0% | 0.84%(+2.20)#60 | 1.1%(+1.95)#1,859 |
| 61. | Bovina | 3.0% | 0.84%(+2.17)#61 | 1.1%(+1.92)#1,875 |
| 62. | Appleby | 3.0% | 0.84%(+2.14)#62 | 1.1%(+1.89)#1,896 |
| 63. | Terrell Hills | 3.0% | 0.84%(+2.13)#63 | 1.1%(+1.89)#1,902 |
| 64. | Chula Vista Cdp Maverick County | 3.0% | 0.84%(+2.13)#64 | 1.1%(+1.88)#1,905 |
| 65. | China | 2.9% | 0.84%(+2.10)#65 | 1.1%(+1.85)#1,929 |
| 66. | Danbury | 2.9% | 0.84%(+2.04)#66 | 1.1%(+1.79)#1,985 |
| 67. | Lamesa | 2.9% | 0.84%(+2.03)#67 | 1.1%(+1.78)#1,990 |
| 68. | Gonzales | 2.9% | 0.84%(+2.03)#68 | 1.1%(+1.78)#1,993 |
| 69. | Windcrest | 2.8% | 0.84%(+2.00)#69 | 1.1%(+1.76)#2,020 |
| 70. | Seadrift | 2.8% | 0.84%(+1.94)#70 | 1.1%(+1.70)#2,107 |
| 71. | Mathis | 2.8% | 0.84%(+1.94)#71 | 1.1%(+1.69)#2,110 |
| 72. | Palm Valley | 2.8% | 0.84%(+1.91)#72 | 1.1%(+1.66)#2,155 |
| 73. | Seagraves | 2.7% | 0.84%(+1.89)#73 | 1.1%(+1.64)#2,187 |
| 74. | Texline | 2.7% | 0.84%(+1.88)#74 | 1.1%(+1.64)#2,193 |
| 75. | Melvin | 2.7% | 0.84%(+1.86)#75 | 1.1%(+1.61)#2,225 |
| 76. | Harker Heights | 2.7% | 0.84%(+1.85)#76 | 1.1%(+1.60)#2,231 |
| 77. | Mccamey | 2.7% | 0.84%(+1.82)#77 | 1.1%(+1.57)#2,260 |
| 78. | Woodway | 2.6% | 0.84%(+1.78)#78 | 1.1%(+1.53)#2,321 |
| 79. | Snyder | 2.6% | 0.84%(+1.77)#79 | 1.1%(+1.52)#2,337 |
| 80. | Lackland Afb | 2.6% | 0.84%(+1.76)#80 | 1.1%(+1.52)#2,349 |
| 81. | Leona | 2.6% | 0.84%(+1.74)#81 | 1.1%(+1.49)#2,385 |
| 82. | Shallowater | 2.6% | 0.84%(+1.72)#82 | 1.1%(+1.47)#2,417 |
| 83. | Rockport | 2.5% | 0.84%(+1.70)#83 | 1.1%(+1.46)#2,442 |
| 84. | Prairie View | 2.5% | 0.84%(+1.66)#84 | 1.1%(+1.41)#2,515 |
| 85. | Uvalde | 2.5% | 0.84%(+1.63)#85 | 1.1%(+1.38)#2,564 |
| 86. | West Livingston | 2.5% | 0.84%(+1.63)#86 | 1.1%(+1.38)#2,566 |
| 87. | Southwest Sandhill | 2.5% | 0.84%(+1.62)#87 | 1.1%(+1.37)#2,589 |
| 88. | Kemah | 2.4% | 0.84%(+1.58)#88 | 1.1%(+1.33)#2,643 |
| 89. | Sachse | 2.4% | 0.84%(+1.57)#89 | 1.1%(+1.32)#2,660 |
| 90. | Sanger | 2.4% | 0.84%(+1.55)#90 | 1.1%(+1.30)#2,686 |
| 91. | Hilshire Village | 2.4% | 0.84%(+1.54)#91 | 1.1%(+1.30)#2,703 |
| 92. | Hawkins | 2.4% | 0.84%(+1.53)#92 | 1.1%(+1.28)#2,743 |
| 93. | Dumas | 2.4% | 0.84%(+1.52)#93 | 1.1%(+1.28)#2,747 |
| 94. | Perryton | 2.3% | 0.84%(+1.46)#94 | 1.1%(+1.21)#2,847 |
| 95. | Pinewood Estates | 2.3% | 0.84%(+1.43)#95 | 1.1%(+1.18)#2,896 |
| 96. | Taft Southwest | 2.3% | 0.84%(+1.42)#96 | 1.1%(+1.17)#2,929 |
| 97. | Carter | 2.3% | 0.84%(+1.41)#97 | 1.1%(+1.16)#2,941 |
| 98. | Fort Hood | 2.2% | 0.84%(+1.40)#98 | 1.1%(+1.16)#2,958 |
| 99. | Gilmer | 2.2% | 0.84%(+1.38)#99 | 1.1%(+1.14)#2,988 |
| 100. | Sienna | 2.2% | 0.84%(+1.35)#100 | 1.1%(+1.10)#3,048 |
Common Questions
What are the Top 10 Cities with the Highest Percentage of Population Employed in Life, Physical & Social Science in Texas?
Top 10 Cities with the Highest Percentage of Population Employed in Life, Physical & Social Science in Texas are:
#1
24.3%
#2
13.7%
#3
11.0%
#4
9.1%
#5
8.6%
#6
8.5%
#7
7.7%
#8
6.8%
#9
6.8%
#10
6.7%
What city has the Highest Percentage of Population Employed in Life, Physical & Social Science in Texas?
Arroyo Colorado Estates has the Highest Percentage of Population Employed in Life, Physical & Social Science in Texas with 24.3%.
What is the Percentage of Population Employed in Life, Physical & Social Science in the State of Texas?
Percentage of Population Employed in Life, Physical & Social Science in Texas is 0.84%.
What is the Percentage of Population Employed in Life, Physical & Social Science in the United States?
Percentage of Population Employed in Life, Physical & Social Science in the United States is 1.1%.