Cities with the Highest Percentage of Population Employed in Life, Physical & Social Science in New Mexico
RELATED REPORTS & OPTIONS
Life, Physical & Social Science
New Mexico
Compare Cities
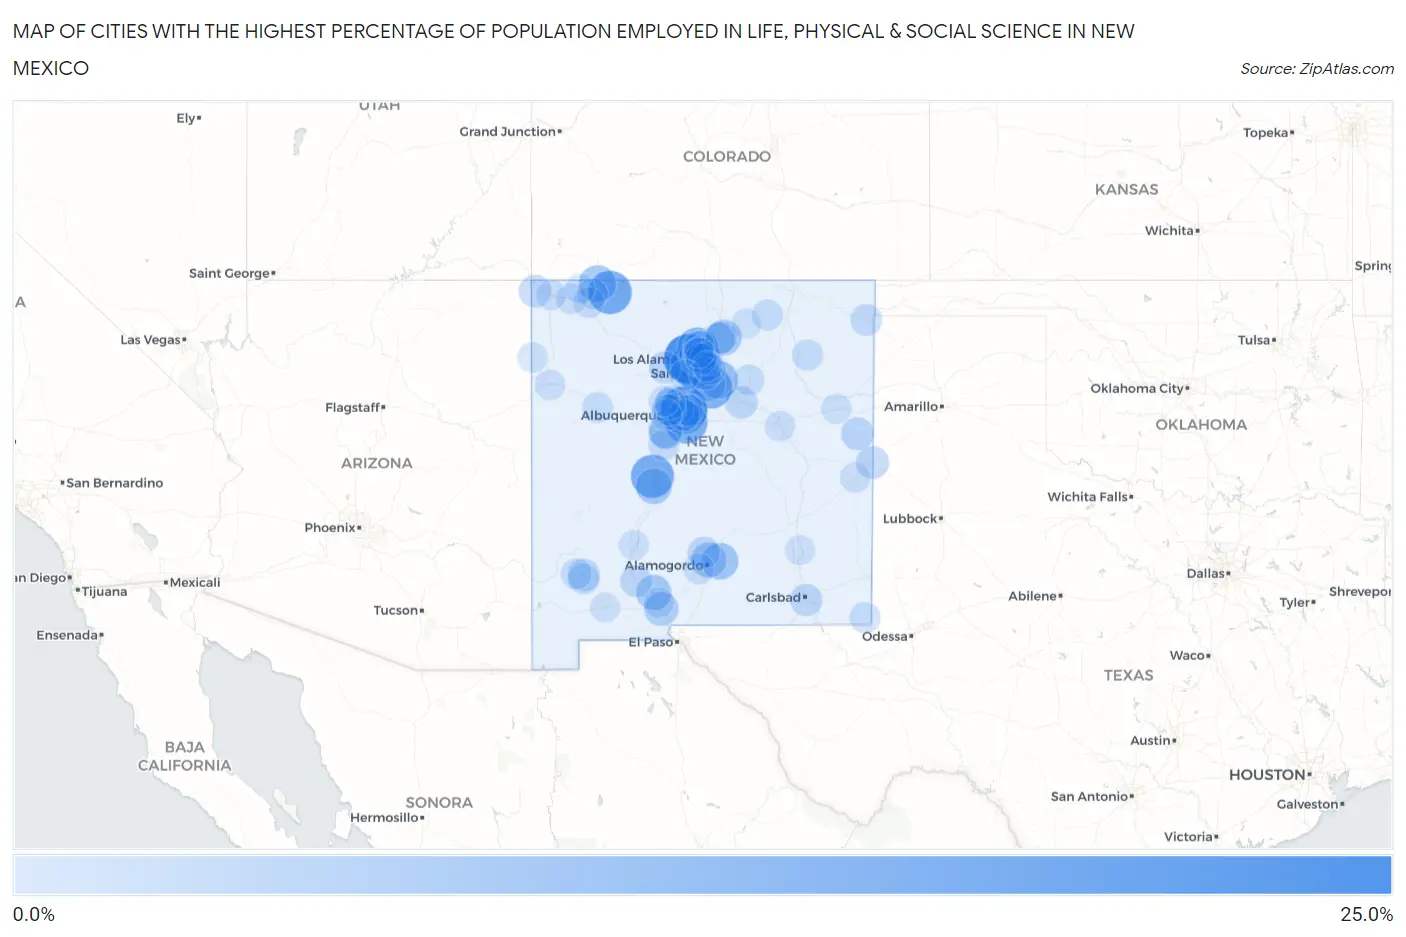
Map of Cities with the Highest Percentage of Population Employed in Life, Physical & Social Science in New Mexico
0.0%
25.0%
Cities with the Highest Percentage of Population Employed in Life, Physical & Social Science in New Mexico
| City | % Employed | vs State | vs National | |
| 1. | Los Alamos | 21.7% | 1.7%(+20.0)#1 | 1.1%(+20.6)#65 |
| 2. | Sandia Park | 19.0% | 1.7%(+17.3)#2 | 1.1%(+18.0)#80 |
| 3. | White Rock | 18.2% | 1.7%(+16.5)#3 | 1.1%(+17.1)#86 |
| 4. | Navajo Dam | 15.2% | 1.7%(+13.5)#4 | 1.1%(+14.1)#113 |
| 5. | Conejo | 15.1% | 1.7%(+13.4)#5 | 1.1%(+14.0)#115 |
| 6. | Paa-Ko | 14.7% | 1.7%(+13.0)#6 | 1.1%(+13.6)#123 |
| 7. | Polvadera | 14.6% | 1.7%(+12.9)#7 | 1.1%(+13.5)#125 |
| 8. | Ponderosa Pine | 13.7% | 1.7%(+12.0)#8 | 1.1%(+12.6)#146 |
| 9. | Lamy | 13.5% | 1.7%(+11.8)#9 | 1.1%(+12.4)#147 |
| 10. | Hernandez | 11.5% | 1.7%(+9.79)#10 | 1.1%(+10.4)#184 |
| 11. | Glorieta | 9.1% | 1.7%(+7.42)#11 | 1.1%(+8.04)#274 |
| 12. | San Ildefonso Pueblo | 8.5% | 1.7%(+6.79)#12 | 1.1%(+7.40)#308 |
| 13. | Cedar Hill | 8.2% | 1.7%(+6.46)#13 | 1.1%(+7.07)#329 |
| 14. | Cloudcroft | 7.8% | 1.7%(+6.08)#14 | 1.1%(+6.69)#358 |
| 15. | Santa Fe Foothills | 7.4% | 1.7%(+5.71)#15 | 1.1%(+6.32)#384 |
| 16. | Socorro | 6.9% | 1.7%(+5.21)#16 | 1.1%(+5.83)#441 |
| 17. | Cedar Crest | 6.9% | 1.7%(+5.17)#17 | 1.1%(+5.78)#448 |
| 18. | Vadito | 6.8% | 1.7%(+5.05)#18 | 1.1%(+5.67)#465 |
| 19. | Tano Road | 6.7% | 1.7%(+4.96)#19 | 1.1%(+5.58)#470 |
| 20. | El Rancho | 6.6% | 1.7%(+4.85)#20 | 1.1%(+5.46)#494 |
| 21. | San Antonito Cdp Bernalillo County | 6.5% | 1.7%(+4.79)#21 | 1.1%(+5.40)#502 |
| 22. | La Luz | 6.4% | 1.7%(+4.69)#22 | 1.1%(+5.30)#516 |
| 23. | Radium Springs | 6.3% | 1.7%(+4.58)#23 | 1.1%(+5.19)#534 |
| 24. | Jacona | 6.1% | 1.7%(+4.44)#24 | 1.1%(+5.05)#557 |
| 25. | San Pablo | 5.5% | 1.7%(+3.78)#25 | 1.1%(+4.39)#675 |
| 26. | Sombrillo | 5.0% | 1.7%(+3.30)#26 | 1.1%(+3.91)#792 |
| 27. | Ohkay Owingeh | 4.9% | 1.7%(+3.17)#27 | 1.1%(+3.78)#824 |
| 28. | Pueblo Of Sandia Village | 4.8% | 1.7%(+3.06)#28 | 1.1%(+3.67)#857 |
| 29. | Peralta | 4.6% | 1.7%(+2.88)#29 | 1.1%(+3.49)#916 |
| 30. | Bosque Farms | 4.5% | 1.7%(+2.84)#30 | 1.1%(+3.45)#925 |
| 31. | La Mesilla | 4.5% | 1.7%(+2.78)#31 | 1.1%(+3.39)#960 |
| 32. | Kirtland Afb | 4.3% | 1.7%(+2.58)#32 | 1.1%(+3.19)#1,046 |
| 33. | Center Point | 4.1% | 1.7%(+2.45)#33 | 1.1%(+3.06)#1,100 |
| 34. | Eldorado At Santa Fe | 3.7% | 1.7%(+2.00)#34 | 1.1%(+2.61)#1,331 |
| 35. | Texico | 3.7% | 1.7%(+1.98)#35 | 1.1%(+2.59)#1,352 |
| 36. | Las Campanas | 3.6% | 1.7%(+1.93)#36 | 1.1%(+2.55)#1,382 |
| 37. | Grady | 3.6% | 1.7%(+1.87)#37 | 1.1%(+2.48)#1,422 |
| 38. | Nambe | 3.5% | 1.7%(+1.81)#38 | 1.1%(+2.42)#1,469 |
| 39. | Villanueva | 3.4% | 1.7%(+1.73)#39 | 1.1%(+2.34)#1,530 |
| 40. | Edgewood | 3.3% | 1.7%(+1.62)#40 | 1.1%(+2.23)#1,599 |
| 41. | Santa Fe | 3.3% | 1.7%(+1.61)#41 | 1.1%(+2.22)#1,603 |
| 42. | Placitas Cdp Sandoval County | 3.3% | 1.7%(+1.58)#42 | 1.1%(+2.19)#1,627 |
| 43. | Sandia Heights | 3.3% | 1.7%(+1.56)#43 | 1.1%(+2.17)#1,641 |
| 44. | Beclabito | 3.3% | 1.7%(+1.56)#44 | 1.1%(+2.17)#1,643 |
| 45. | Bayard | 3.2% | 1.7%(+1.54)#45 | 1.1%(+2.15)#1,668 |
| 46. | Chamisal | 3.2% | 1.7%(+1.48)#46 | 1.1%(+2.09)#1,709 |
| 47. | Tularosa | 3.1% | 1.7%(+1.42)#47 | 1.1%(+2.03)#1,773 |
| 48. | San Jose Cdp Rio Arriba County | 3.1% | 1.7%(+1.36)#48 | 1.1%(+1.97)#1,835 |
| 49. | Hatch | 3.0% | 1.7%(+1.26)#49 | 1.1%(+1.87)#1,912 |
| 50. | Carlsbad | 3.0% | 1.7%(+1.25)#50 | 1.1%(+1.86)#1,922 |
| 51. | Jemez Springs | 2.9% | 1.7%(+1.24)#51 | 1.1%(+1.85)#1,932 |
| 52. | Rio Lucio | 2.8% | 1.7%(+1.13)#52 | 1.1%(+1.74)#2,036 |
| 53. | Sandia Knolls | 2.7% | 1.7%(+1.05)#53 | 1.1%(+1.66)#2,159 |
| 54. | Los Ranchos De Albuquerque | 2.5% | 1.7%(+0.836)#54 | 1.1%(+1.45)#2,457 |
| 55. | Clayton | 2.5% | 1.7%(+0.789)#55 | 1.1%(+1.40)#2,532 |
| 56. | South River | 2.5% | 1.7%(+0.787)#56 | 1.1%(+1.40)#2,537 |
| 57. | Tesuque | 2.5% | 1.7%(+0.752)#57 | 1.1%(+1.36)#2,598 |
| 58. | North Valley | 2.4% | 1.7%(+0.701)#58 | 1.1%(+1.31)#2,677 |
| 59. | Barton | 2.4% | 1.7%(+0.666)#59 | 1.1%(+1.28)#2,746 |
| 60. | Chamita | 2.3% | 1.7%(+0.610)#60 | 1.1%(+1.22)#2,836 |
| 61. | Tijeras | 2.3% | 1.7%(+0.560)#61 | 1.1%(+1.17)#2,923 |
| 62. | Tres Arroyos | 2.1% | 1.7%(+0.364)#62 | 1.1%(+0.975)#3,284 |
| 63. | Roy | 2.0% | 1.7%(+0.339)#63 | 1.1%(+0.950)#3,344 |
| 64. | Corrales | 1.9% | 1.7%(+0.245)#64 | 1.1%(+0.856)#3,549 |
| 65. | Cimarron | 1.9% | 1.7%(+0.209)#65 | 1.1%(+0.820)#3,628 |
| 66. | West Hammond | 1.9% | 1.7%(+0.206)#66 | 1.1%(+0.817)#3,630 |
| 67. | Jaconita | 1.9% | 1.7%(+0.194)#67 | 1.1%(+0.805)#3,666 |
| 68. | Hurley | 1.9% | 1.7%(+0.188)#68 | 1.1%(+0.799)#3,689 |
| 69. | Sundance | 1.9% | 1.7%(+0.150)#69 | 1.1%(+0.761)#3,791 |
| 70. | Albuquerque | 1.9% | 1.7%(+0.148)#70 | 1.1%(+0.759)#3,798 |
| 71. | Las Vegas | 1.8% | 1.7%(+0.134)#71 | 1.1%(+0.746)#3,831 |
| 72. | Isleta | 1.8% | 1.7%(+0.127)#72 | 1.1%(+0.738)#3,848 |
| 73. | Cochiti Lake | 1.8% | 1.7%(+0.127)#73 | 1.1%(+0.738)#3,850 |
| 74. | Milan | 1.8% | 1.7%(+0.093)#74 | 1.1%(+0.705)#3,935 |
| 75. | Silver City | 1.8% | 1.7%(+0.081)#75 | 1.1%(+0.692)#3,973 |
| 76. | Jal | 1.8% | 1.7%(+0.074)#76 | 1.1%(+0.685)#3,995 |
| 77. | Holloman Afb | 1.7% | 1.7%(+0.016)#77 | 1.1%(+0.627)#4,168 |
| 78. | Kirtland | 1.7% | 1.7%(+0.000)#78 | 1.1%(+0.611)#4,212 |
| 79. | Aztec | 1.6% | 1.7%(-0.123)#79 | 1.1%(+0.488)#4,567 |
| 80. | Rio Communities | 1.6% | 1.7%(-0.134)#80 | 1.1%(+0.477)#4,596 |
| 81. | Rio Rancho Estates | 1.5% | 1.7%(-0.232)#81 | 1.1%(+0.380)#4,972 |
| 82. | Picacho Hills | 1.4% | 1.7%(-0.294)#82 | 1.1%(+0.318)#5,214 |
| 83. | Santa Rosa | 1.4% | 1.7%(-0.305)#83 | 1.1%(+0.306)#5,255 |
| 84. | Santa Clara Pueblo | 1.4% | 1.7%(-0.342)#84 | 1.1%(+0.270)#5,391 |
| 85. | Rio Rancho | 1.3% | 1.7%(-0.364)#85 | 1.1%(+0.248)#5,490 |
| 86. | Cañoncito | 1.3% | 1.7%(-0.412)#86 | 1.1%(+0.199)#5,720 |
| 87. | Las Cruces | 1.3% | 1.7%(-0.413)#87 | 1.1%(+0.198)#5,726 |
| 88. | Portales | 1.2% | 1.7%(-0.517)#88 | 1.1%(+0.095)#6,203 |
| 89. | Gallup | 1.2% | 1.7%(-0.537)#89 | 1.1%(+0.074)#6,298 |
| 90. | Shiprock | 1.1% | 1.7%(-0.608)#90 | 1.1%(+0.003)#6,676 |
| 91. | Navajo | 1.1% | 1.7%(-0.625)#91 | 1.1%(-0.013)#6,767 |
| 92. | Pena Blanca | 1.1% | 1.7%(-0.630)#92 | 1.1%(-0.019)#6,783 |
| 93. | Tucumcari | 1.1% | 1.7%(-0.643)#93 | 1.1%(-0.032)#6,849 |
| 94. | Deming | 1.1% | 1.7%(-0.651)#94 | 1.1%(-0.040)#6,881 |
| 95. | La Plata | 1.0% | 1.7%(-0.665)#95 | 1.1%(-0.054)#6,949 |
| 96. | Peak Place | 1.0% | 1.7%(-0.697)#96 | 1.1%(-0.086)#7,140 |
| 97. | Angel Fire | 0.96% | 1.7%(-0.744)#97 | 1.1%(-0.133)#7,451 |
| 98. | Espanola | 0.93% | 1.7%(-0.776)#98 | 1.1%(-0.164)#7,640 |
| 99. | Hagerman | 0.91% | 1.7%(-0.793)#99 | 1.1%(-0.182)#7,762 |
| 100. | Truth Or Consequences | 0.90% | 1.7%(-0.800)#100 | 1.1%(-0.189)#7,806 |
Common Questions
What are the Top 10 Cities with the Highest Percentage of Population Employed in Life, Physical & Social Science in New Mexico?
Top 10 Cities with the Highest Percentage of Population Employed in Life, Physical & Social Science in New Mexico are:
#1
21.7%
#2
19.0%
#3
18.2%
#4
15.2%
#5
14.6%
#6
13.7%
#7
13.5%
#8
11.5%
#9
9.1%
#10
8.5%
What city has the Highest Percentage of Population Employed in Life, Physical & Social Science in New Mexico?
Los Alamos has the Highest Percentage of Population Employed in Life, Physical & Social Science in New Mexico with 21.7%.
What is the Percentage of Population Employed in Life, Physical & Social Science in the State of New Mexico?
Percentage of Population Employed in Life, Physical & Social Science in New Mexico is 1.7%.
What is the Percentage of Population Employed in Life, Physical & Social Science in the United States?
Percentage of Population Employed in Life, Physical & Social Science in the United States is 1.1%.